Charting My Office Building, Floor by Floor
My notebook said: draw a diagram of every floor of the building where you work, and write down everything you know about the people who work there. Thinking of the Korean office-factory block I work in, I start with what these 'knowledge industry centres' are and why so many now stand partly empty. I compare how much floor one person needs under fire codes, housing standards and office benchmarks, then follow the technology that solves space by calculation: the 1957 plant-layout problem, CRAFT and the Allen curve, parking solvers, generative office design, floor-plan datasets and furniture-layout research. An interactive stacks an imaginary building floor by floor, seats teams in an office you choose, furnishes flats and packs car parks. The twenty-eighth piece in A Page for Today.
The notebook fell open to this line today.
Draw a diagram of every floor of the building where you work. Write down everything you know about the people who work there.
I work in a jisik saneop center — a "knowledge industry centre", Korea's name for a multi-tenant office-factory block. The lift has close to twenty floor buttons, and identical steel doors line both sides of every corridor, each with a unit number and a company name. After years of coming and going, what I know amounts to a few people I bump into outside the toilets on my floor, the clerk at the ground-floor convenience store, and the unit where parcels always pile up. When I tried to do what the notebook asked, drawing the boxes took no time at all. I had nothing to write in them.
So I changed the order. Before writing about the people, I would draw the space properly. Buildings like this often publish floor-by-floor plans in their sales brochures, so plans of similar buildings are easy to find online. Looking at them raised another question. How many people can sit in one of these units? Where should the desks go, and the meeting room? People have long solved this by hand, but it is also a problem computers have been solving for decades.
The building once called an "apartment-type factory"
The knowledge industry centre has a legal definition. Under the enforcement decree of Korea's Industrial Cluster Act, it is a collective building of at least three storeys above ground, able to house six or more factories or knowledge-industry and ICT businesses, with above-ground floor area of at least 300% of its footprint. It is often said to need six storeys, but the decree says three. Its original name was "apartment-type factory". The legal basis appeared in 1988, and a 2010 amendment gave it the current name. As the old name suggests, it is a factory stacked up like an apartment block. The lower floors are often drive-in floors where trucks climb to the unit door, and the upper floors are packed with small office units.
According to reports on a vacancy package announced by government ministries in September 2026, 1,553 knowledge industry centres have been approved, 77.2% of them in Seoul, Gyeonggi and Incheon. New approvals peaked at 136 in 2022 and fell to 19 in 2025. Buildings planned when interest rates were low were completed all at once, and empty space grew. As of May 2026 the national vacancy rate was 16.6%, but among the 153 completed between 2023 and 2025 it was 43.5%. KB Financial's research institute estimated that even with no new building, the surplus would take about 13 years to fill. The government widened the list of permitted trades from 78 to 95 and loosened rules to allow studio flats in the support-facility space.
Floor area needs care in these buildings. The contract area in sales adverts includes a share of the lobby, corridors, lifts, toilets and parking. The net area you actually use behind your door is around half of it. No law fixes the ratio, and about 50% is common in the industry. One real listing had 106.68 m² net in a 237 m² sale area, or 45%. A "100 m² office" usually means about 50 m² of floor you can put desks on.
Charting it floor by floor
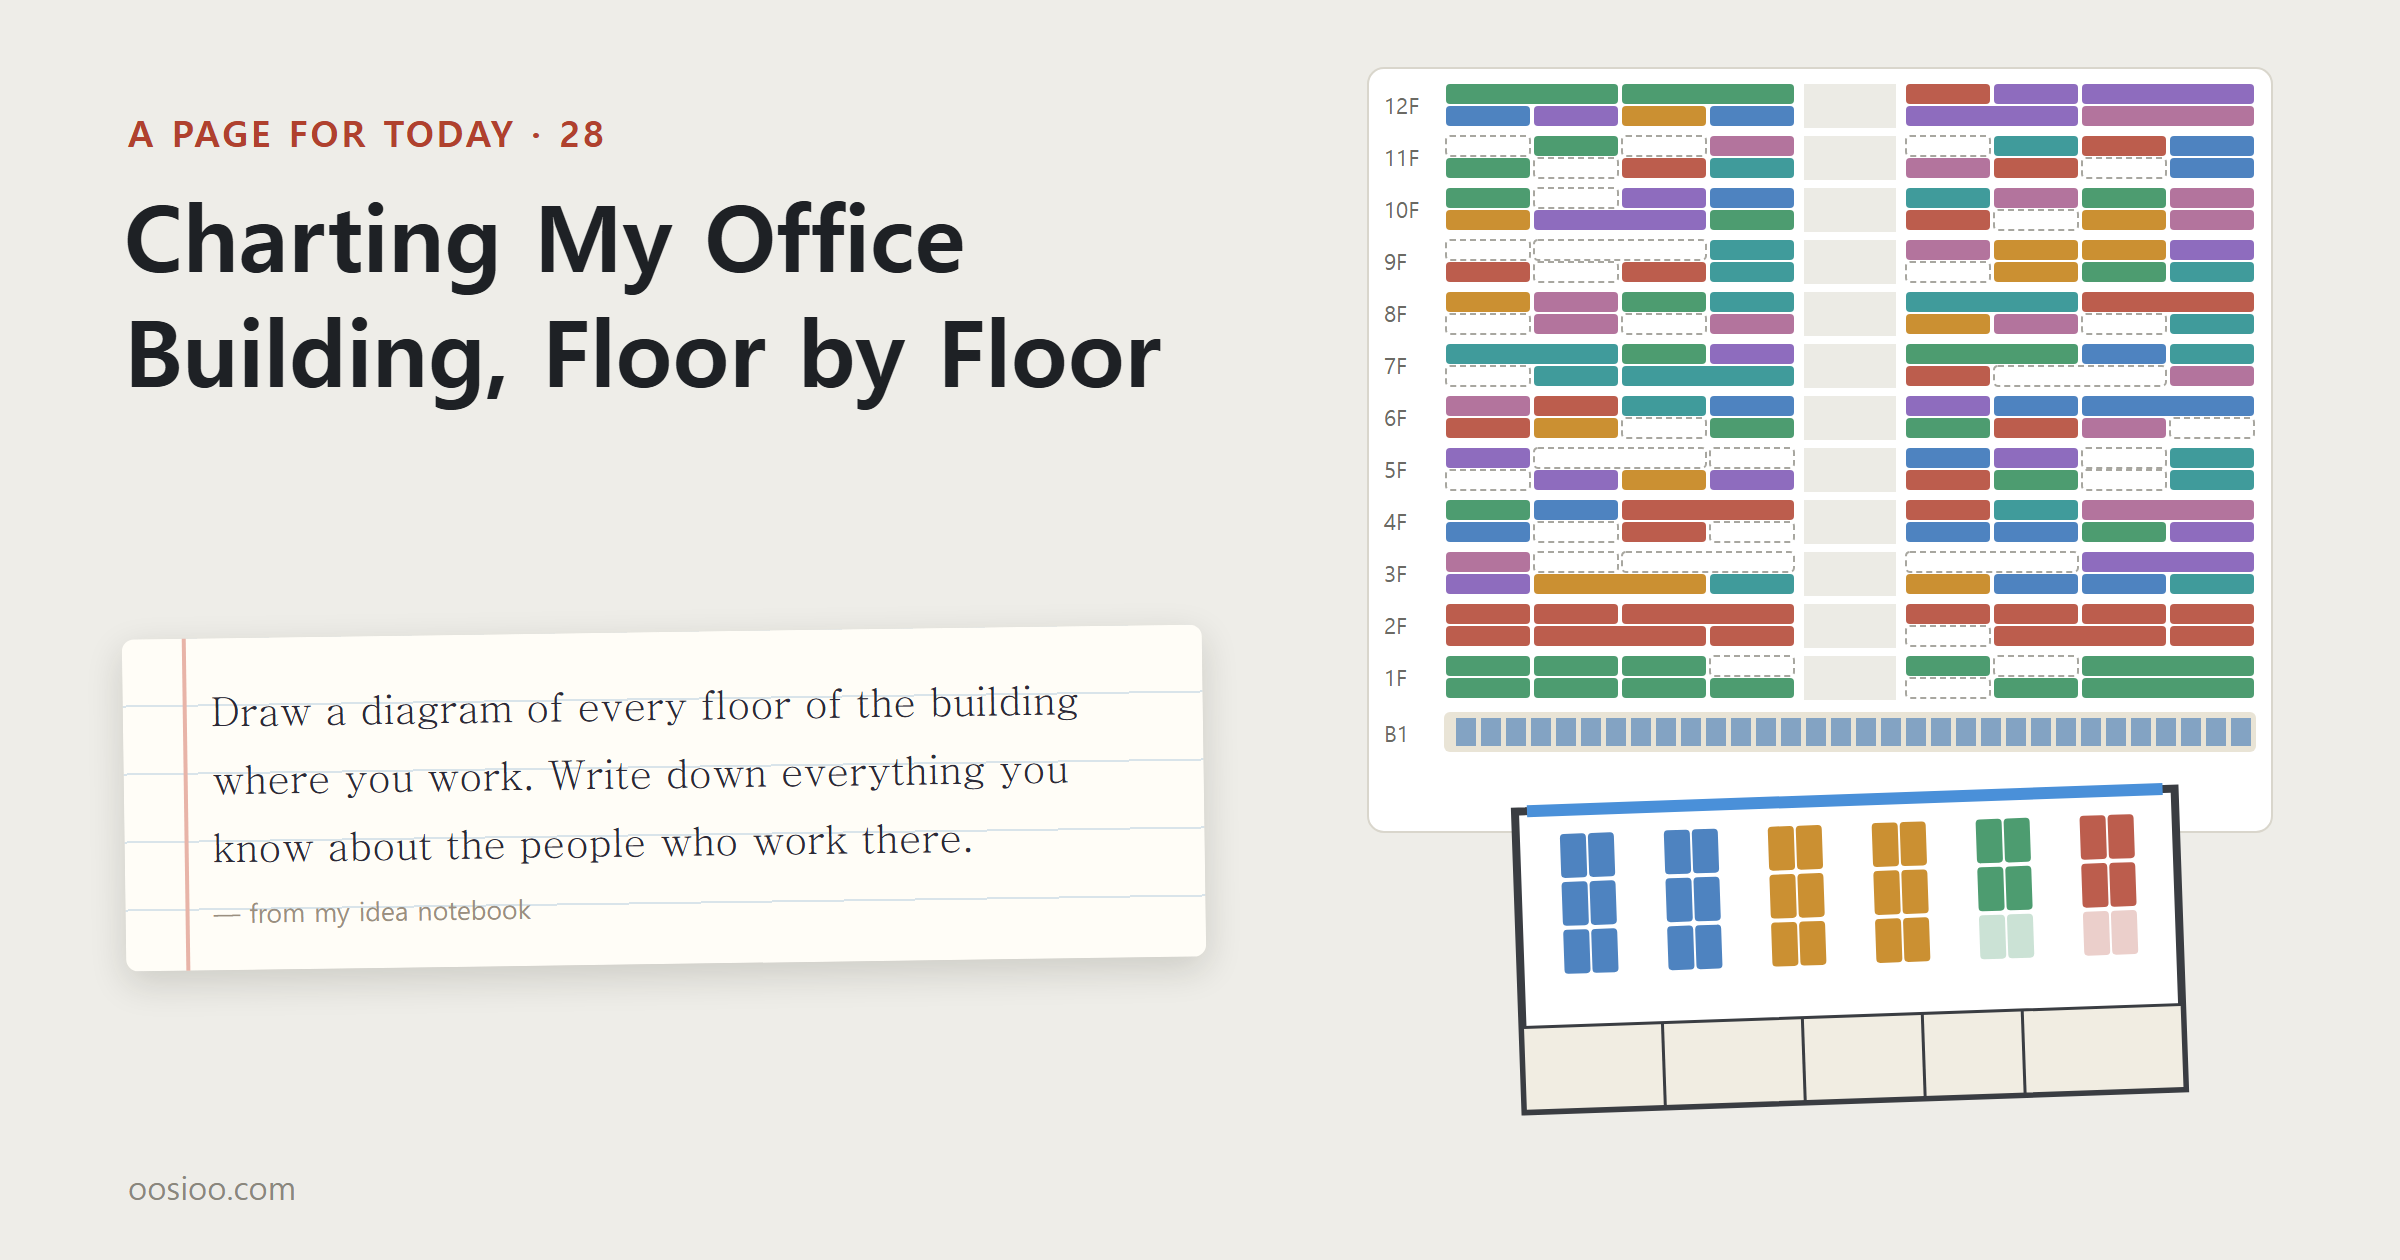
To draw a building floor by floor as the notebook asked, I put up an imaginary knowledge industry centre in the first tab of the interactive below. A stair-and-lift core sits in the middle, with eight 83 m² (net) units on each side of the corridor, sixteen to a floor — a common double-loaded plan. The ground floor has a convenience store and restaurants, floors 2 and 3 are drive-in manufacturing floors, and floor 4 up are office units. I assumed an area per person for each trade and estimated each unit's headcount: 8 m² per person for a software firm, 22 m² for electronics manufacturing, 45 m² for logistics and storage.
Build it 15 storeys high with 17% vacancy and you get a little over 150 tenants and more than 1,500 people coming to work every day. Knowing a few people on my floor means knowing less than 1% of the building. When the solver laid out parking bays on three basement levels, it fit 169 per level, a little over 500 in all. Three times as many people come to work as there are bays. The numbers show why these buildings cluster near metro stations.
Tap a unit in the chart and you see its trade, area and estimated headcount, with space below to write what you know about the people there: the four you meet outside the snack bar every lunchtime, the office whose lights stay on late on Fridays, the company name printed on the parcel boxes. Try it and the boxes fill quickly while the notes stay almost empty. That gap may be what the notebook was after.
How much floor does one person need?
Ask how many people fit in a unit and the answer changes several-fold depending on the rule.
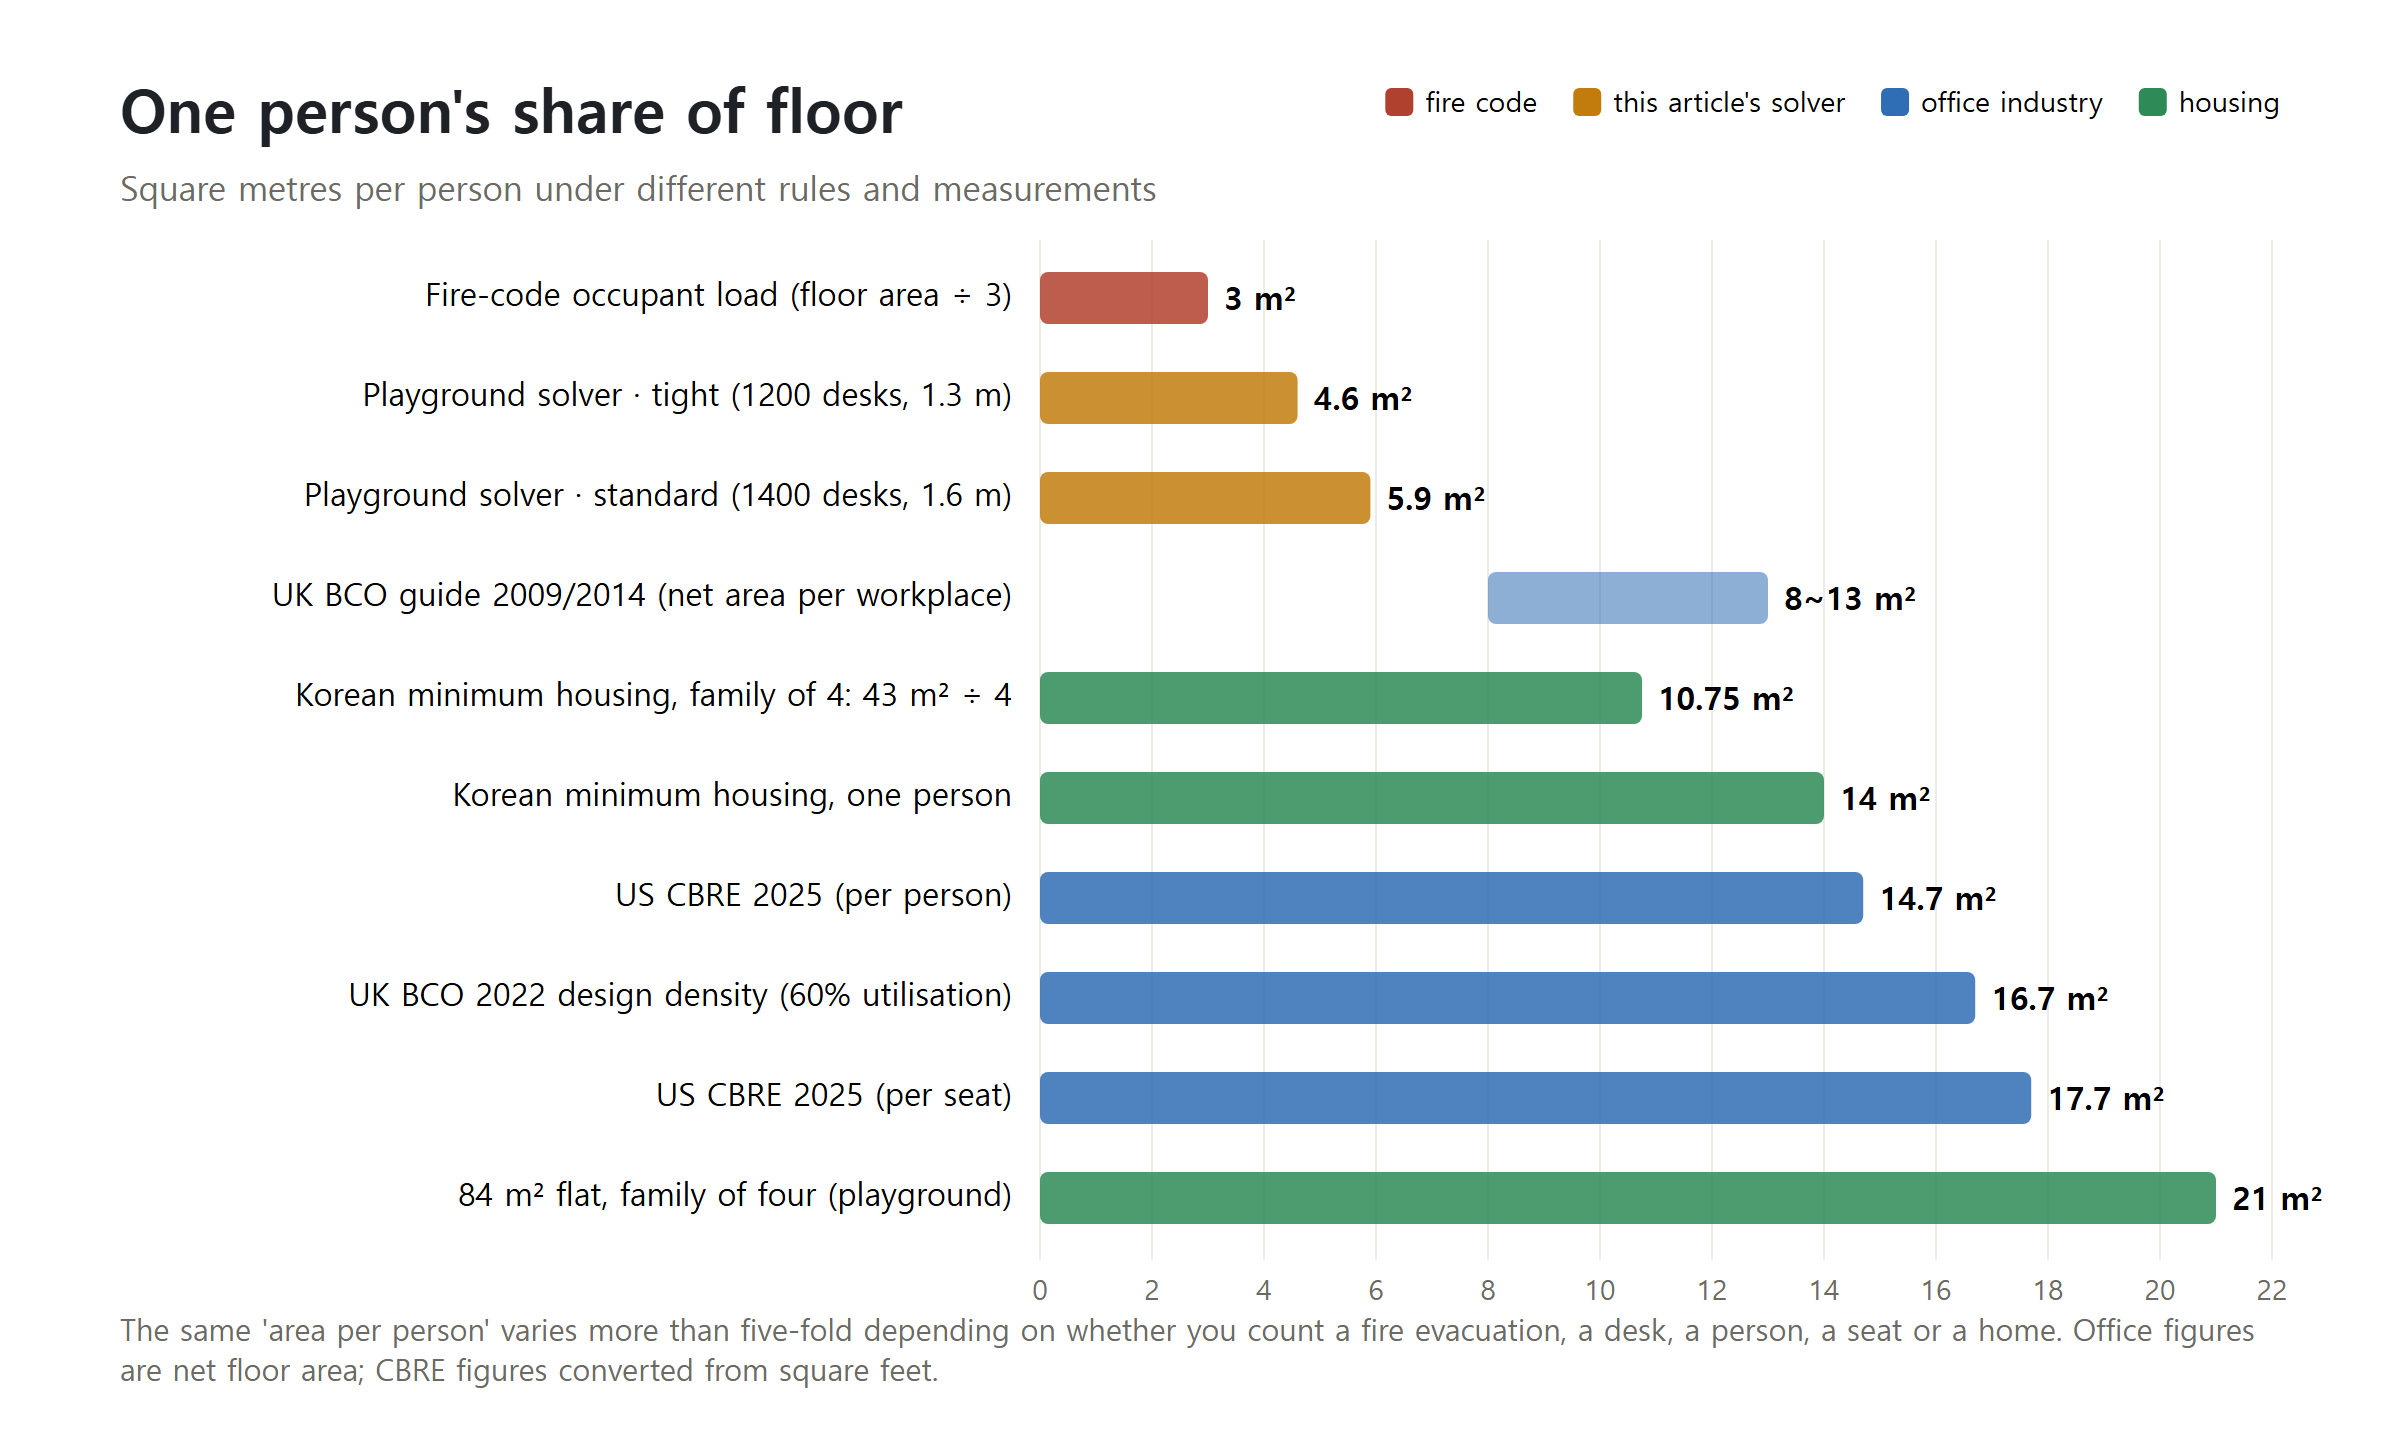
The densest figure is the fire code. Korea's fire-safety decree counts the occupant load of offices and similar spaces as floor area divided by 3 m². It is meant to overcount the people who must escape a fire, so it has little to do with a good density for working. The often-quoted "10 m³ per person" comes from Article 84 of the Occupational Safety and Health Standards Rules, but it applies to indoor workplaces exposed to gases and the like, not to offices in general.
The office industry abroad uses other numbers. The British Council for Offices (BCO) recommended 8–13 m² of net area per workplace in its 2009 and 2014 guides. In 2022 it proposed a default of 10 m², and, assuming only 60% of desks are occupied, designing toilets and lifts for one person per 16.7 m². In US property firm CBRE's 2025 survey, the figure was about 190 sq ft (17.7 m²) per seat and about 158 sq ft (14.7 m²) per person. With hybrid work, 48% of companies now aim for more than one person per desk, and none aim for one desk each. Whether you measure net or leased area, per seat or per person, changes the number.
Homes have floor standards too. Korea's minimum housing standard (2011) sets 14 m² for one person, 26 m² for a couple and 43 m² for a family of four. The 85 m² "national housing size" that Korean flat sales treat as a yardstick dates from the 1973 enforcement decree of the 1972 Housing Construction Promotion Act. A popular explanation is five family members at about 16.5 m² each, but I could not find an official document giving that reasoning.
A lineage of machines that solve space
Deciding where rooms, desks and parking bays go has long been a mathematical problem. In 1957 the economists Koopmans and Beckmann published in Econometrica the problem of assigning several plants to several sites, one each, so as to minimise the sum of flows between plants multiplied by distance. Today it is called the quadratic assignment problem (QAP), and it is known to become extremely hard to solve exactly as soon as it grows a little. Assigning departments to rooms and teams to clusters of desks have the same shape.
Methods people could use by hand followed. In 1961 Richard Muther introduced Systematic Layout Planning, with a relationship chart rating every pair of departments on six grades from "absolutely necessary to be close" (A) to "undesirable" (X). Armour and Buffa's CRAFT in 1963 was an early program to solve this by computer. It tried swapping the positions of two departments, kept the swap if the cost fell, and repeated until no swap helped. In 1967 came CORELAP and ALDEP, which built new layouts by adding departments one at a time from the relationship chart.
Research also showed what these methods should minimise. In his 1977 book Managing the Flow of Technology, MIT's Thomas Allen measured how often engineers in research labs talked and found that conversation dropped quickly with the distance between desks; at about 50 metres, even a weekly technical conversation became rare. The curve, known as the Allen curve, is still cited in office design. In 1984 Bill Hillier and Julienne Hanson's The Social Logic of Space introduced space syntax, which estimates where people will walk most from the way rooms and corridors connect. Stiny and Gips's shape grammars of 1972 showed how a few rules can generate shapes, laying the ground for later work that generates architectural plans automatically.
Parking is what solvers do best
Parking was where this kind of calculation first paid. The rules are clear. Korea's Parking Act rules set a standard bay at 2.5 × 5.0 m and an extended bay at 2.6 × 5.2 m. From March 2019 the standard width grew from 2.3 to 2.5 m and the extended bay from 2.5 × 5.1 m to 2.6 × 5.2 m. Off-street car parks must make more than 30% of bays extended. For right-angle parking, the aisle is 6.0 m wide.
With rules this clear, the problem becomes: treat "row of bays, aisle, row of bays" as one module and decide how many modules to lay on the site, in which direction, starting where. The solver in the fourth tab tries rows across or along the site, shifts the starting point in 50 cm steps, and puts turning aisles at both ends or one, counting hundreds of layouts. It then keeps only the bays a car can actually reach from the entrance. A 40 × 56 m surface car park with right-angle bays holds 80 cars, 28 m² each. The bay itself is 12.5 m²; aisles and leftovers take the rest. That is almost the same as the 300–350 sq ft (28–33 m²) per car used in American planning practice.
Change the angle and the result changes. At 60° on the same site the aisle narrows to 4.5 m, but because the bays lie at a slant, fewer fit in each row, and the count falls to 70. Basements like a knowledge industry centre's, with columns every 8.4 m, are often designed so that three standard bays (7.5 m) fit between columns. Switch to extended bays in the interactive and 169 drops to 157. The bays are only 10 cm wider, but in places three no longer fit between columns. Some companies have turned this kind of calculation into products. TestFit, founded in Dallas in 2016, takes a site and draws building and parking layouts together to test feasibility.
Putting a solver on an office
Offices are harder than car parks. It is not only how many seats fit but who sits next to whom. The second tab offers three imaginary typical floors: a double-loaded corridor with units on both sides, a square plan with units wrapped around a central core, and a single-loaded corridor with units on one side only. Choose up to four adjacent units, the kind of company and team sizes, and the solver works in four steps.
First it zones the space. A 3.6 m strip by the corridor takes meeting rooms, a pantry and storage; a 1.2 m main aisle runs in front of it; desks fill the rest towards the windows. Meeting seats are set at 10–50% of headcount depending on the company. Next it lays desks. It decides whether rows run perpendicular or parallel to the windows and slides row spacing and starting point in 10 cm steps to find the arrangement that fits the most desks without hitting columns. Third, it seats the teams. It scores how well each team stays together and how close frequent collaborators sit, then swaps two people's seats thousands of times. At first it sometimes accepts a swap that makes the cost a little worse, then grows stricter — simulated annealing, which is CRAFT's swapping with randomness mixed in. Finally it places meeting rooms near the people's centre of gravity and the director's room and storage on the far side.
Knock two 83 m² units together and you have 165 m² net, about 330 m² of leased area. With 1400 × 700 desks and rows 1.6 m apart, 28 desks fit. That is 5.9 m² net per person, twice the fire-code figure and denser than the BCO guide. Widen the spacing to 2.0 m and you get 24; narrow it to 1.3 m with 1200 desks and you get 36. The same room varies by up to 1.5 times in desk count. Compared with random seating, simulated annealing cuts the cost by about half.
Real design work does this at a much larger scale. Around 2017, when Autodesk fitted out an office in Toronto's MaRS building, it asked about 250 employees whom they wanted to sit near and how they worked. From the answers it generated about 10,000 layouts, scored them on six goals, and narrowed them to about ten for people to choose from. The coworking company WeWork built a neural network that predicted meeting-room demand from the booking records of more than 800 rooms, and said it was 40% more accurate than its human designers. In November 2020 Autodesk bought Spacemaker, a company automating early-stage architectural design, for $240 million.
Research on machines drawing floor plans has sped up too. In 2019 the RPLAN dataset gathered about 80,000 Chinese apartment plans, and in 2020 Graph2Plan used it to build a model that draws a plan from the connections between rooms. The same year House-GAN was trained on more than 110,000 plans from a Japanese property platform. The MSD dataset of 5,372 Swiss apartment plans was released as well. Buildings like knowledge industry centres, whose floor plans are widely published, are good material for this kind of research.
The same problem at home
The same idea works at home. At SIGGRAPH 2011, the computer graphics conference, two papers on automatic furniture layout appeared together. Merrell and colleagues turned interior-design guidelines into a cost function and sampled at random to find good layouts; Yu and colleagues' "Make It Home" moved furniture by simulated annealing to balance circulation, sightlines and furniture that belongs in pairs.
The third tab imitates this approach. Each piece gets candidate spots: beds, wardrobes and sofas along the walls in 10 cm steps, tables on a floor grid. Overlapping furniture is heavily penalised, as is blocking a door; no room to open a wardrobe is penalised; a tall piece covering a window is penalised; a sofa and TV that do not face each other, or sit too close or too far apart, are penalised. Then it looks for the layout with the lowest penalty. Finally it checks whether you can walk from the door along a 50 cm path to the front of each piece.
I tried a person living alone in a 24 m² studio, a young couple in 59 m², a family of four in 84 m², and a couple both working from home in 84 m². The couple in 59 m² have 29.5 m² each, more than twice the 26 m² minimum for two, while the family of four in 84 m² have 21 m² each. Put a single bed, desk and wardrobe in the family's smallest room and the solver sometimes cannot find a way to walk to the desk or wardrobe. The calculation is telling you that a 3 × 3 m room will not hold everything a child owns.
What the solver does not know
Run the solvers in the interactive and space turns out to be quite computable. How many people fit, where a meeting room shortens walking, how many bays one column costs — the answers come quickly. But the number I gave the office solver for "how often teams work together" was one I made up. WeWork's booking records and Autodesk's survey of 250 staff were both ways of getting that number. However good the technology for solving space becomes, the answer depends on what you know about the people who use it.
Back to the notebook, the order of its two sentences seems to matter. Drawing every floor takes a day. Writing what you know about the people there requires stepping inside the distance the Allen curve describes: the same floor, the same lift, the same queue at the snack bar. More empty units in knowledge industry centres and more offices where several people share one desk both mean fewer people inside that distance. At lunch today I should look for someone worth a line in my chart.
A Page for Today is a series in which I open my idea notebook to a random page and lay that day's thoughts on the line I find there. Today a line asking me to chart my office building floor by floor became the twenty-eighth piece. If you spot a wrong number or example, please tell me and I will fix it.