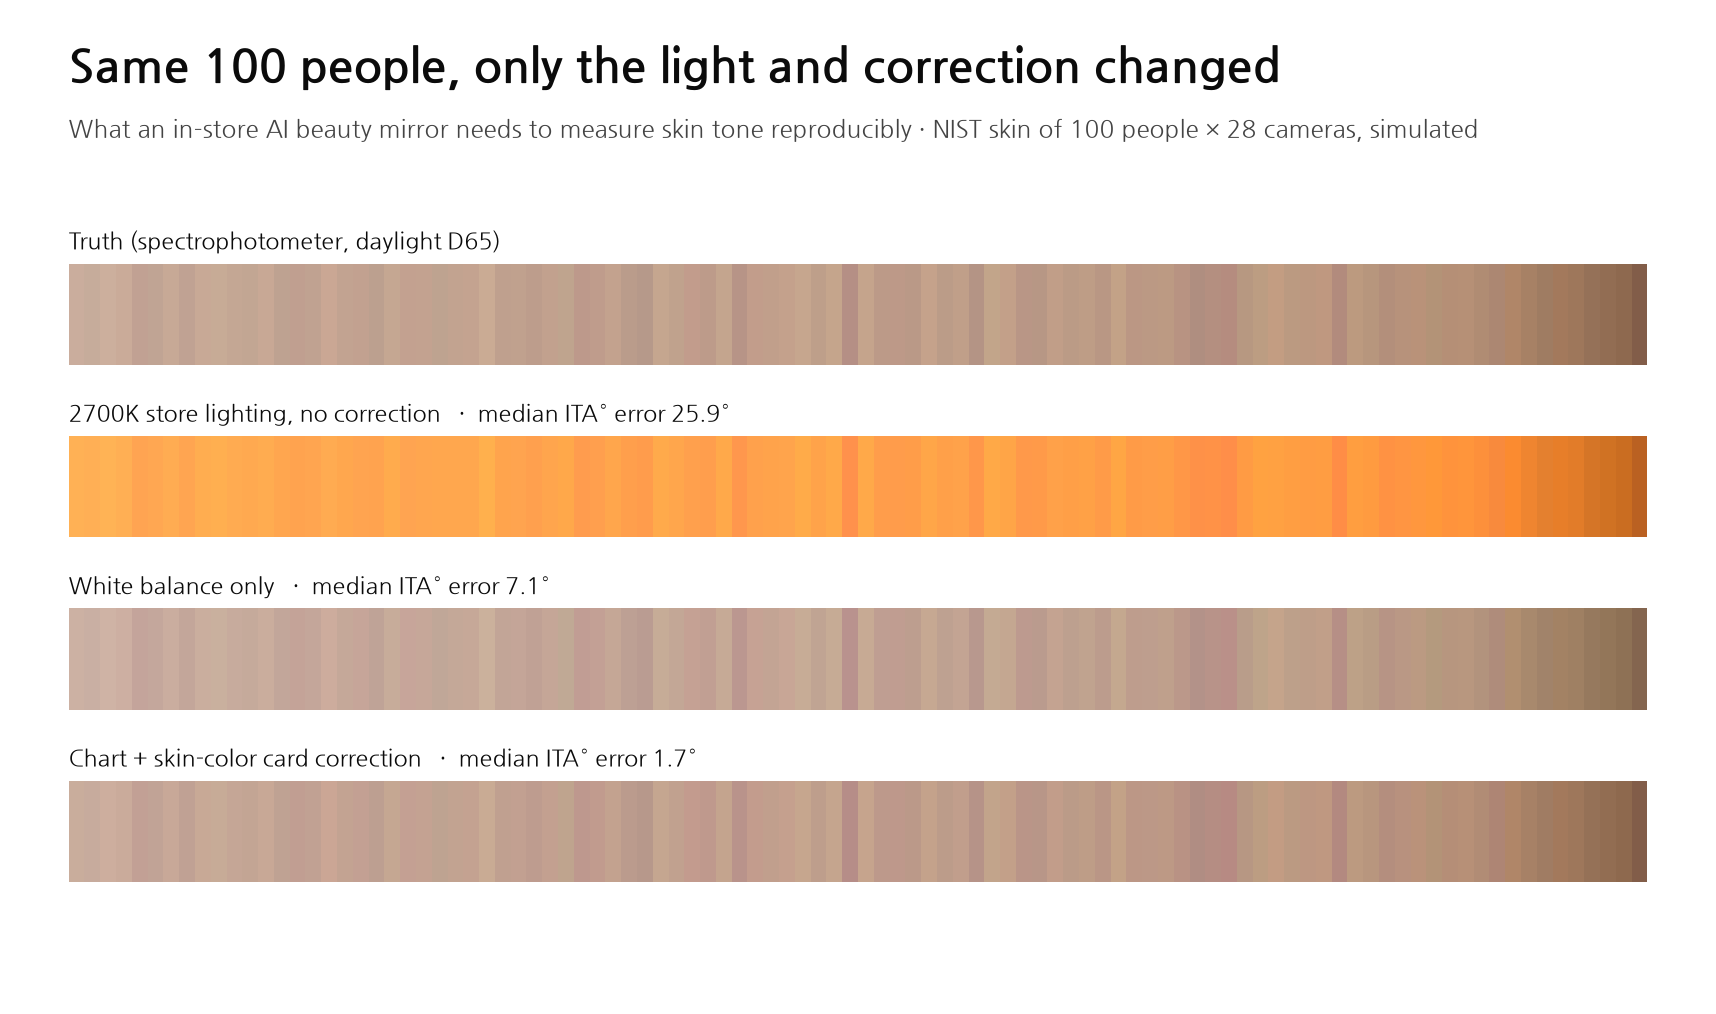
For a Store Mirror to Measure Skin Tone — The Code Takes a Day; Reproducibility Is Decided by Light, Distance and Shine
In-store devices that measure skin, like the Samsung AI Beauty Mirror shown at CES 2026, are spreading. The core calculations — skin-tone angle (ITA°), melanin/blood separation, shine removal — are 20- to 30-year-old methods you can code on a laptop in a day. But when I simulated capturing the measured skin reflectance of 100 people from the US National Institute of Standards and Technology (NIST) with 28 cameras, the results swung widely with the lighting. Measured without correction under 2700K store lighting, ITA° was off by 26° and 92 of 100 people changed category. White balance or a 24-patch color chart still left 6–8°. Adding six skin-color reference swatches brought it down to 1.6°. Leaning in just 5 cm put half of them in a different category, and shine made medium skin tones read up to 17° lighter. In dark skin, one RGB image could barely separate blood at all. A simulator you can run yourself is included.
At CES 2026 in January, Samsung Electronics showed an "AI Beauty Mirror" running skin analysis from Amorepacific. Stand in front of it and cameras measure pores, redness, pigmentation and wrinkles, then suggest a care routine. According to press reports it has three cameras: ordinary color (RGB), ultraviolet (UV) and polarized. Olive Young, Korea's largest health-and-beauty chain, also has skin measurement devices in some 60 stores.
The job descriptions of companies building these devices tend to read alike. Work reliably under real store lighting, switched on all day. Give the same result as people and measurement conditions change. Combine RGB, UV and polarized images to infer what a single photo cannot show.
On paper, none of this looks hard. The formula that turns skin tone into a single angle dates from 1991, and the method for separating melanin and blood from a photo is a 2003 SIGGRAPH paper. Algorithms for removing shine have existed since 2005. When I actually wrote them, all three ran on a laptop within a day. So I changed the question: how far is "it runs" from "it measures the same person the same way in a store"?
What I set out to do
I turned the job description into four experiments.
- Does skin tone come out the same when the lighting changes? Measure how wrong each correction method is under store lights such as halogen, fluorescent and 2700K LED.
- Can shine be removed without polarizing filters? Imitate in software what a polarized camera does.
- What does a UV photo show that others do not? Calculate how dark the same spot looks at different wavelengths.
- Can melanin and blood be separated from one RGB image? Compare light and dark skin.
The problem was ground truth. A photo taken in front of a store mirror does not tell you a person's "true skin color". So I went the other way: start from data where the true color of skin is known, and simulate the camera capturing it.
- Skin: measured reflectance released by NIST in 2017. A spectrophotometer measured how much light at each wavelength from 250 to 2,500 nm comes back from the skin of 100 people, three times each.
- Cameras: spectral sensitivities of 28 digital cameras (Jiang et al., 2013), from Canon, Nikon and Sony bodies to the Nokia N900 phone.
- Lights: nine standard illuminants defined by the International Commission on Illumination (CIE): daylight (D65), halogen (A), fluorescent (FL2), tri-band fluorescent (FL11), LED at 2700K, 4000K and 6600K, and an RGB LED that mixes three colored LEDs.
- Truth: the color a human sees under daylight (CIE L\*a\b\), computed by multiplying reflectance, illuminant and the standard observer curves.
Spectral data alone was not enough for the shine, UV and pigment experiments. I also built an optical skin model in which the amounts of melanin and blood are set first and the skin color follows: a two-layer model with melanin in the epidermis and blood in the dermis. Absorption coefficients follow Jacques (2013) and Prahl's hemoglobin table. Skin made with this model fell between L\* 26–82 and ITA° −68 to +70, broadly overlapping the range of real human skin.
Measuring skin tone as an angle
When cosmetics and dermatology research describe skin tone with one number, the most common choice is ITA° (Individual Typology Angle). It forms an angle from lightness L\ and yellowness b\.
ITA° = arctan((L\ − 50) / b\) × 180 / π
Light skin goes above 55° and dark skin below −30°. The range in between is split into six categories: very light (above 55°), light (41–55°), intermediate (28–41°), tan (10–28°), brown (−30 to 10°) and dark (−30° or below). The Monk Skin Tone scale (MST) that Google released in 2022 works differently: you pick the closest of ten color swatches.
The formula is one line. But that one line leans heavily on L\*. A small change in brightness moves the angle. Most of the numbers below come from this.
The median ITA° of the NIST 100 was 49.6°. The darkest person was −21.6°, so the data leans toward light skin. I come back to this under "What this cannot do".
Experiment 1: when the light changes
For each of the 28 cameras I calibrated color once under daylight (D65), roughly the factory state. Then I changed the light, captured the 100 people, and corrected color four ways.
- None: keep the daylight settings. Only exposure is matched
- White balance: photograph white paper and rebalance the red, green and blue channels. This is phone auto white balance at its best
- 24-patch chart: photograph the 24-patch ColorChecker photographers use and fit a new 3×3 correction matrix
- Chart + skin card: fit with six skin-color swatches added to the 24 patches. The swatches come from the optical model, so they do not overlap with the NIST 100
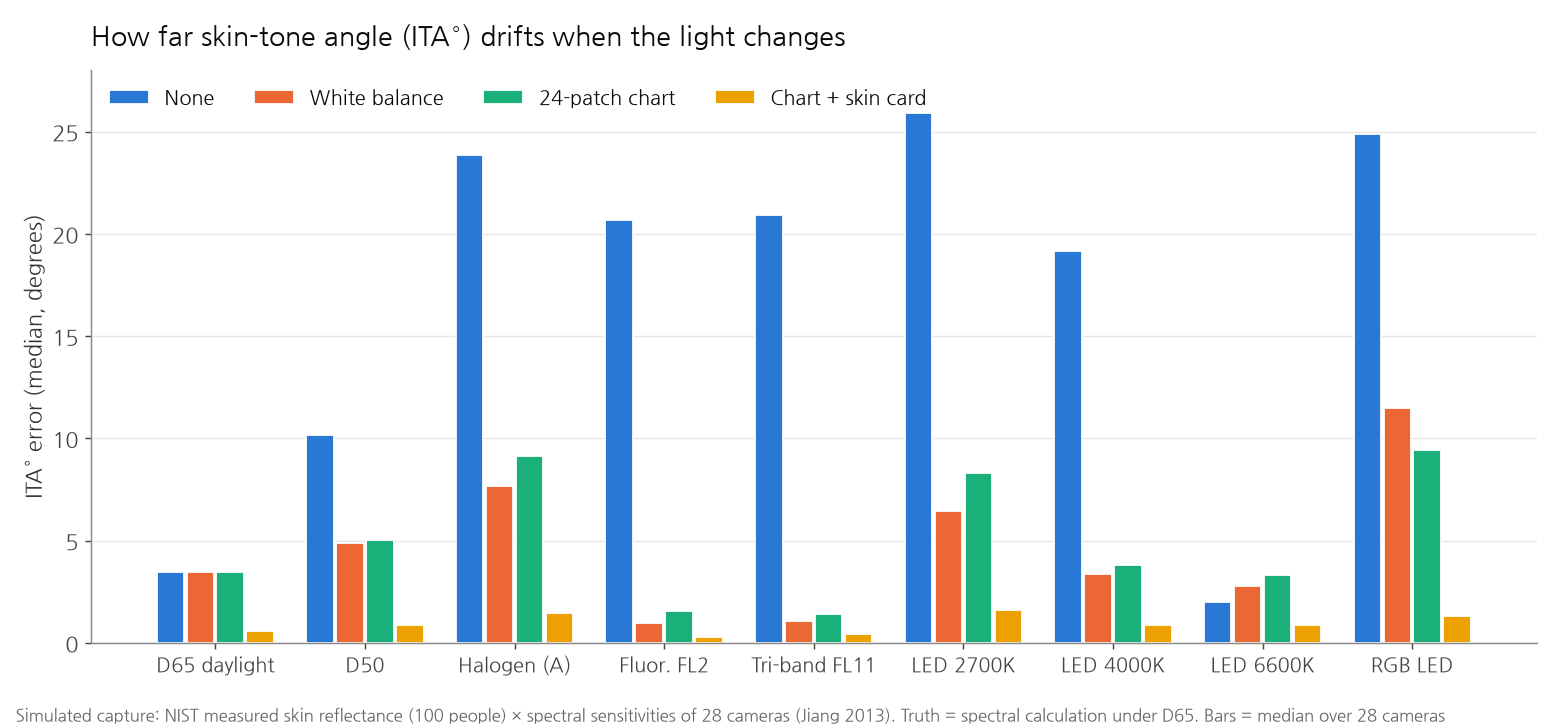
| Light | None | White balance | 24-patch chart | Chart + skin card |
|---|---|---|---|---|
| Daylight D65 | 3.4° | 3.4° | 3.4° | 0.6° |
| Halogen A | 23.9° | 7.7° | 9.2° | 1.5° |
| Fluorescent FL2 | 20.7° | 1.0° | 1.6° | 0.3° |
| LED 2700K | 25.9° | 6.5° | 8.3° | 1.6° |
| LED 4000K | 19.2° | 3.3° | 3.8° | 0.9° |
| RGB LED | 24.9° | 11.5° | 9.4° | 1.3° |
ITA° error, median over 100 people × 28 cameras
Store lighting without correction gives absurd numbers. 26° under 2700K is a category and a half. 92 of 100 people were put in a different category. As in the second band of the cover, everyone turns orange. That much I expected.
Two things I did not.
First, even with the 24-patch chart, 8–9° remains under halogen and 2700K. That is worse than white balance alone. Camera sensors respond to color differently from the human eye, and a 3×3 matrix cannot close that gap. So the matrix compromises across the colors it has to fit. Only two of the 24 patches are skin colors, so the compromise favors other colors such as blue and green. The same reason leaves 3.4° even in daylight.
Second, six skin-color swatches changed everything. Under any light the error stayed within 1.6°. The swatches shift the weight so the matrix fits the neighborhood of skin color precisely. This is not a new finding. A 2017 study that photographed over 300 Korean women also reported smaller errors when correcting with 14 skin-colored patches than with 24 or 140 patches (Choi et al.).
I also looked at how far one person's ITA° moves as the lighting cycles through all nine: no correction 30.0°, white balance 11.6°, 24-patch chart 8.1°, skin card 2.1°. That is how much it would swing if a store changes its lamps or sunlight comes through the window.
When the camera changes
Roll devices out to dozens of stores and each camera module differs a little. I measured how far ITA° spreads when the same person is captured by 28 cameras.
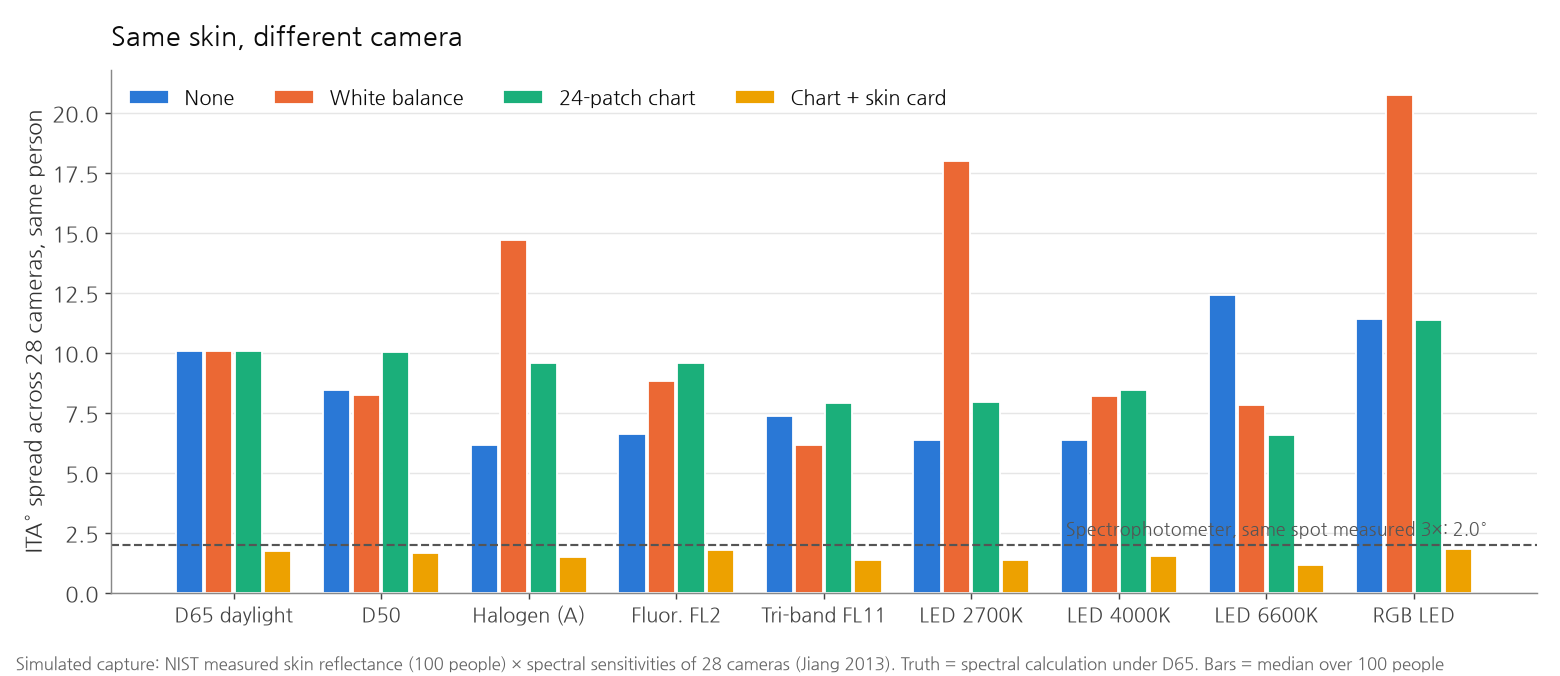
With white balance or the 24-patch chart alone, cameras disagreed by 6–21°. With the skin card it shrank to 1.2–1.8°. The dashed line is the reference: when NIST measured the same spot on the same person three times with a spectrophotometer, ITA° varied by a median of 2.0°. Cameras corrected with the skin card disagree less than the reference instrument disagrees with itself.
Real data tells the same story. A study by Kang released in late 2025 photographed 965 Korean subjects with a DSLR, tablets and smartphones, about 43,000 images in all. Linear color correction cut color error (ΔE) by 67–77%, yet agreement of ITA° between devices (ICC) stayed around 0.4. A melanin index computed from the same photos agreed far better, at 0.77. Small color error does not guarantee a stable ITA°. The study also noted that differences between facial regions (25% of color variance) were more than three times larger than differences between devices (7%). Deciding "where on the cheek to measure" comes first.
Lean in by a hand's width
Even with light and camera under control, one thing remains: distance. If the lights sit in the mirror frame, the closer the face, the brighter it gets. For a point source, brightness falls with the square of distance. Moving from 50 cm to 45 cm makes the face 23% brighter.
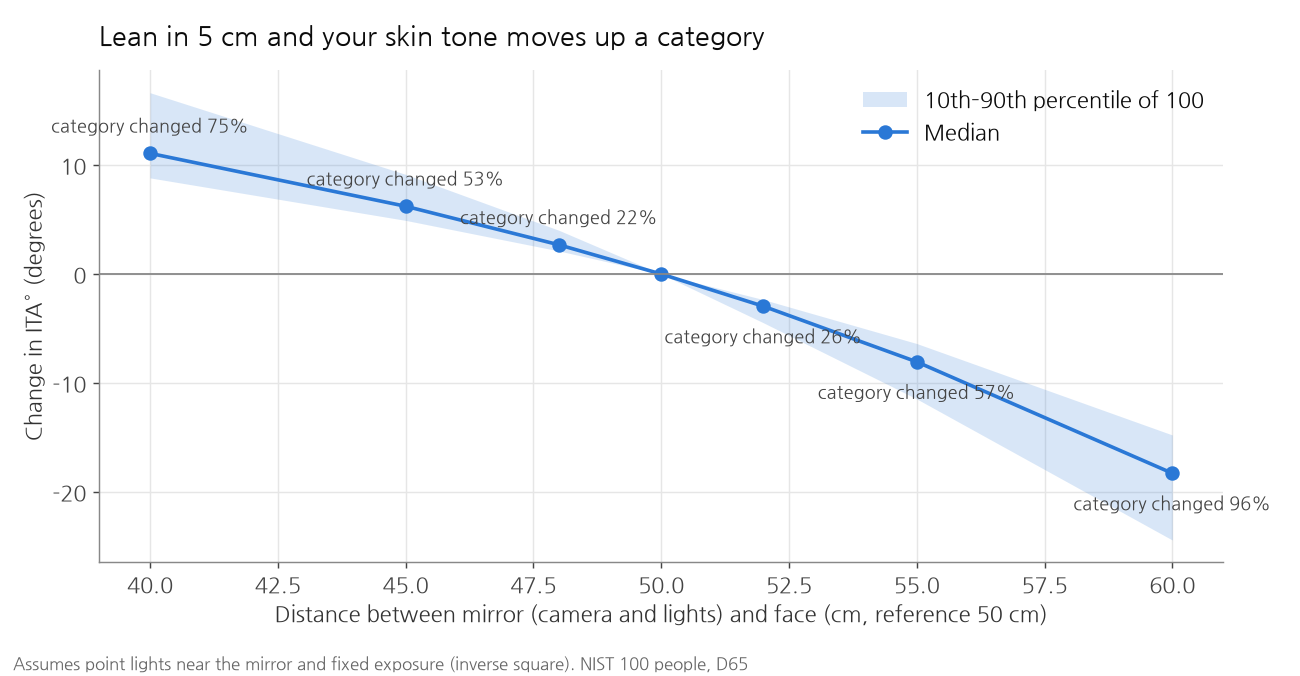
Lean in 5 cm and ITA° rises by about 6°, and 53 of 100 people read one category lighter. Step back 5 cm and 57 read one category darker. That is a hand's width.
This calculation assumes fixed exposure. With auto exposure on, as on a phone, the camera keeps faces at about the same brightness. That reduces the distance problem but creates another: light skin is pulled darker and dark skin lighter, so everyone converges on the middle. A device that measures skin tone should lock exposure and keep a reference card at the same distance as the face. In the simulator, turning on "Reference card sits next to the face" makes the distance problem disappear.
Experiment 2: shine and polarization
When skin is oily, part of the light bounces straight off the surface like a mirror instead of entering the skin. That light carries the color of the lamp, not of the skin, so shiny spots look white.
Skin analysis devices block this with polarization. A polarizer sits in front of the light and another, rotated 90°, in front of the camera. Light that bounces straight off the surface keeps its polarization and is blocked by the camera's polarizer. Light that enters the skin and comes back out is scrambled, and part of it passes. This is called cross-polarized imaging. Skin analyzers such as VISIA use it to capture brown spots and red areas.
Without polarizers, can software imitate this? I used the dichromatic reflection model. In a white-balanced photo the surface reflection is white, adding the same amount to all three channels. Estimate the skin's own color ratio from the less shiny pixels, then subtract the white component pixel by pixel (a simplified version of the Tan–Ikeuchi 2005 and Yang et al. 2010 line of methods). For comparison I added a method that simply discards the brightest 15% of pixels.
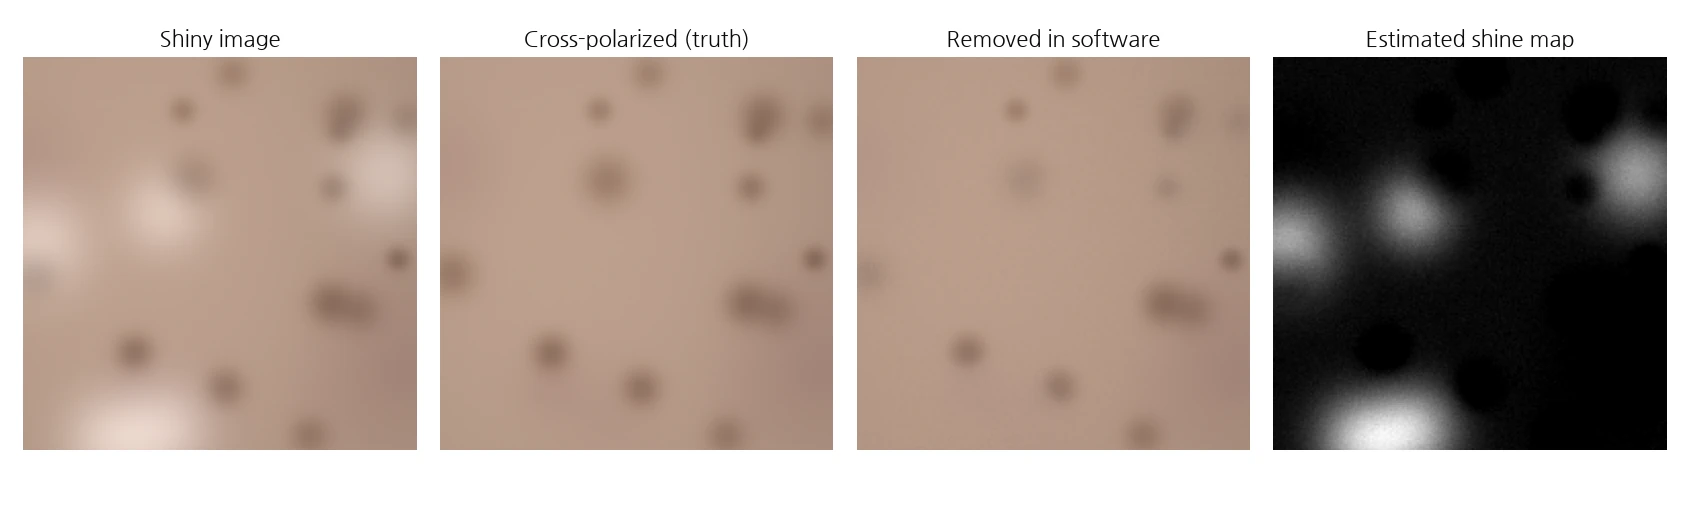
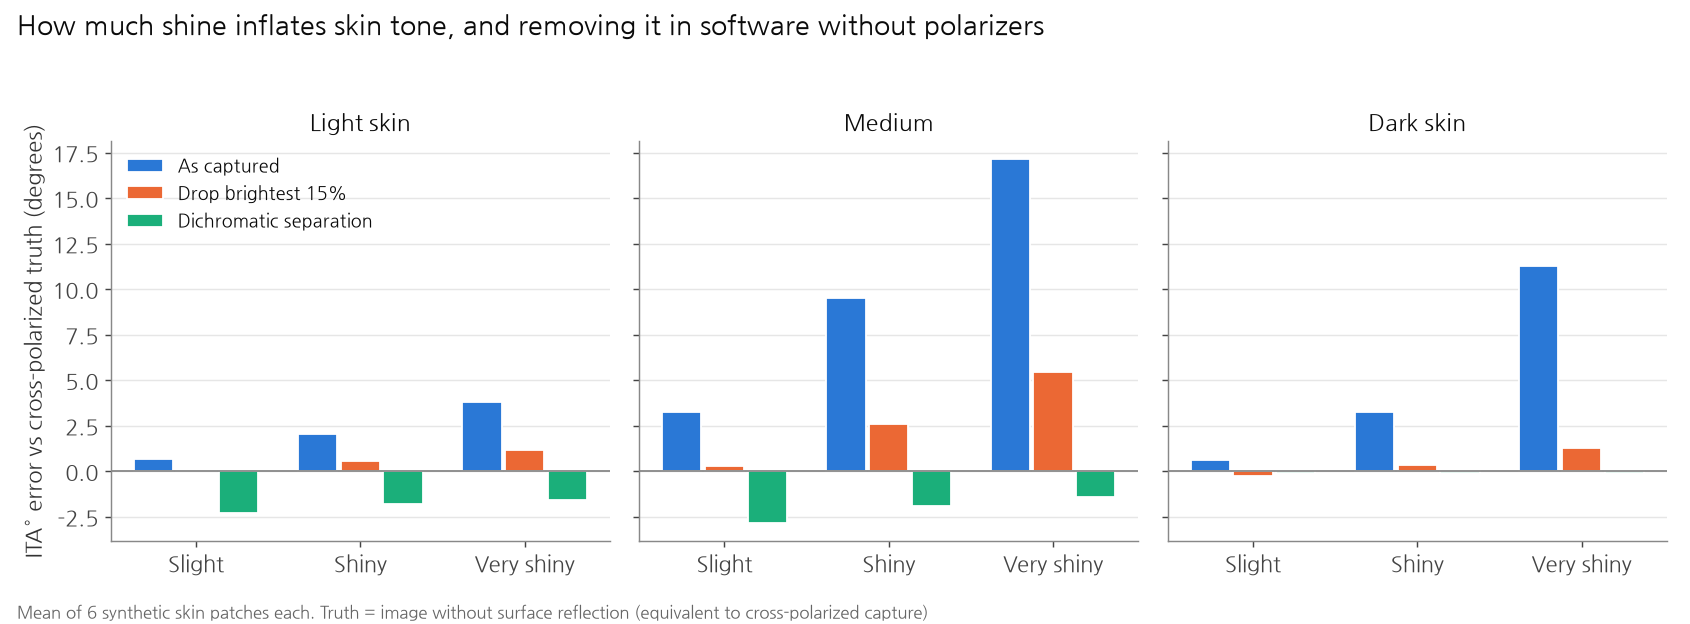
Left alone, shine made medium skin read up to 17° lighter, nearly two categories. Removing it with dichromatic separation brought the error down to 0–3° in medium and dark skin. It worked especially well in dark skin, where the skin's own color is strong and easy to tell apart from the white component.
Where it went wrong was also clear.
- In light skin it shaves off real color. Light skin is pale, so the white component and the skin's own color are hard to tell apart. In the "slight" condition, where only 4% of the area was actually shiny, it estimated 21%, and ITA° tilted 2.3° darker.
- It erases redness too. In the third panel above, the red blotch in the middle has faded. Where blood is dense, the color ratio differs from the average, and it was treated as "something other than skin". For a device that measures redness, this is fatal.
To make software do what two polarizers do, you have to assume the very things you are trying to measure: skin tone and redness. I suspect this is why the job description asks for polarized images separately.
Experiment 3: what a UV photo shows
Melanin absorbs more light the shorter the wavelength: more blue than red, more ultraviolet than blue. So a UV photo should show a spot with a little extra melanin more darkly. I calculated how much darker with the optical model: a spot with 30% more melanin than its surroundings, comparing the brightness difference between spot and surroundings at each wavelength.
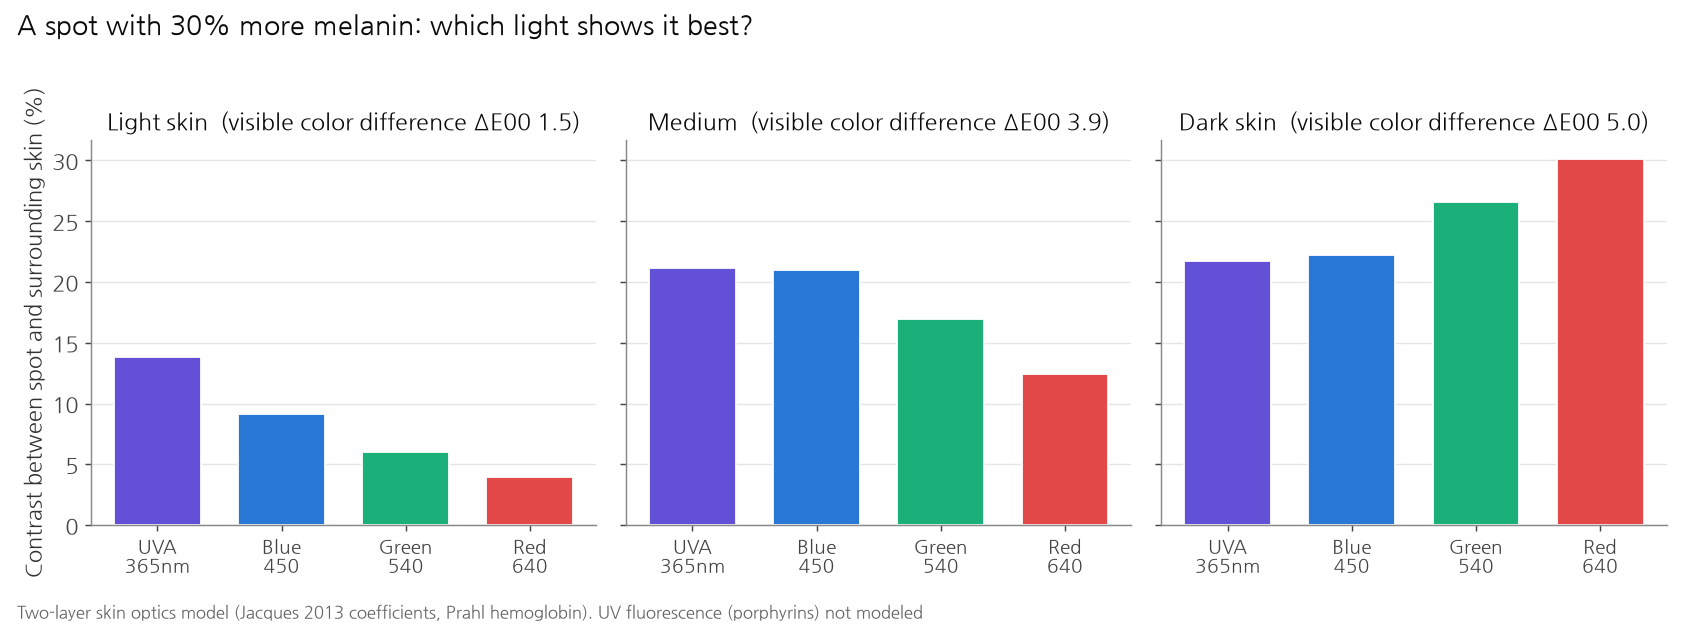
In light skin the UV effect was large: the spot looked 2.3 times darker than in green light. The color difference the eye sees is ΔE00 1.5, which a person barely notices. This is the physical basis for the marketing line that UV photos show "spots you can't see yet".
In dark skin the story flips. UV is already almost fully absorbed, so little light comes back at all. Red light actually gave the larger spot contrast. A UV camera does a different job depending on skin tone.
Under UV, porphyrins produced by acne bacteria also fluoresce orange-red. I did not model that. Fluorescence imaging needs its own light wavelength and filters, and a review notes that the evidence for turning fluorescence intensity into bacterial load is still weak.
Experiment 4: separating melanin and blood
Skin color comes mainly from two pigments: brown melanin and red hemoglobin in the blood. Spots are melanin; redness and breakouts are on the hemoglobin side. For a skin analyzer to show "pigmentation" and "redness" separately, it has to pull them apart.
At SIGGRAPH 2003, Tsumura et al. did this from a single RGB photo. The idea: the amount of light absorbed as it passes through skin is proportional to the amount of pigment, and taking the logarithm of image brightness (optical density) turns that into addition. Each pixel then becomes "melanin direction × melanin amount + blood direction × blood amount + shading". Shading darkens all three channels equally, so remove that direction and look for two mutually independent components in the remaining plane (independent component analysis, ICA). Melanin and blood are distributed independently in the skin, so the independent components are the two pigments.
I tested this on skin patches made with known truth maps: spots (melanin) and red blotches (blood) scattered separately, with shading like the curve of a face. For comparison I used the simple indices found in dermatology meters: redness from the log difference of the red and green channels, melanin from the red channel.
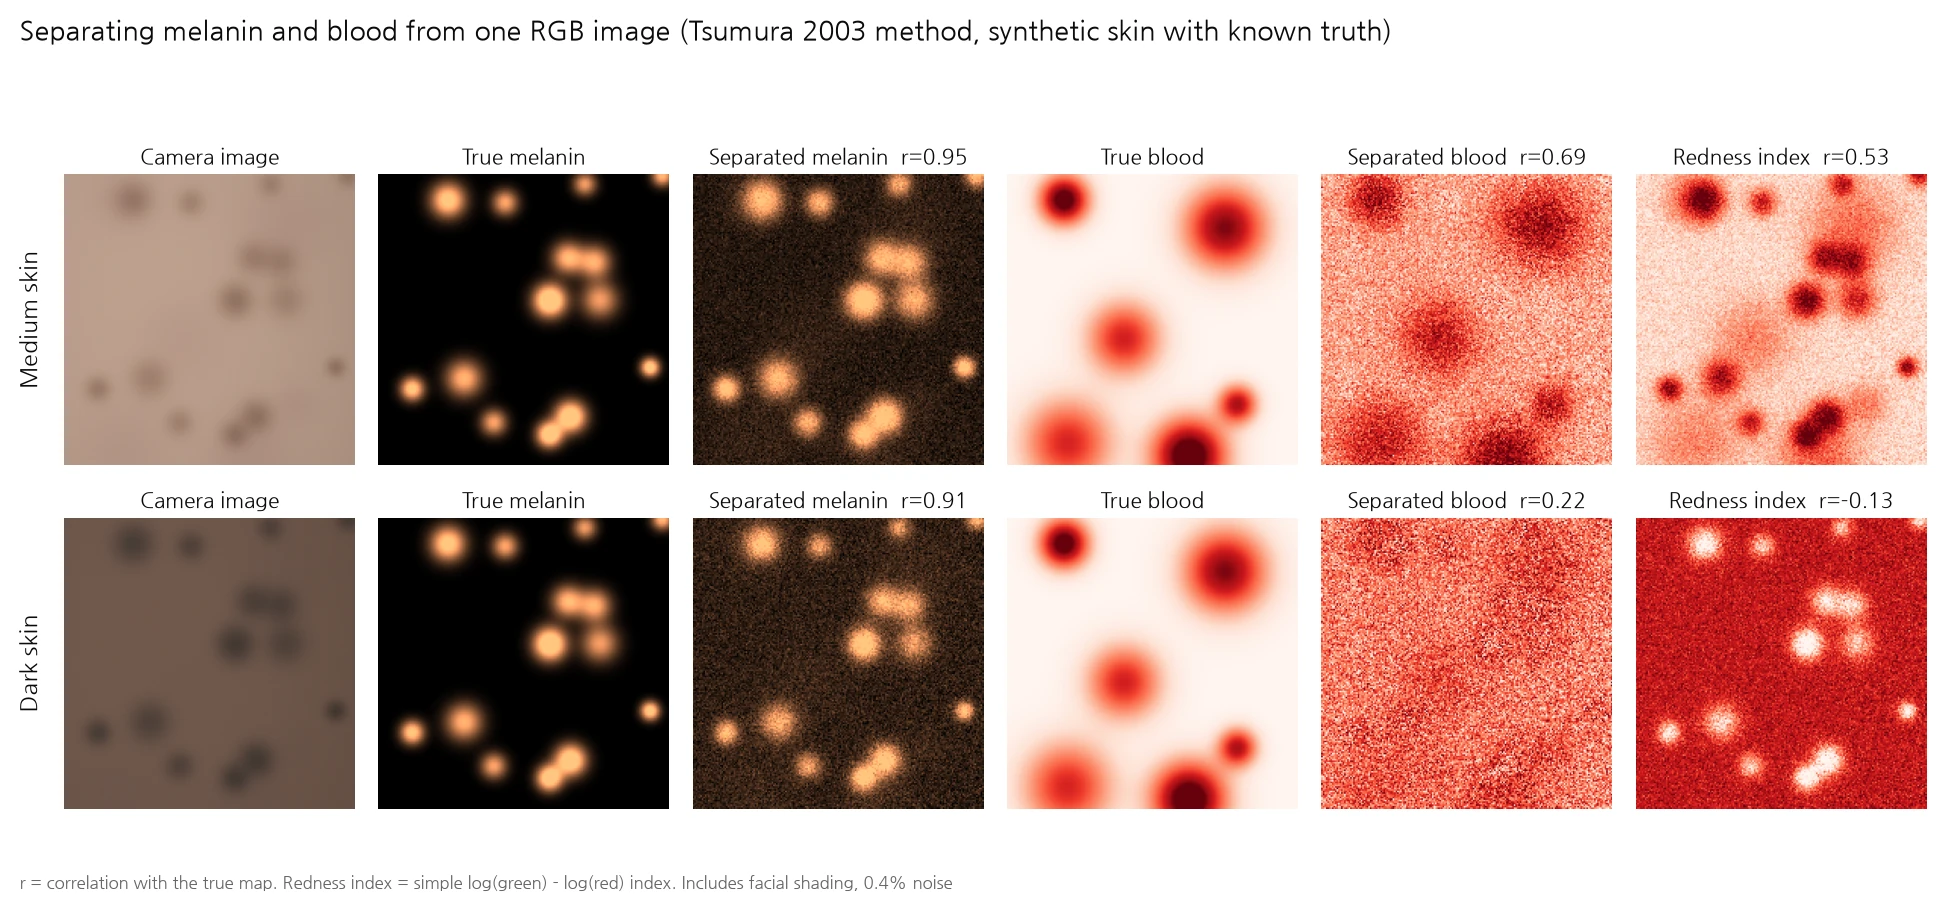
| Skin | Melanin (ICA) | Blood (ICA) | Redness index → blood | Redness index → melanin |
|---|---|---|---|---|
| Light | 0.90 | 0.84 | 0.79 | 0.52 |
| Medium | 0.94 | 0.73 | 0.50 | 0.78 |
| Dark | 0.91 | 0.24 | −0.05 | −0.84 |
Correlation with the true maps. Facial shading included, daylight, mean of 6 patches
Melanin was recovered well regardless of skin tone (0.90–0.94), and it held up under shading. The simple melanin index dropped from 0.75 to 0.46 in light skin once shading was added, while ICA kept 0.90, because the shading direction was removed first.
Blood broke down as skin got darker: 0.84 in light skin, 0.73 in medium, 0.24 in dark. The simple redness index was worse. In dark skin it had nothing to do with blood (−0.05) and was instead strongly tied to melanin (−0.84). A number labeled "redness" was really measuring spots. When melanin in the top layer absorbs the light first, little of the color difference made by the blood underneath survives in the photo. Clinicians also find redness harder to see on darker skin. The same thing happens in the camera.
Under halogen light every correlation dropped by another 0.03–0.14. Pigment separation needs lighting correction first, too.
Try it yourself
On a narrow screen, open it in a new window. A few things worth trying:
- Set the light to "LED 2700K" and click through the correction methods. You can watch the band below go from orange back to the right colors, and the numbers on the right jump between categories.
- With "Chart + skin card", pull the distance to 45 cm. More people change category. Then turn on "Reference card sits next to the face" and they come back.
- Raise shine to 10% and put the person slider near the middle. Toggle "Shoot with cross-polarized filters" to compare.
- For the second tab, a photo with a sheet of white paper held next to the face works best. Press "Pick white paper" and tap the paper to white-balance and recompute. Measure the same cheek before and after white balance to see how far ITA° moves.
Where I got it wrong
- I expected the 24-patch correction to be perfect in daylight. Even under the very light used to fit the matrix, ITA° was off by 3.4°. At first I assumed a bug and spent a while hunting for it. It is the share that comes from camera sensitivities differing from the human eye, which a 3×3 matrix cannot cover.
- The rule for naming the melanin component was backwards in dark skin. ICA finds two components but does not say which one is melanin. My first rule was "the one that absorbs more blue is melanin". It held for light and medium skin, and in dark skin it was backwards on all six patches. In dark skin, blue is already almost fully absorbed, so adding melanin changes red more. Switching to "the one with almost no green component is melanin" made it right in every condition. This uses the fact that hemoglobin absorbs a lot of green, while melanin absorption falls off evenly from blue to red.
- In the web page, the two maps came out swapped. When porting to the browser I left out the transpose of a rotation matrix. I only caught it by feeding in a synthetic skin photo with known truth. After the fix, one map still came out inverted like a negative: once the shading direction is removed, the direction alone cannot fix the sign of a component. I set the sign of melanin by "the side where total optical density increases" and of blood by "the side where green absorption exceeds red".
- Shine removal erased redness. At first I only looked at ITA° error and missed it. Only when I put the result next to the truth did I see the red blotch gone.
- I was suspicious that the skin card fit so well. I made the card with my own optical model, so it might have had an unfair advantage by resembling the test skin. That is why the test skin was only NIST measurements, never the model. The two come from different sources, and they still agreed within about 1°. Real cards, though, are printed with ink, whose reflectance spectra have a different shape from skin. I could not measure that effect.
Why it is a click
The calculation itself is a click. ITA° is one line, color correction is one least-squares fit, and Tsumura separation is a few dozen lines. Even the web page took less than a day on a laptop, because the formulas this field built over 30 years are laid out like a textbook.
The parts that are not a click sit outside the calculation. Change the light and it moves 26°; change the camera, 10°; lean in 5 cm, 6°; get shiny, 17°. Block any one and the rest remain. So the job description's line that "measuring the same person the same way" matters more than "improving model performance by 0.5%" is no exaggeration. A plausible result on screen comes easily. Getting the same number from a hundred stores is the hard part.
What helped most in these experiments was not a new algorithm. It was six skin-color swatches, a reference card next to the face, and two polarizers, all fixes on the hardware and measurement-procedure side. Get those in place first, and the AI on top can trust the numbers from a single photo.
If you want to try this
- If you measure skin tone, put skin-color swatches in the frame. The 24-patch chart alone left 8–9° under halogen and 2700K. Adding six skin-color swatches kept every light within 1.6°.
- Lock exposure and keep the reference card at the same distance as the face. Auto exposure erases skin-tone differences. If the card is far away, only the face brightens with distance.
- Don't trust ITA° alone. It is too sensitive to lightness L\*. Research has found the melanin index more reproducible across devices. If you assign categories, it is more honest to tell people near a boundary "somewhere between these".
- Block shine with polarization. Software removal works well in dark skin but shaves off real color in light skin and red areas.
- Don't measure redness in dark skin from one RGB image. It correlated at 0.24 here. Other wavelengths (polarized images, near-infrared) or other measurements are needed.
- You can start with public data. NIST skin reflectance of 100 people (public), sensitivities of 28 cameras (CC BY-NC-SA), CIE standard illuminants, and Python's colour-science. Because the simulated capture has ground truth, you can compare correction methods in numbers.
What this cannot do
- Nothing was shot in a real store. Every number comes from computing captures of measured reflectance. Real camera noise, lens shading, compression and phones' automatic processing were left out. Real numbers will be worse.
- The NIST 100 lean toward light skin. The median ITA° is 49.6°, and the darkest person is −21.6°. Results for dark skin relied on the optical model.
- NIST measured one site with a contact spectrophotometer. There are no differences between facial regions, no texture, no pores.
- The shine, UV and pigment experiments used only model skin. The two-layer Kubelka-Munk model is an approximation, and its coefficients are less certain in the UV than in visible light. UV fluorescence was not modeled at all.
- Hydration is not covered. Research finds visible-light photos insufficient for measuring hydration, and store devices use separate sensors.
- No multimodal learning was done. I could not find a public face dataset captured in RGB, polarized and UV together. The "model that infers from several kinds of images" the job description mentions can only be built inside a company that has such data.
Still, the question got its answer. Code that measures skin tone takes a day. Measuring the same person the same way across a hundred stores means blocking light, distance, shine and camera-to-camera variation one by one. Most of that is solved with a few cards, two polarizers and a measurement procedure. The AI's work starts after that.
If you enjoyed this, please leave a comment.
Sources
- Samsung AI Beauty Mirror: Amorepacific press release (2026-01-05); camera configuration from MicroLED-Info (not confirmed in Samsung's own materials). First shown at CES 2025: Samsung Newsroom
- Olive Young Skin Scan: MTN (2026-09-15, Korean)
- NIST skin reflectance: Cooksey, Allen, Tsai, "Reference Data Set of Human Skin Reflectance", J Res NIST 122:26 (2017), data doi 10.18434/M38597
- Camera spectral sensitivities: Jiang, Liu, Gu, Süsstrunk, "What is the space of spectral sensitivity functions for digital color cameras?" WACV 2013, database (CC BY-NC-SA 4.0)
- ITA°: Chardon, Cretois, Hourseau 1991, Int J Cosmet Sci 13:191–208. Category boundaries are the common values following Del Bino et al. 2006. On inconsistent classification: Kalb et al. 2023, Groh et al. 2022
- Monk Skin Tone scale: Google (2022)
- Smartphone skin color correction and reproducibility: Kang, "The Color-Clinical Decoupling", arXiv 2512.21988 (the ICC value differs between versions, 0.40 and 0.46)
- Skin-colored patch correction: Choi, Choi, Suk, "Performance of the 14 skin-colored patches in accurately estimating human skin color", IS&T Electronic Imaging 2017
- Melanin/blood separation: Tsumura et al., "Image-based skin color and texture analysis/synthesis by extracting hemoglobin and melanin information in the skin", ACM TOG 22(3) (SIGGRAPH 2003), JOSA A 1999
- Skin optical coefficients: Jacques, "Optical properties of biological tissues: a review", Phys Med Biol 58 R37 (2013), Prahl hemoglobin molar extinction table
- Reflection component separation: Tan, Ikeuchi, IEEE TPAMI 27(2) (2005), Yang, Wang, Ahuja, ECCV 2010
- Polarized imaging: Anderson, "Polarized light examination and photography of the skin", Arch Dermatol 127(7) (1991), Jacques, Ramella-Roman, Lee, JBO 2002
- VISIA repeat measurements: Henseler 2022
- Limits of porphyrin fluorescence quantification: PMC review
- Limits of measuring hydration from photos: Shishido et al. 2023
- Computation: colour-science (CIE illuminants and observer, ColorChecker reflectances)
- All experiments, charts and the web page were made for this post