The Run Left in the Sole
The word in the notebook was just one: running. Starting from the Nagoya Asian Games marathon and Korea's running boom, this piece follows how training for a medal differs from running for health, and traces running dynamics — born when the cycling power meter crossed over into running — along with the machine learning used to read them. At the end is an analyzer that works backward from a worn running-shoe sole to read the habits behind it. The fourth installment of A Page for Today.
Today, when I opened my idea notebook, a single word was written there.
Running
No explanation, no arrow. I don't even remember when or why I wrote it. And yet there seems to be a reason this particular word surfaced now. The Asian Games are in full swing in Nagoya and Aichi, and every evening the banks of the Han River fill with a steady line of runners. Today I want to follow this one word wherever it leads — running for a medal and running to live longer, the machines that measure both, and the traces left behind on the soles of running shoes.
Eighth Place, Crossing the Line in Bloodied Shoes
Athletics at the Aichi-Nagoya Asian Games ran from September 23 to 29 at Nagoya's Mizuho Athletic Stadium. There are 50 individual events in athletics. Of these, 28 are decided purely by running. From the 100m to the marathon, there are 13 events each for men and women, plus two mixed relays. Add race walking and the count rises to 32; add the decathlon and heptathlon, which include running legs, and it reaches 34. Two-thirds of athletics ultimately comes down to who gets there faster.
South Korean athletics brought home three bronze medals this time. Woo Sang-hyeok cleared 2.22m in the rain to win a medal for the third consecutive Games, and the men's 4x100m relay team took bronze with a new national record of 38.43 seconds. Choi Byeong-gwang won bronze in the men's half-marathon race walk.
What stayed with me longest wasn't a medal but a single scene. In the men's marathon on September 26, Park Min-ho's shoe sole tore open on a downhill stretch around the 20km mark. He ran the rest of the race in blood-soaked shoes, finishing in 2:15:35, eighth out of 19 runners. He said that after dropping out of the World Championships, he was determined not to stop this time. For a marathoner, the sole of a shoe is the spot that strikes the ground roughly 25,000 times over the course of a race. That day, that spot gave way first. This piece eventually comes back to that sole.
Why the Crowds Came to the Han River
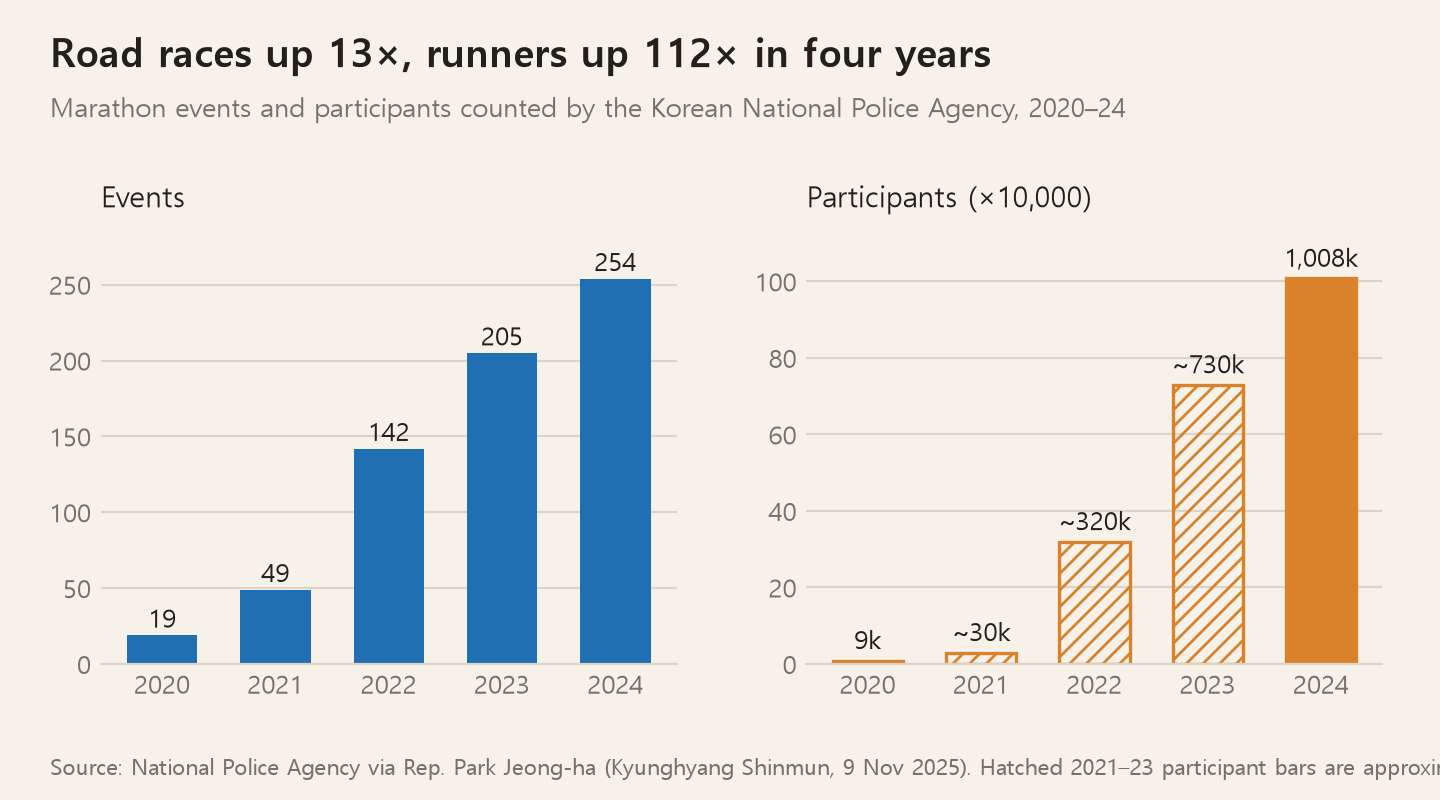
Running is the fastest-growing sport in Korea right now. According to figures compiled by the National Police Agency, the number of marathon events rose from 19 in 2020 to 254 in 2024. Participants grew from 9,030 to 1,008,122. The multiple looks inflated because it's measured against a year when the pandemic had shut nearly all events down, but even between 2023 and 2024 alone, the number of events grew by close to 50.
Government surveys point the same way. In the Ministry of Culture, Sports and Tourism's 2025 National Survey on Sports for All, the share of regular exercisers who run rose from 4.8% to 7.7%. That's still small next to walking (40.5%), but the climb is steep. Money has followed too. In 2024, Korea's running shoe market was worth roughly 1 trillion won, about a quarter the size of the overall athletic shoe market.
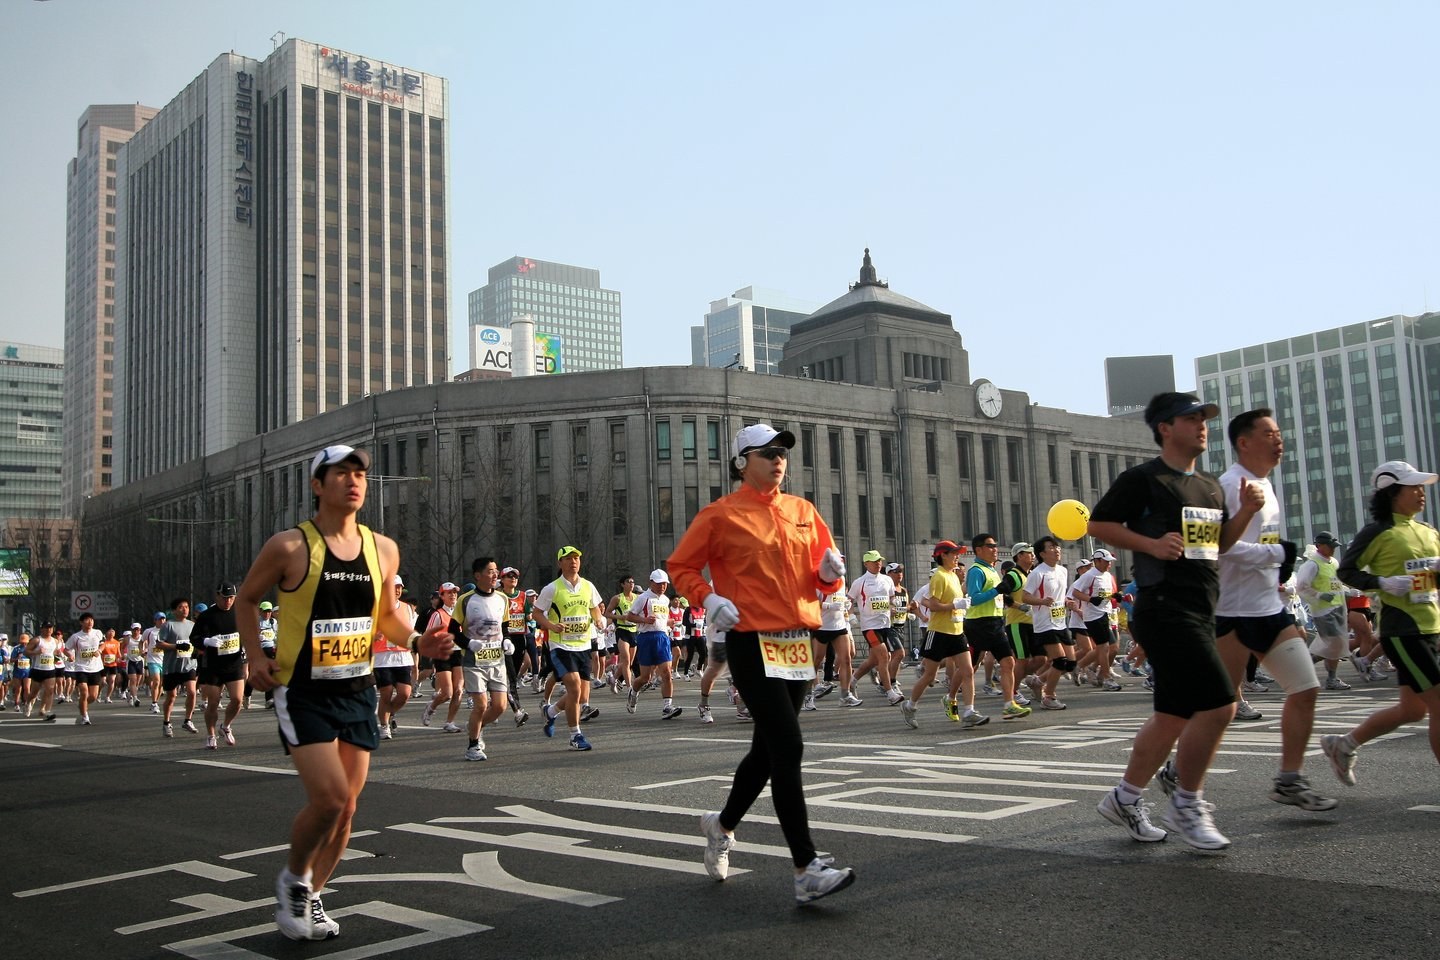
As the crowds grew, so did the friction. Competition for first-come, first-served registration at major races got so fierce that the JTBC Seoul Marathon switched to a lottery system starting in 2025, and complaints piled up over road closures on race days. In the fall of 2024, Seoul's Seocho District required groups of more than five runners at Banpo Sports Complex to keep a 2-meter gap between them, and Songpa District banned groups of more than three from running together around Seokchon Lake. The trigger was complaints that running crews were shouting "move aside" at people out for a walk. It's what happens when a solitary activity turns into a pack activity.
Same Run, Different Finish Line
As more people run, talk of training methods has grown too. Elite athletes' training schedules circulate on YouTube, and running clubs trade notes on intervals and threshold work. But training aimed at a medal and running for health start from different goals entirely. And because the goals differ, the required volume differs by an order of magnitude.
Start with health. In 2014, a research team led by Duck-chul Lee in the United States followed roughly 55,000 adults for an average of 15 years. Runners had a 30% lower risk of death from any cause and a 45% lower risk of death from cardiovascular disease than non-runners, and lived three years longer on average. What's striking is how little running it took. Running less than 51 minutes a week — just 5 to 10 minutes a day — produced nearly the same effect. A 2020 meta-analysis pooling six cohorts and more than 230,000 people found something similar. Doing any running at all lowered mortality risk by 27%, but running more often, longer, or faster didn't make the effect bigger. Both studies are observational, so they can't pin the effect squarely on running itself. Even so, the threshold is lower than it looks. The World Health Organization recommends 75 to 150 minutes of vigorous activity a week, which at a 6-minute pace works out to roughly 12 to 25km.
The numbers look different on the medal side. A 2022 Norwegian research team's survey of world-class distance runners' training found that marathoners run 160 to 220km a week at the peak of their preparation period. They train 11 to 14 times a week, with more than 80% of that at a low intensity that doesn't leave them out of breath. The "double threshold" method popularized by Norwegian middle- and long-distance runners packs two threshold sessions into a single day, drawing blood after each repetition to measure lactate and keep the intensity locked in place. That adds up to 150 to 180km a week.
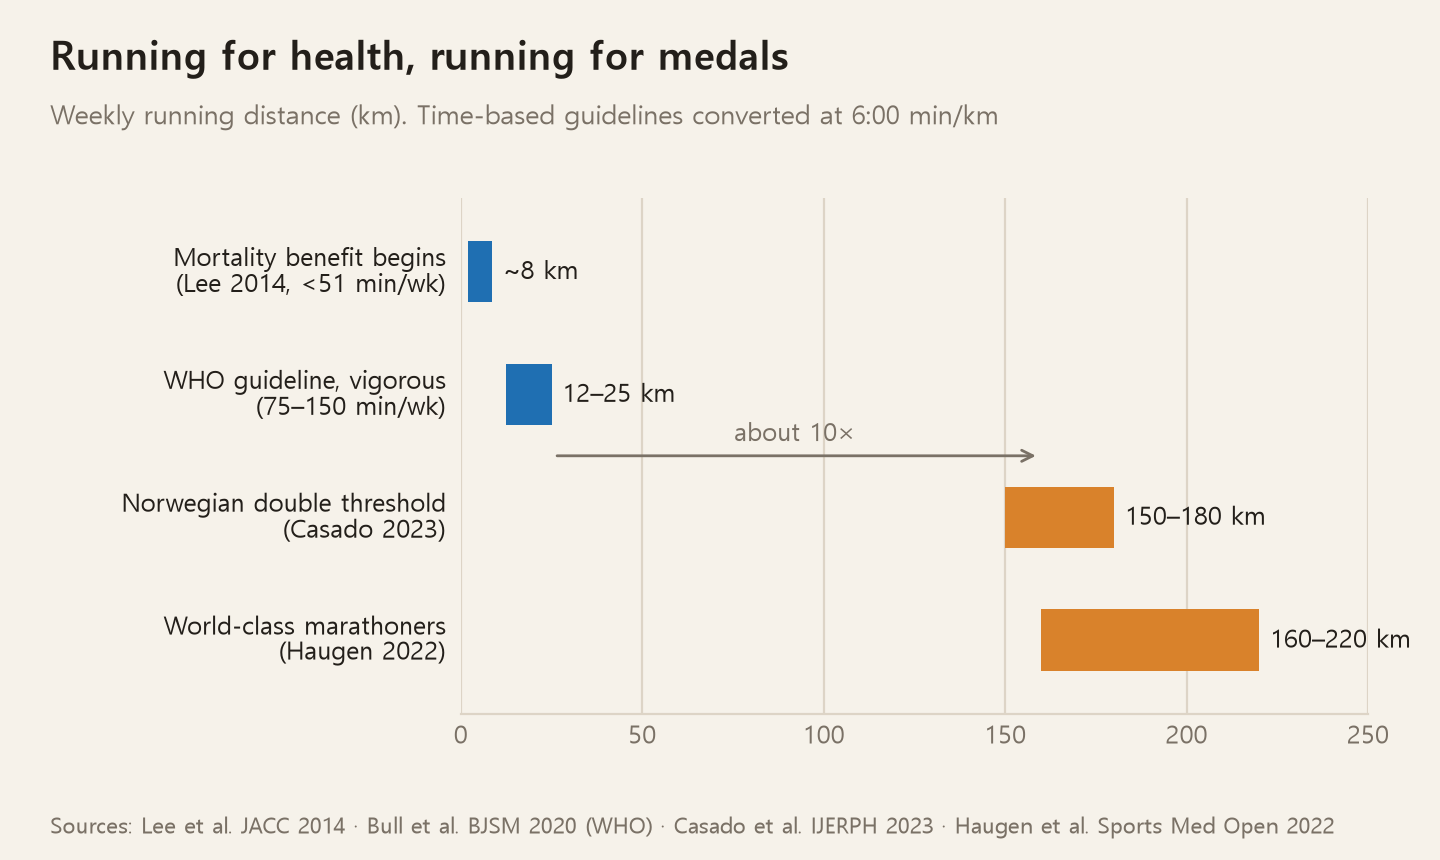
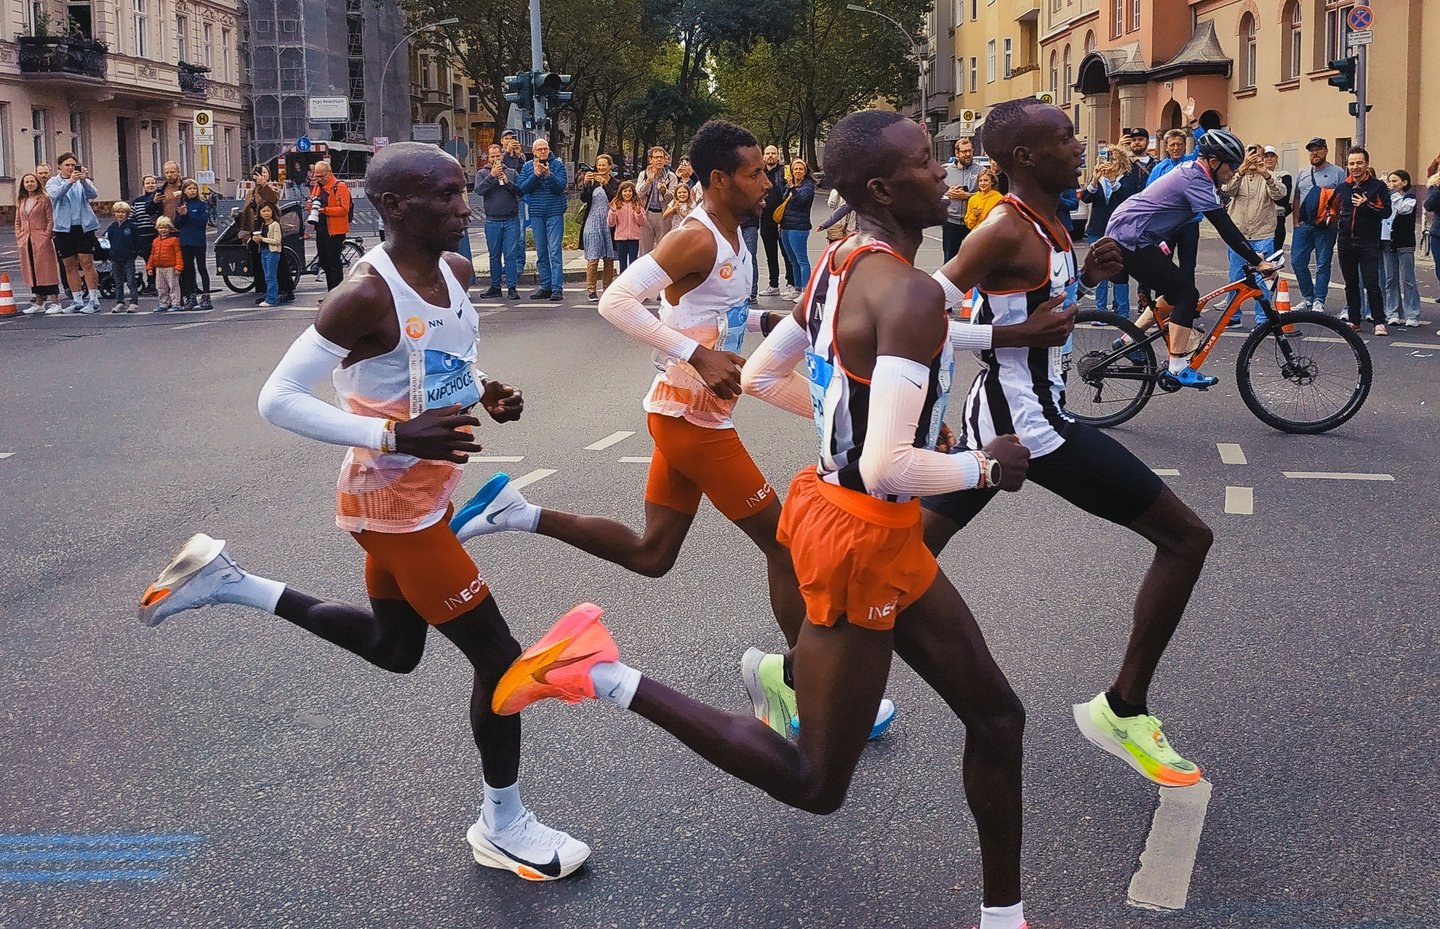
The gap between the two bars is tenfold. But the bigger difference isn't in the quantity — it's in the shape of the curve. Most of the health benefit comes in the first few kilometers; past that, the curve flattens out. Performance works the other way. The closer you get to the top, the more distance it takes to shave off a single second. In April 2026, Sabastian Sawe broke the two-hour barrier for the first time in a record-eligible race, running 1:59:30 in London. When Eliud Kipchoge clocked 1:59:40 in Vienna in 2019, the run used rotating pacemakers and a laser-guided pace car, so it wasn't recognized as an official record. It took humanity seven more years to earn those last few dozen seconds.
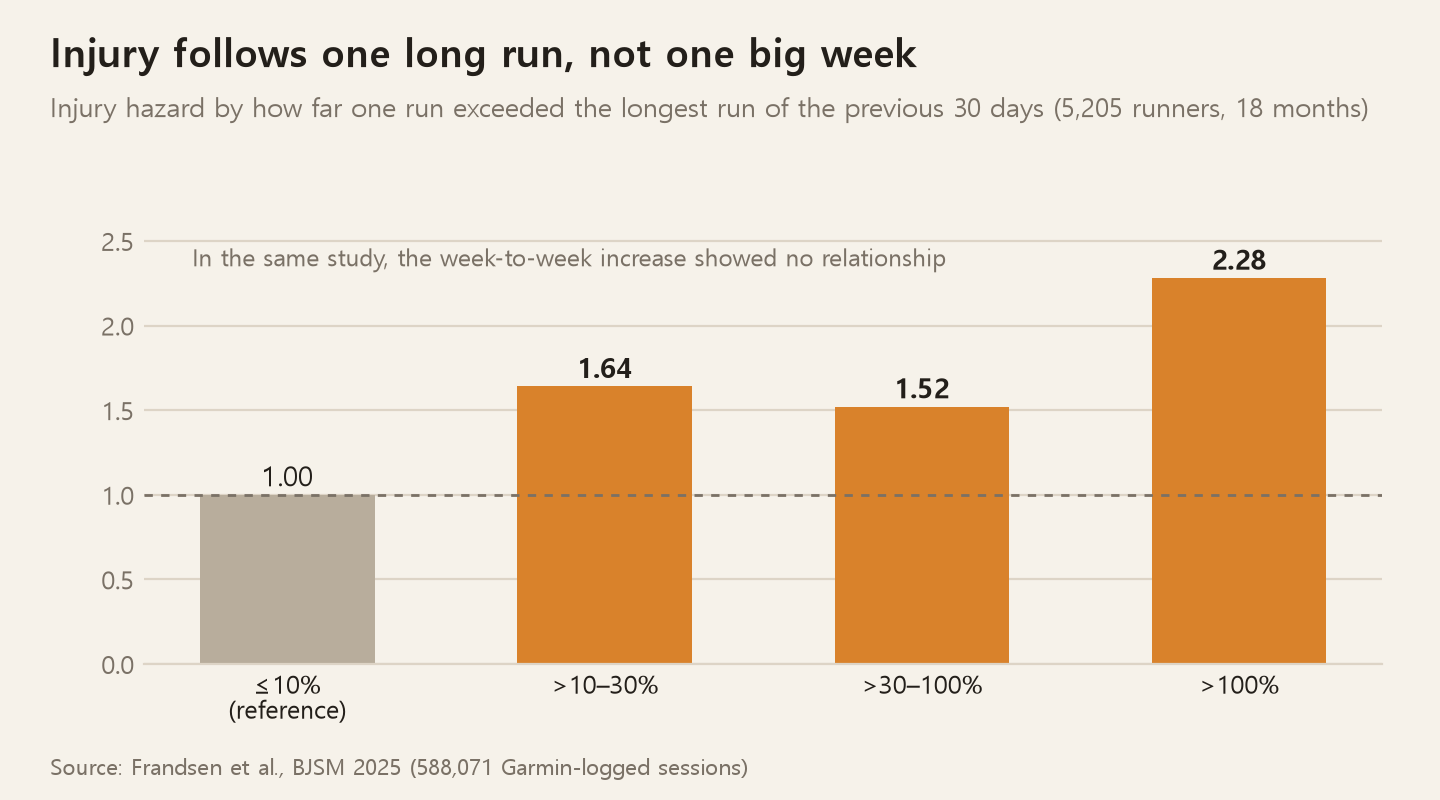
This is why the two groups treat risk differently. Elites accept the risk of injury and push the volume, and a body that can withstand that is itself the talent. For someone running for health, an injury defeats the entire purpose. Injury rates among runners range, depending on the study, from 19.4% to 79.3% a year. The commonly cited "don't increase weekly distance by more than 10%" rule failed to reduce injuries in a 2008 randomized trial of 532 novice runners in the Netherlands (20.8% versus 20.3%). A 2025 Danish research team, analyzing roughly 588,000 Garmin watch records, came up with a different answer. The problem wasn't the week as a whole — it was any single day. Once a single run exceeded the longest run of the past 30 days by just 10%, injury risk rose to 1.64 times; past double that distance, it rose to 2.28 times.
This probably isn't unique to running. Swimming, cycling, strength training — each has its own separate curve for competition and for health. Competition fights over the last 1% at the end of the curve; health is about clearing the first threshold at its head. This is also where the trouble starts when amateur runners copy an elite training schedule wholesale. Push a prescription meant for the end of the curve onto its beginning, and all you import is the risk.
Power That Crossed from the Pedal to the Foot
Cyclists have long trained with power meters. Multiply the force on the pedals by how fast they turn and you get watts. The maximum power a rider can sustain for an hour is called FTP, and training intensity is set as a percentage of that value. Unlike heart rate, it isn't thrown off by weather or condition; unlike speed, it isn't fooled by hills or wind.
This approach has crossed over into running. A foot pod clipped to the laces, a chest sensor, or a wristwatch now estimates running power and measures what's called running dynamics. There are five main metrics: cadence, the number of steps per minute; stride length, the length of a single step; ground contact time, how long the foot stays on the ground; vertical oscillation, how much the torso bounces up and down; and vertical ratio, vertical oscillation divided by stride length. The left-right balance of ground contact time is tracked separately as well. Stryd, like a cycling FTP, calls the maximum power a runner can sustain for about 40 minutes "critical power" (CP) and uses it as the basis for training.
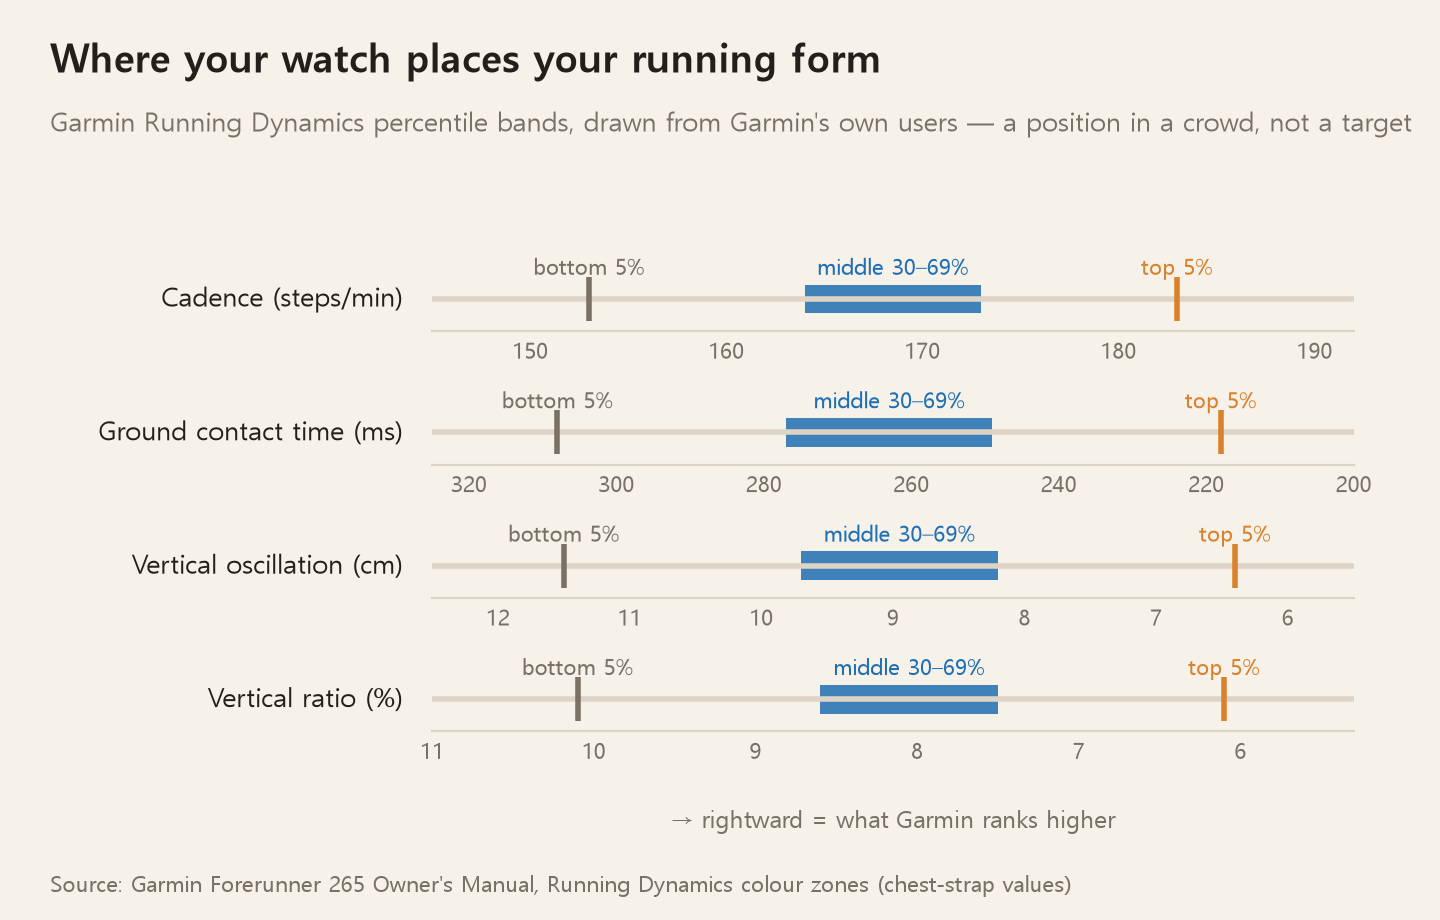
But a cycling watt and a running watt aren't the same thing. A bicycle measures the exact spot where force actually transfers from pedal to crank. Running has no such spot. Running on flat ground at a constant speed, the work the body does on the outside world is close to zero, and most of the energy the muscles use goes into absorbing the impact on landing and giving it back on takeoff. So running power is an estimate — a calculation of "roughly how much must have been used," derived from acceleration and speed. A 2021 Spanish research team compared five devices and found Stryd the most consistent and best matched to oxygen uptake. Other research, however, found that Stryd tends to underestimate the absolute values. So it's fine to use for comparing yourself to yesterday's version of you, but comparing your numbers to someone else's calls for caution. The same goes for Garmin's percentile bands — they only show where you stand among other Garmin users, not some answer you should be matching.
How Machines Read a Run
The dynamics numbers aren't measured directly by the sensor — they're usually calculated by a model. All the sensor produces is acceleration and angular velocity, sampled hundreds of times a second. Finding the moments when "the foot touched down" and "the foot lifted off" in that stream, and extracting torso height and ground contact time from it, has long been the job of signal processing. Lately, machine learning has been taking over that role fast.
A 2022 systematic review surveyed 24 machine-learning studies on running biomechanics using wearable sensors. They used anywhere from one to five sensors, mostly attached to the pelvis, thigh, shin, and foot, and 57% of the methods were deep learning. A few examples stand out.
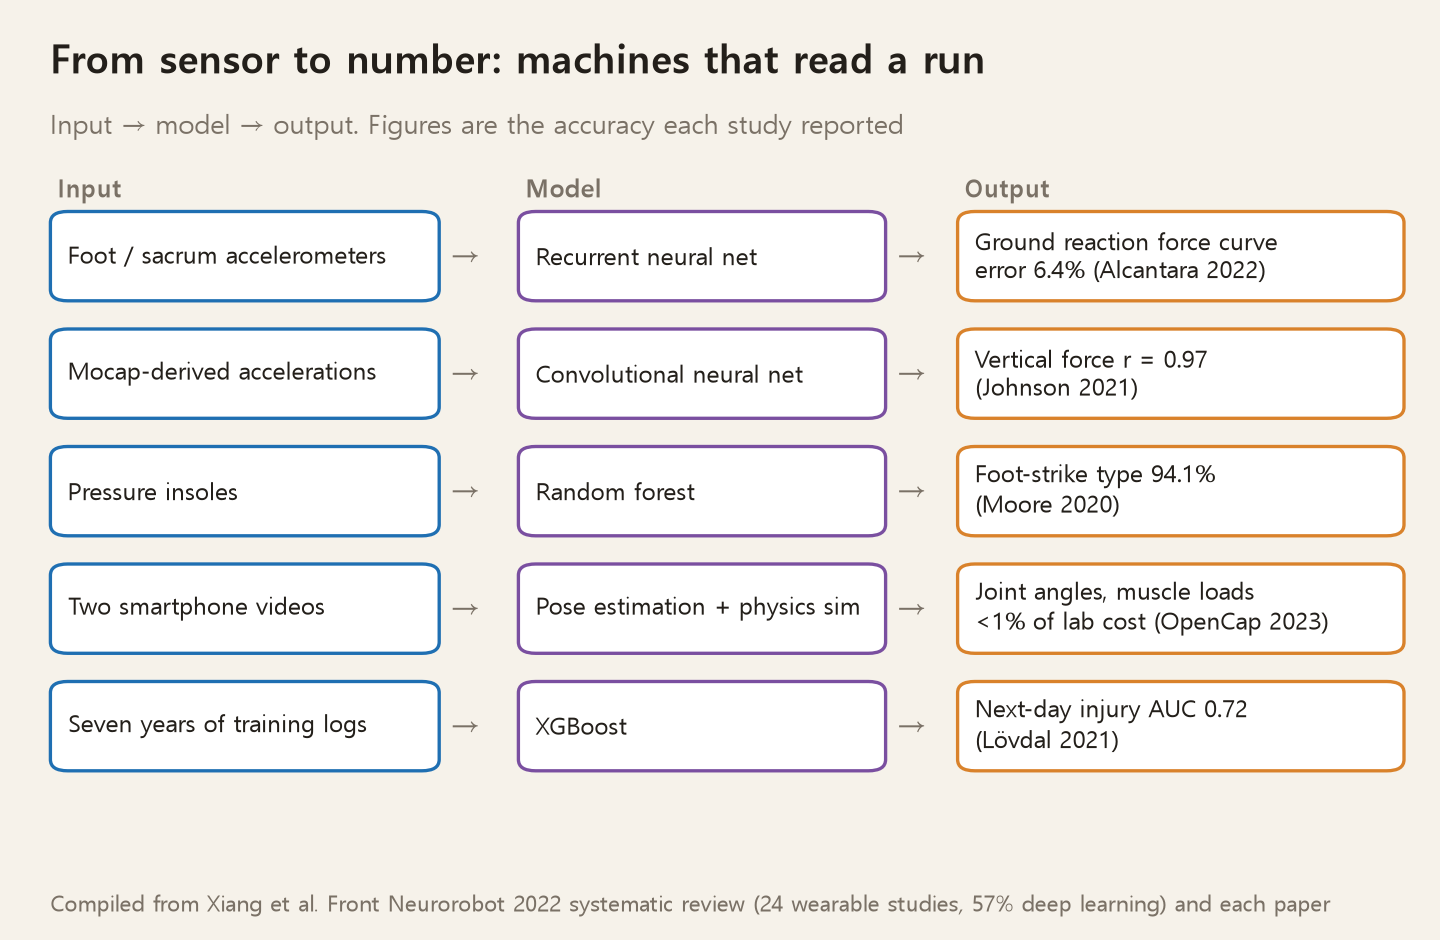
The force on the foot. A lab's force plate measures the force the foot exerts on the ground with precision, but it can't leave the lab. A 2022 study fed accelerometer signals from the sacrum and shoe into a recurrent neural network and reconstructed that force curve with 6.4% error relative to body weight. A 2021 study trained a convolutional neural network on nearly 500,000 pieces of archival motion-analysis data and matched vertical force with a 0.97 correlation. The authors themselves, though, described the inconsistency in the results as "disappointing."
Motion analysis with two phones. OpenCap, built by a Stanford research team in 2023, estimates a person's posture from video shot on two smartphones, then layers a physics simulation on top to calculate joint angles and even the load placed on muscles. It's 25 times faster than lab analysis and costs less than 1% as much.
Catching injury before it happens. A 2021 Dutch research team built an XGBoost model from seven years of training logs for 74 top-tier runners to predict next-day injury. It scored an AUC of 0.72 — clearly better than a coin flip (0.5), but not accurate enough to trust skipping a workout over. Injury remains hard even for machines.
Reading foot strike is easier. A 2020 study used a pressure insole and a random forest to identify heel, midfoot, and forefoot strikes with 94.1% accuracy. People themselves aren't very good at this. When 710 runners were asked about their own strike pattern in 2024, only 42.7% guessed correctly, and among those who actually strike with their heel, only 34% knew it.
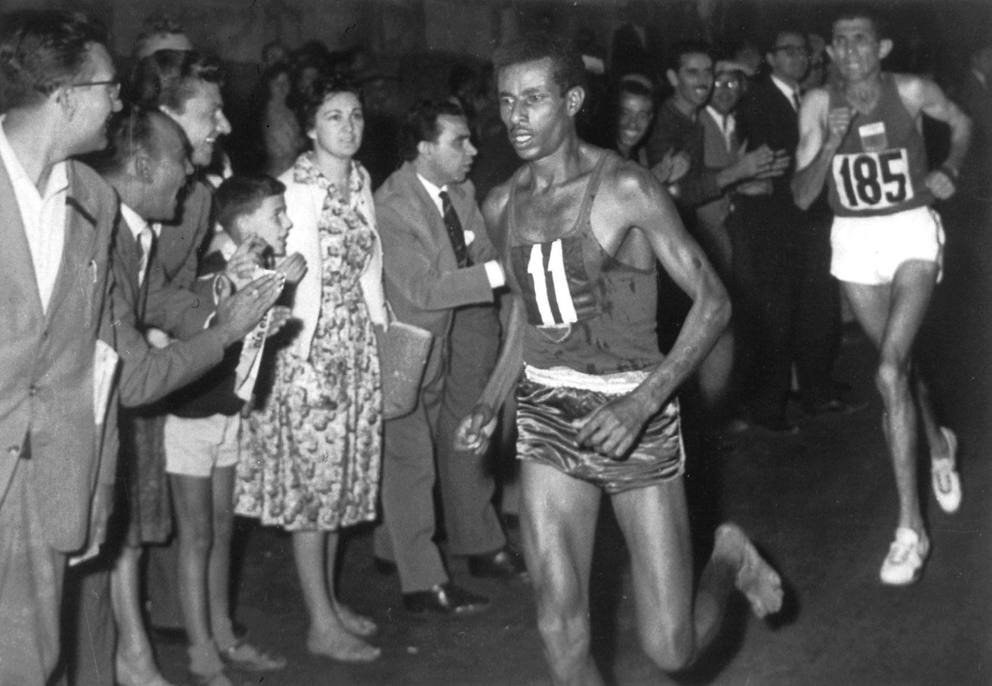
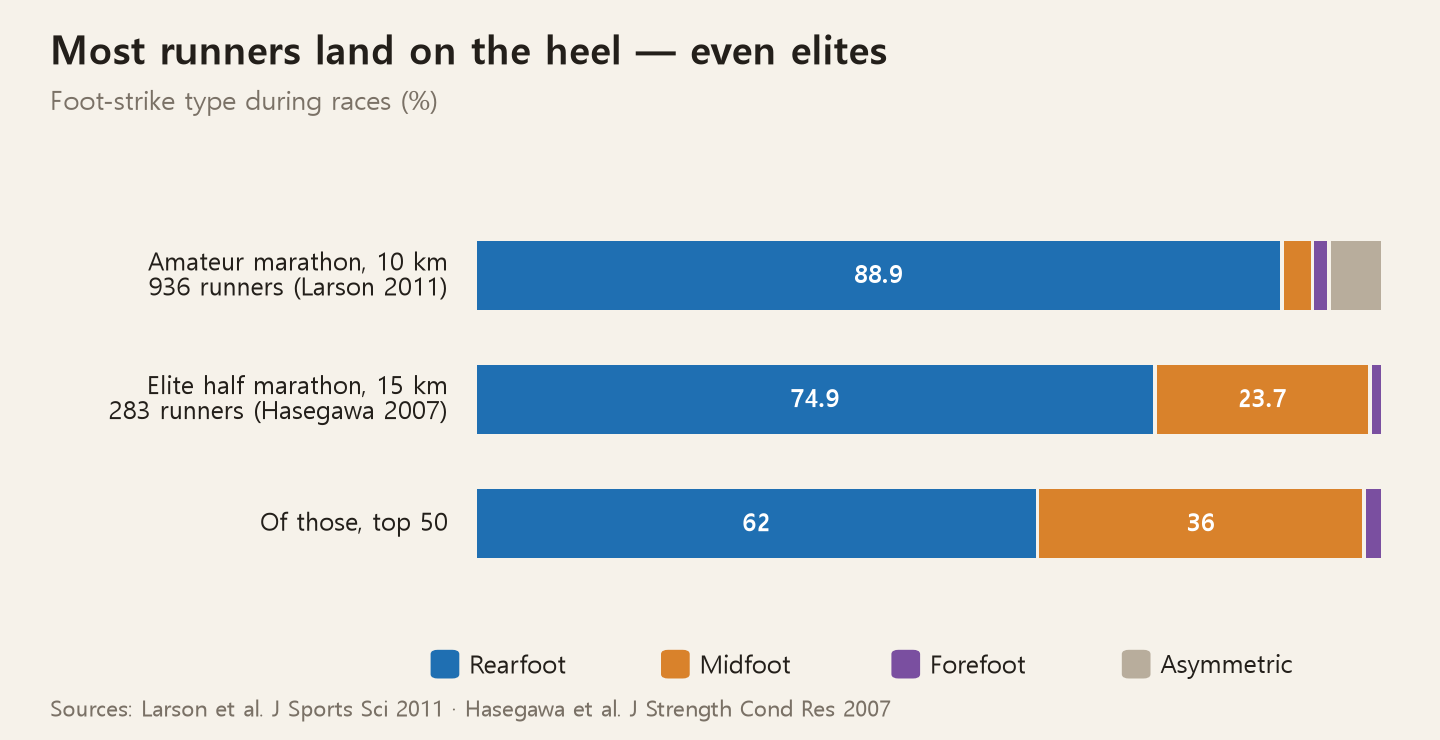
Any discussion of foot strike eventually brings up barefoot running. In 2010, Harvard's Daniel Lieberman published a paper in Nature showing that Kenyan runners who had run barefoot their whole lives mostly landed on their forefoot, and that this kind of landing produced far less impact. For a few years afterward, "barefoot running" and "forefoot striking" became a trend. But feet on an actual racecourse land differently. Filming 936 amateur marathoners at the 10km mark found that 88.9% struck with their heel, and even among elite half-marathoners, 74.9% were heel strikers.
It's still too early to call forefoot striking good or bad. A 2013 Finnish study found that forefoot strikers placed less load on the knee (the patellofemoral joint) than heel strikers, but more force on the Achilles tendon. The load doesn't disappear — it just relocates. That idea of load relocating is exactly what the analyzer at the end of this piece uses as well.
What a Worn Sole Tells You
This raises one remaining question: how can someone with no sensor and no insole get a read on their own running? The oldest recording device is already underfoot — the sole of the shoe. A shoe that has run hundreds of kilometers has etched hundreds of thousands of landings into a single sheet of rubber. Running shoe stores have long flipped soles over and pronounced things like "the outer heel is worn — that's normal" or "the inner forefoot is worn, so that looks like overpronation."
I looked into how accurate this is, and the result was a bit thin. I couldn't find a study that directly compared sole wear to foot strike type or pronation in runners. The closest thing to a quantitative study is a 2012 paper that tracked the combat boots of 76 infantry trainees over 14 weeks. The heel wore toward the outer rear (roughly a 12-degree angle), and that direction turned out to correlate with how far the toes pointed outward, not with how much the foot rolled inward or outward. The sole does say something — just not as clearly as what you hear in the store.
The view of pronation itself has also shifted. In a 2014 Danish study, 927 novice runners were all put in the same neutral shoe and logged more than 320,000km of running between them, and runners whose feet rolled inward were no more prone to injury. If anything, they had slightly fewer injuries per 1,000km. The following year, Canada's Benno Nigg reviewed 30 years of explaining injury through impact and pronation, concluded the evidence was weak, and proposed two new criteria instead: every body has its own "preferred movement path," and a shoe should avoid twisting that path too far. And the best filter for choosing such a shoe is simply how comfortable it feels when worn.
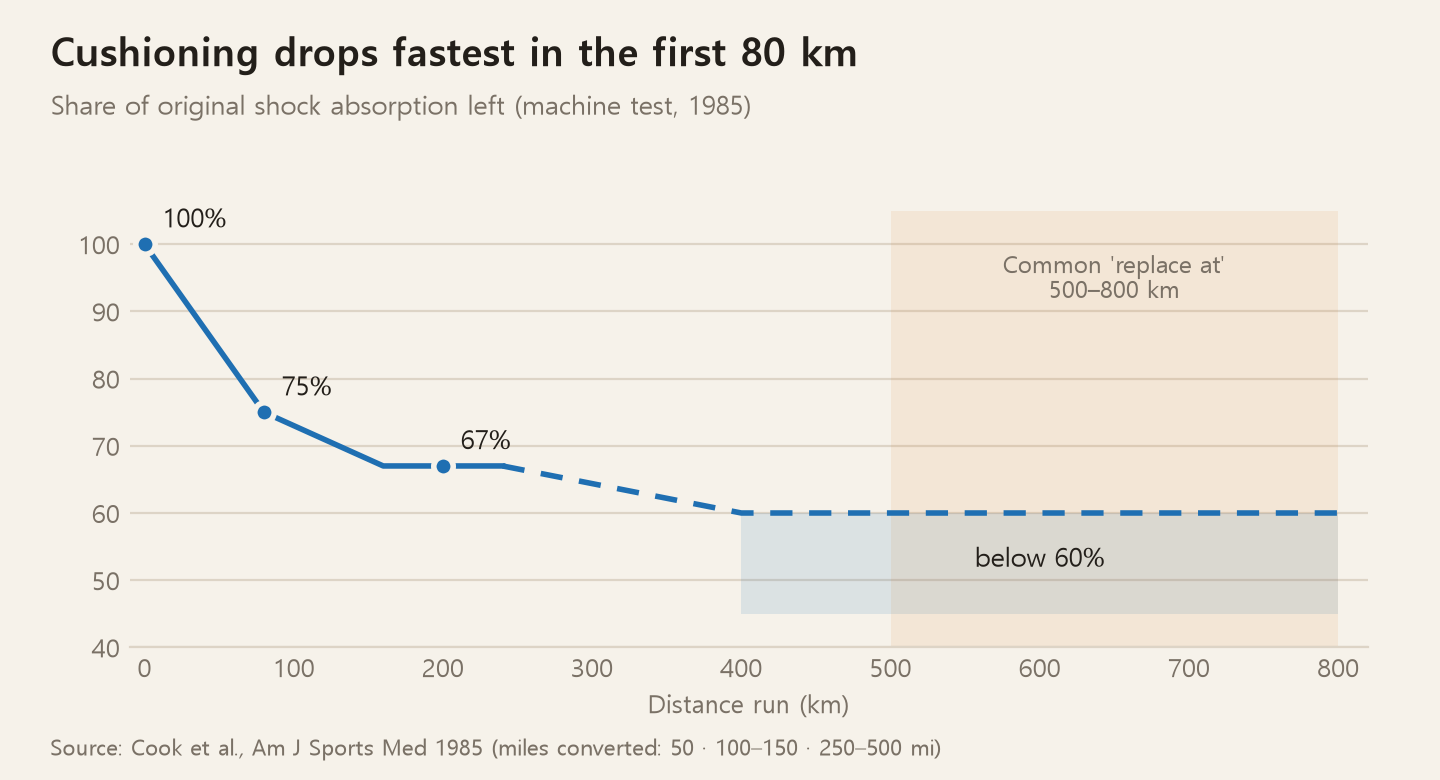
Even when a shoe dies is less certain than it sounds. Replacement is commonly recommended at 500–800km, but I couldn't find a study linking that figure to injury. In a 1985 mechanical test, running shoes lost a quarter of their shock absorption within the first 80km, then declined more slowly, dropping below 60% somewhere between 400 and 800km. A 2020 study reported that over 700km of running by 33 people, plantar pressure rose only at the midfoot.
Still, the sole is too good a source to throw away. So instead of a definitive answer, I built a "model." The forward direction works like this: while the foot is on the ground, the center of pressure — where body weight is loaded — starts at the point of impact and travels out toward the big toe. The rubber wears along this path, and it wears most at the two moments when load and slip are both high: the instant of braking on landing, and the instant of twisting push-off from the big toe. With a heel strike, that first moment falls on the outer heel, and the lower the cadence and the longer the stride, the harder that scraping gets. Roll inward, and the path curves inward; roll outward, and it follows the outer edge.
The reverse direction is more interesting. Guessing a habit from a worn sole is an inverse problem — working backward from effect to cause. The analyzer pre-renders about 1,800 soles for running habits generated by varying strike pattern, foot roll, cadence, and foot drag, then finds whichever one most resembles the sole pattern I mark. This nearest-neighbor approach is the simplest version of what the machine-learning methods discussed earlier are doing. And it also reveals what can't be known. Changing cadence from 155 to 195 barely shifts where the sole wears — only how much it wears. So cadence can't be guessed from the sole alone. The analyzer notes this separately, under what it "can't tell you."
A few things are worth trying. First, in "Habit → Wear," hit play and drag cadence down toward 150. The outer heel turns white much faster, and the knee-front bar climbs. A 2011 University of Wisconsin study found that raising step rate by 5–10% at the same speed reduced the energy absorbed by the knee, because the foot doesn't reach as far out in front of the body. Next, push the strike toward the forefoot. The wear spot shifts forward, the knee bar drops, and the Achilles/calf bar rises — the same load-relocation scene described earlier. Push left-right balance past 52% and one shoe wears through before the other.
Then switch to "Wear → Habit" and flip over your own shoe. Mark the worn spots, and the closest matching habit is drawn alongside. But the "similarity" number shown on screen is only a similarity between models. The analyzer also notes, plainly, that actual research doesn't support going further than that. In the end, the final criterion for choosing a shoe is, as Nigg said, comfort.
Back to the Sole
Back to the word in the notebook: running. The marathoners in Nagoya and the amateurs along the Han River are performing the same motion, but they stand on different curves. One fights over seconds at the end of the curve; the other is clearing the first threshold at its head. For those fighting over the end, a power meter, a lactate monitor, and machine learning are tools for shaving off a second. For those clearing the threshold, the same tools only need to serve as a warning light that keeps them running long without getting hurt.
And for both groups, the most honest record is underfoot. Park Min-ho's torn sole and the glossy worn patch on the outer heel of my own shoe are both records left by hundreds of thousands of landings. But how to read that record is less understood than it seems. Not much of what you hear in the store turns out to be backed by research, and even when a machine reads it, there's a line between what it can know and what it can't. Once you know where that line is, a worn sole feels a little less unsettling.
This is how A Page for Today carries on: open the notebook to any page, and lay that day's thinking on top of whatever line is written there. Today it wasn't a line but a single word. I hope you'll flip over the running shoes in your own shoe rack sometime.
References
- 2026 Asian Games athletics results: "Woo Sang-hyeok, bronze with 2.22m," Seoul Shinmun · "Men's 4x100m relay sets national record, wins bronze," Hankook Ilbo · "Park Min-ho finishes marathon with a torn sole," Seoul Shinmun
- National Police Agency marathon event tally (Office of Rep. Park Jeong-ha), "Marathon events up 13-fold in four years," Kyunghyang Shinmun (2025-11-09)
- Ministry of Culture, Sports and Tourism, 2025 National Survey on Sports for All (released 2026-01-19)
- D. C. Lee et al., "Leisure-time running reduces all-cause and cardiovascular mortality risk," JACC (2014) doi:10.1016/j.jacc.2014.04.058
- Z. Pedisic et al., "Is running associated with a lower risk of all-cause, cardiovascular and cancer mortality…?," BJSM (2020) doi:10.1136/bjsports-2018-100493
- F. C. Bull et al., "WHO 2020 guidelines on physical activity and sedentary behaviour," BJSM (2020)
- T. Haugen et al., "The Training Characteristics of World-Class Distance Runners," Sports Medicine – Open (2022) doi:10.1186/s40798-022-00438-7
- A. Casado et al., "The Norwegian Double-Threshold Method in Distance Running," IJERPH (2023) doi:10.3390/ijerph20053782
- R. N. van Gent et al., "Incidence and determinants of lower extremity running injuries," BJSM (2007)
- I. Buist et al., "No effect of a graded training program on the number of running-related injuries," AJSM (2008)
- J. S. B. Frandsen et al., "How much running is too much?," BJSM (2025) doi:10.1136/bjsports-2024-109380
- World Athletics, "Sawe breaks two-hour barrier with 1:59:30 world record at London Marathon" (2026)
- A. M. Jones · A. Vanhatalo, "The 'Critical Power' Concept," Sports Medicine (2017)
- V. Cerezuela-Espejo et al., "Are we ready to measure running power?," Eur J Sport Sci (2021) · F. Imbach et al., "Validity of the Stryd Power Meter…," Sports (2020)
- Garmin, Forerunner 265 Owner's Manual, "Running Dynamics"
- L. Xiang et al., "Recent Machine Learning Progress in Lower Limb Running Biomechanics With Wearable Technology," Frontiers in Neurorobotics (2022) doi:10.3389/fnbot.2022.913052
- R. S. Alcantara et al., PeerJ (2022) · W. R. Johnson et al., IEEE TBME (2021) · S. R. Moore et al., Sensors (2020)
- S. D. Uhlrich et al., "OpenCap," PLOS Computational Biology (2023)
- S. S. Lövdal et al., "Injury Prediction in Competitive Runners With Machine Learning," IJSPP (2021)
- D. E. Lieberman et al., "Foot strike patterns and collision forces in habitually barefoot versus shod runners," Nature (2010)
- P. Larson et al., J Sports Sci (2011) · H. Hasegawa et al., J Strength Cond Res (2007) · H. K. Vincent et al., Front Sports Act Living (2024)
- M. Kulmala et al., "Forefoot Strikers Exhibit Lower Running-Induced Knee Loading than Rearfoot Strikers," MSSE (2013)
- B. C. Heiderscheit et al., "Effects of step rate manipulation on joint mechanics during running," MSSE (2011)
- R. O. Nielsen et al., "Foot pronation is not associated with increased injury risk in novice runners wearing a neutral shoe," BJSM (2014)
- B. M. Nigg et al., "Running shoes and running injuries: mythbusting and a proposal for two new paradigms," BJSM (2015)
- A. S. Finestone et al., "Patterns of outsole wear in infantry recruits," J Foot Ankle Res (2012) doi:10.1186/1757-1146-5-27
- S. D. Cook et al., "Shock absorption characteristics of running shoes," AJSM (1985) · E. Escamilla-Martínez et al., IJERPH (2020)
- Photos: Eadweard Muybridge, Animal Locomotion (1887), public domain · Kipchoge, IgorCalzone1, CC BY-SA 4.0 · Seoul International Marathon, hojusaram, CC BY-SA 2.0 · Abebe Bikila, public domain. All via Wikimedia Commons
- The sole model in the analyzer and the per-area load bars are my own simplification of trends from the studies above. They are not measured values