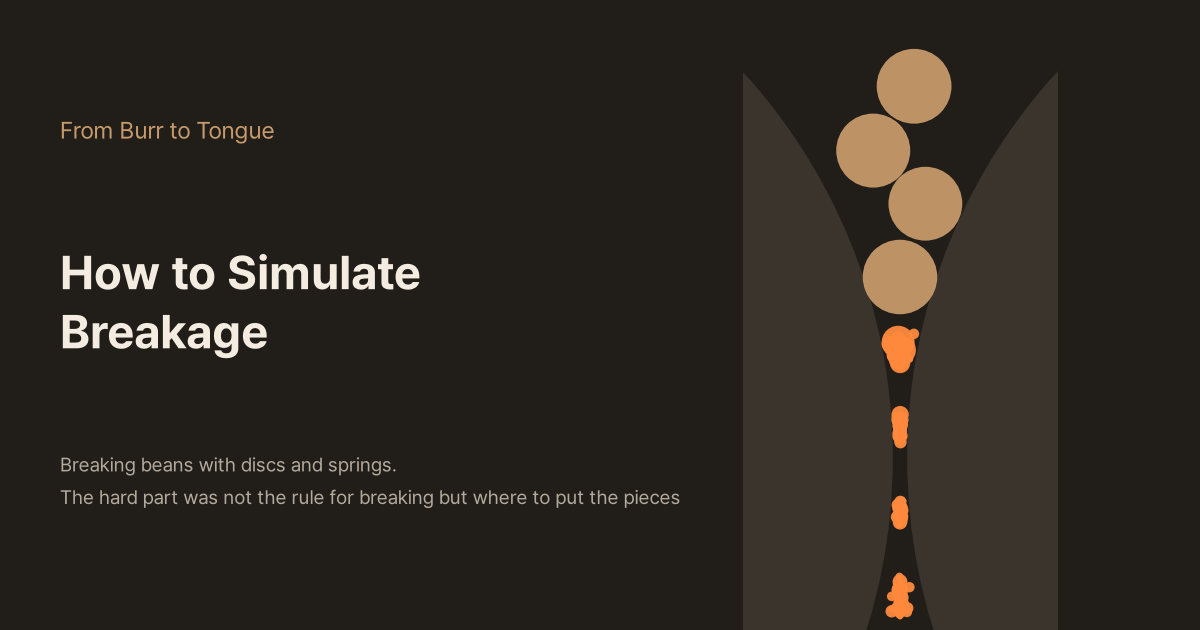
How to Simulate Breakage
The standard way to compute how beans break inside a grinder is the discrete element method (DEM). I built a 2D DEM from discs and springs and broke beans between two rolls. A bonded model shows the shape of the crack but did 4,000 times more work than particle replacement, and with particle replacement, where the fragments are placed changed the share going below 0.4 mm from 33% to 100%. Resolving down to the fines would turn one bean into ten million particles. With a simulation you can run yourself.
So far in Part 2 we have looked at the force it takes to break a single bean (30–60 N), why fines are the size of a cell, and the two-peaked distribution. To get inside a grinder we now need a moving picture that ties these together: dozens of beans falling between burrs, colliding, breaking, and the pieces breaking again.
The standard way to compute a process like this is the discrete element method (DEM). In this piece I build one to see what DEM is and how it handles breakage. The short version: the hardest part was not the rule for when something breaks. It was where to put the pieces.
Newton's equations for every grain
DEM is the method Cundall and Strack published in a geotechnical journal in 1979. Instead of treating a heap of sand or gravel as a continuum, it solves the motion of each grain separately. The recipe is simple.
- Treat every grain as a disc (2D) or a sphere (3D)
- When two grains overlap, push them apart with a force proportional to the overlap (a normal spring). Add a damper so a little energy is lost in each collision
- When the touching surfaces try to slide, apply friction, which can never exceed 'normal force × friction coefficient'
- Add up all the forces on each grain and move it for a very short time Δt. Repeat hundreds of thousands of times
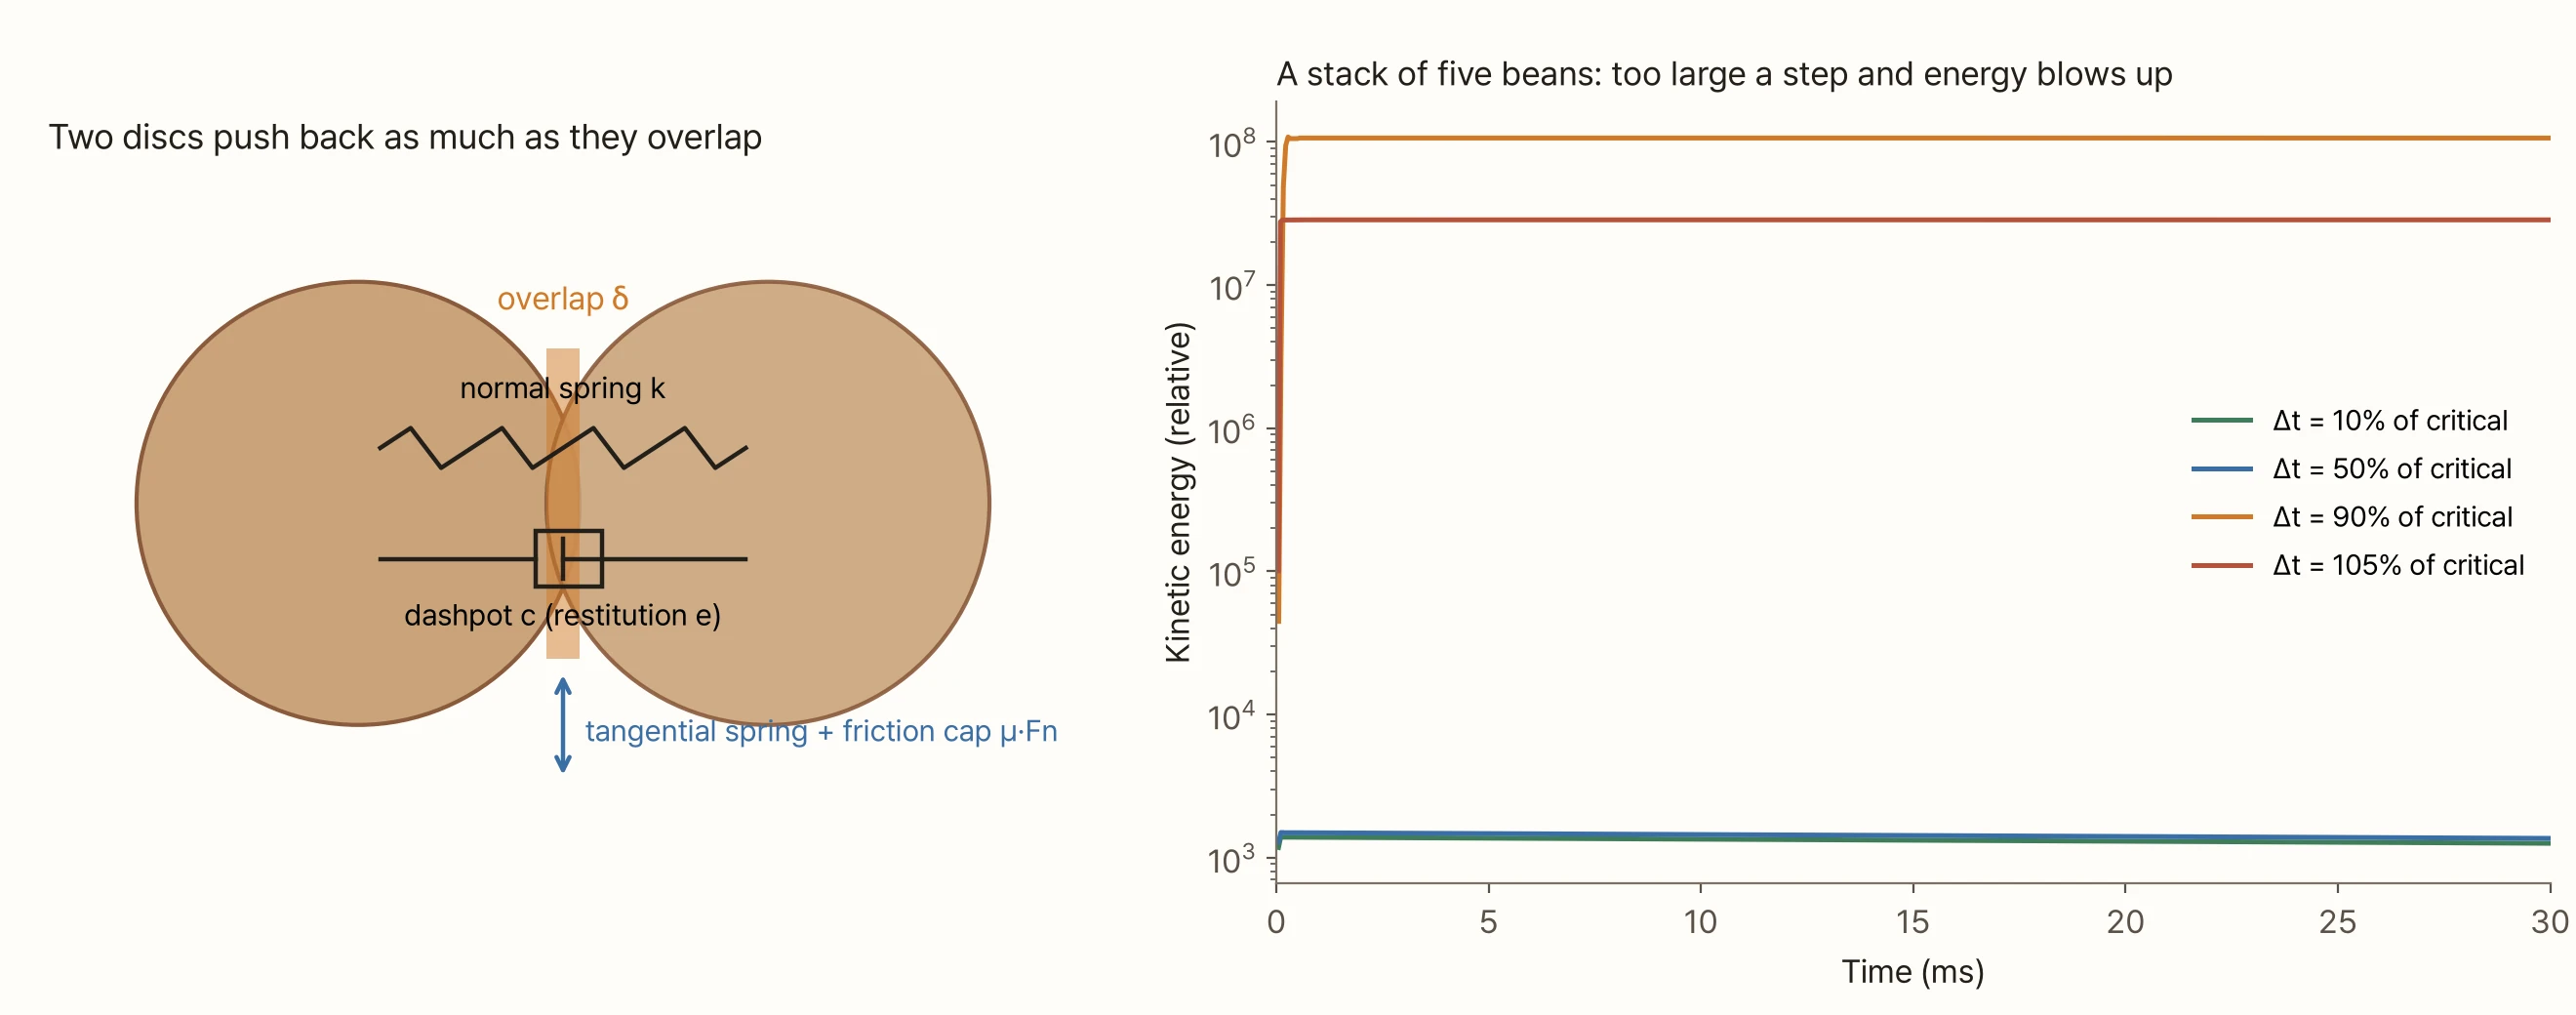
The Δt in the last step is DEM's first trap. A mass on a spring oscillates on a timescale of about √(m/k). If a step is longer than that, the calculation can't follow the oscillation and energy grows by itself. For a single spring the limit is 2√(m/k). The graph on the right runs a stack of five beans with only the time step changed. At 10% and 50% of the limit it was fine. At 90% the energy blew up a hundred-thousand-fold right away. When a grain is squeezed by several contacts at once, the real limit is lower than for a single spring. That's why commercial DEM programs recommend around 20% of the Rayleigh time, the time an elastic wave takes to cross one particle. The model in this piece uses 15% of 2√(m/k).
The smallest grain sets this limit. In my model the limit scales with the square root of the diameter (mass is proportional to area and stiffness to radius). With only 6 mm beans the limit is about 15 µs; as soon as a single 400 µm fragment appears it drops to about 4 µs. In 3D, with stiffness set by an elastic modulus, the limit scales with the diameter, so one fine particle (30 µm) makes the time step hundreds of times shorter than for bean-sized particles.
Two ways to add breakage
DEM grains don't break by themselves. There are two main ways to add breakage.
- Bonded particle model (BPM): build a bean out of hundreds of small discs glued together with bonds. The discs don't break; the bonds do. Each broken bond is a microcrack, and when microcracks join, a piece falls off (Potyondy and Cundall 2004)
- Particle replacement model (PRM): keep the bean as a single disc. The moment the load exceeds that bean's limit, swap it wholesale for a predefined set of fragments (Tavares and das Chagas 2021)
I tuned both to the same bean and compared them. A 6 mm bean sits between two plates and the top plate is lowered slowly. In "How Does a Coffee Bean Break?" the measured beans first cracked at 30–60 N after being pressed 0.27–0.38 mm.
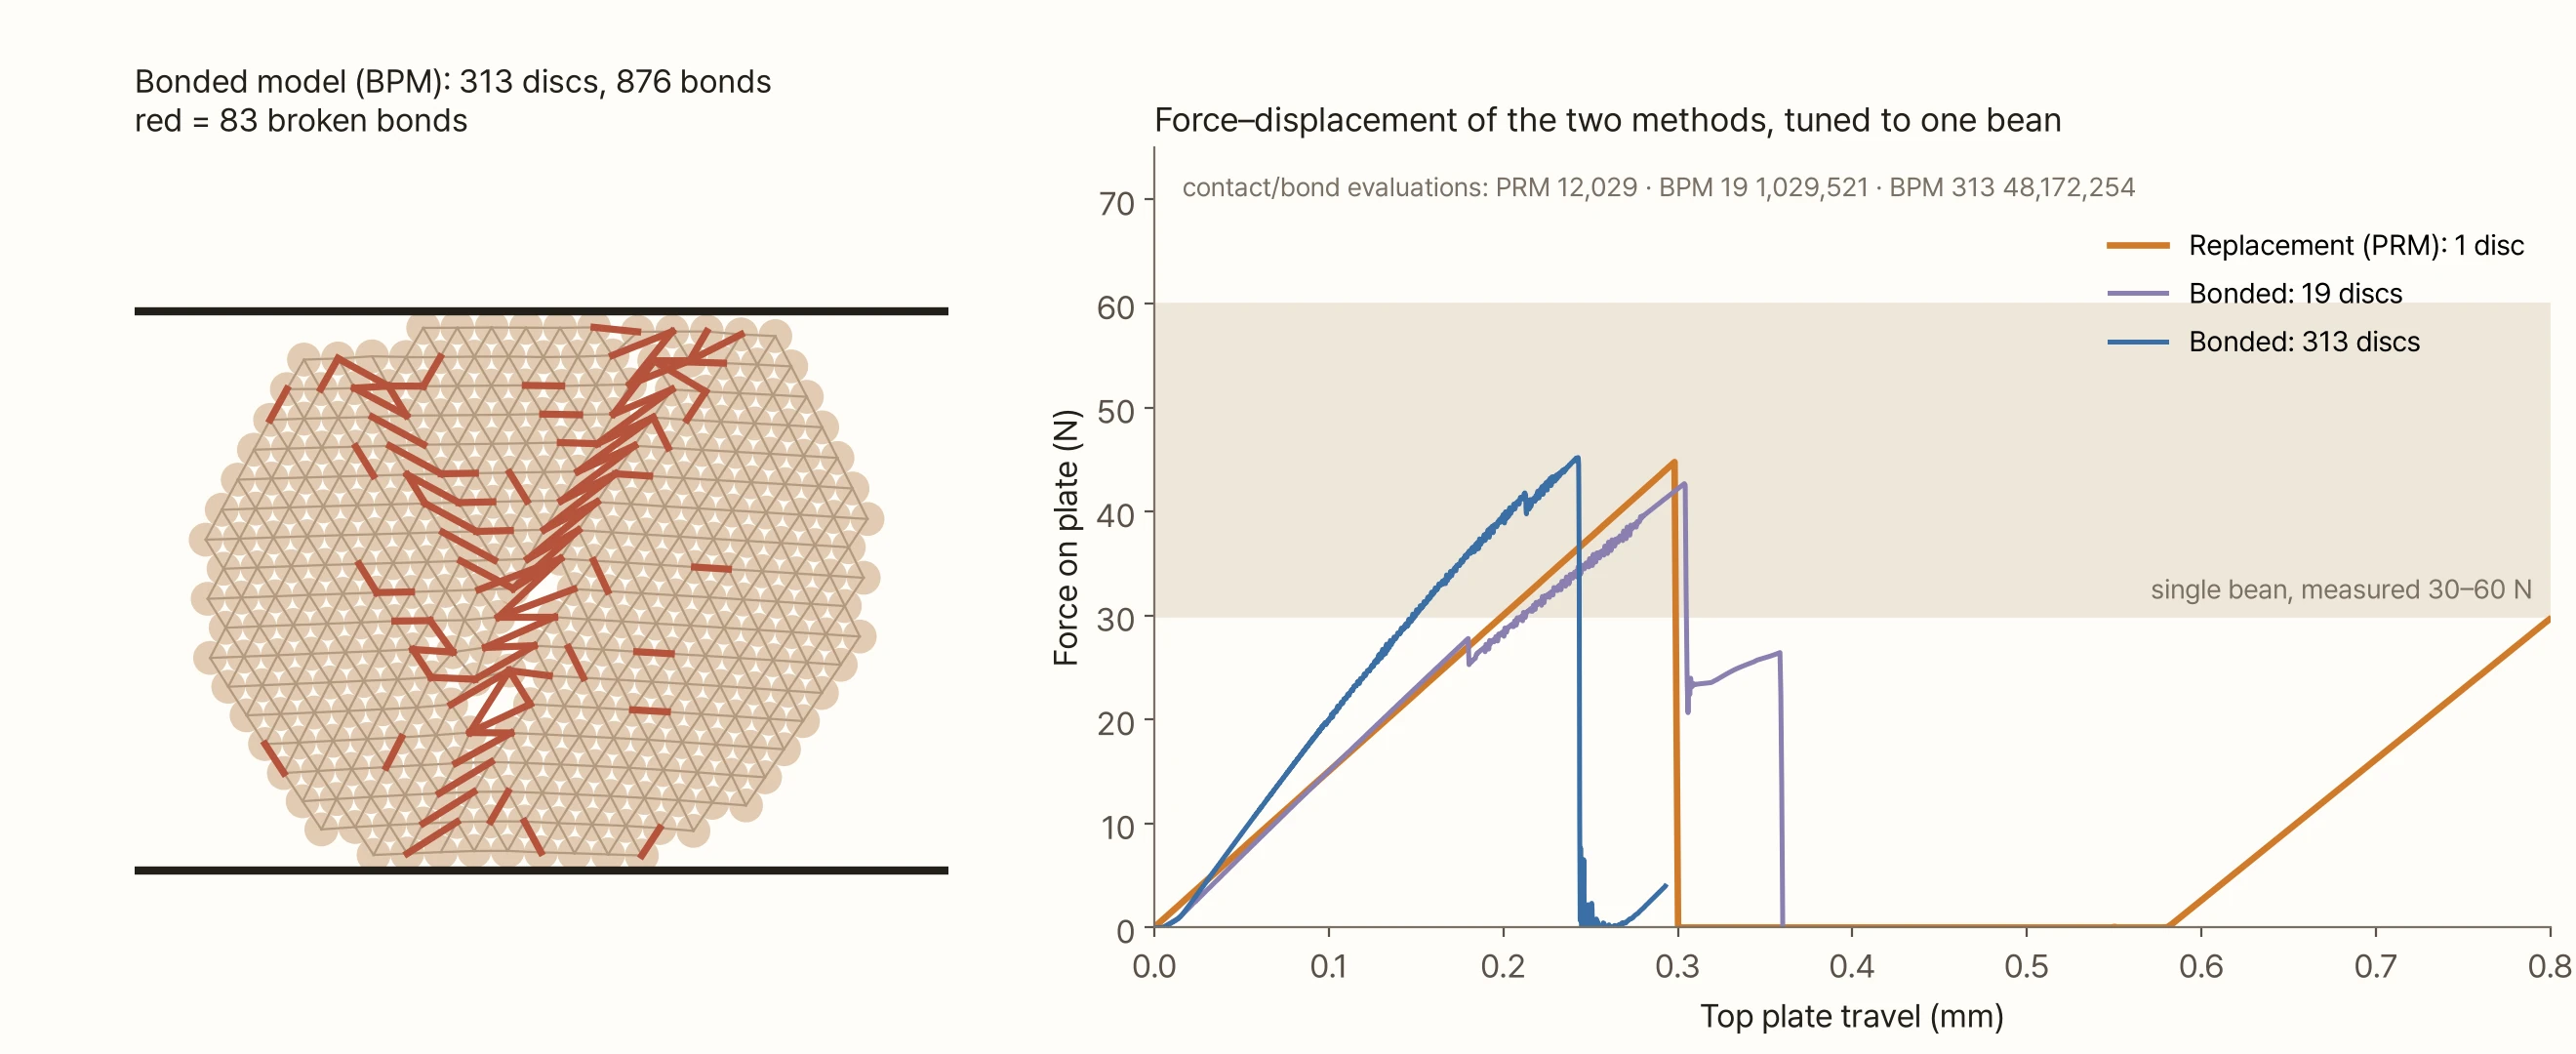
The bonded model's force–displacement curve looks like a real material. The force climbs, dips a little (a few bonds breaking), climbs again and then collapses all at once. As the left picture shows, it also leaves a record of where the crack ran. The replacement model rises in a straight line and cuts off at the preset force. There is no crack shape.
The cost is very different, though. Over the same 0.8 mm of pressing, the replacement model evaluated contacts about 12,000 times; the 313-disc bonded model evaluated contacts and bonds about 48 million times, 4,000 times as many. The bonded model is also hard to tune. The stiffness of discs and bonds and the strength of the bonds are 'micro-properties' you can't measure directly, so you keep changing them and rerunning until the whole cluster behaves like a bean. Here I had to raise the stiffness to 11.6 times its starting value and search the bond strength by bisection nine times before it broke at 45 N. The 109-disc version could not be tuned the same way: each change of bond strength gave an erratic breaking force and the bisection never converged.
Grains tell the same story. Patwa et al. (2016), who first simulated wheat roller milling with a bonded model, predicted a mean particle size of 438 µm, with a deviation from the measurement given in the abstract as 177%. Even after adjusting properties it was 139–144%. Wang et al. (2023) built a wheat kernel from 512 spheres and ran 27 combinations to match its breaking load within 1.6%, but they did not match the fragment size distribution.
That's why comminution processes are usually computed with particle replacement. The Tavares model built into commercial DEM programs (EDEM, Rocky) gives each particle its own breakage energy (an upper-truncated lognormal distribution), makes smaller particles need more energy per unit mass, and lets damage accumulate from impacts that don't break the particle. Fragment sizes after breakage are set by a few numbers called 'tn'; t10 is the mass fraction of fragments smaller than one tenth of the parent size. My model is far simpler. It breaks on force, the quantity measured between plates, instead of energy (with a size effect making smaller pieces stronger in terms of stress), and it leaves out damage accumulation.
Grinding between rolls
My model uses two rolls instead of burrs. Two rolls of radius 40 mm turn towards each other with a gap between them, and their facing surfaces move down at 1 m/s. Roller grinders, one kind of industrial coffee grinder, look like this, and in cross-section they are easy to handle in 2D. The inside of a burr grinder comes in later pieces. A bean is a 6 mm disc (a 1 mm thick slice) and drops one at a time down a 9 mm wide chute.
The breakage rule is this. If the largest contact force on a bean in a step exceeds its breaking force, it is replaced on the spot by 2–4 fragments. The fragments randomly share 92% of the parent's area; the other 8% is counted separately as 'fines below resolution'. Fragments smaller than 0.4 mm are also removed from the calculation and counted there. Commercial implementations likewise leave unresolved fines out of the calculation and add them at the end.
So far, easy. The problem was where to put the fragments.
You can't tile a big disc's area exactly with a few smaller discs. Area-conserving fragments placed where the parent was will always overlap. In DEM an overlap is a repulsive force, so fake springs appear where in reality there is no force at all. I compared four approaches.
- Overlap as is: put full-size fragments anywhere inside the parent
- Shrink, then grow: place them shrunk so they don't overlap, then grow them to full size over 2 ms
- Overlap + damping: place them full size and overlapping, but for 5 ms cap the repulsive force on contacts involving new fragments and damp out vibration immediately. This is a simplified imitation of what a commercial implementation (EDEM) does
- Siblings ignore each other: place them full size where the parent was, but fragments from the same parent don't push each other until they have separated. Spots that already overlapped neighbours or rolls are avoided. This is my own choice
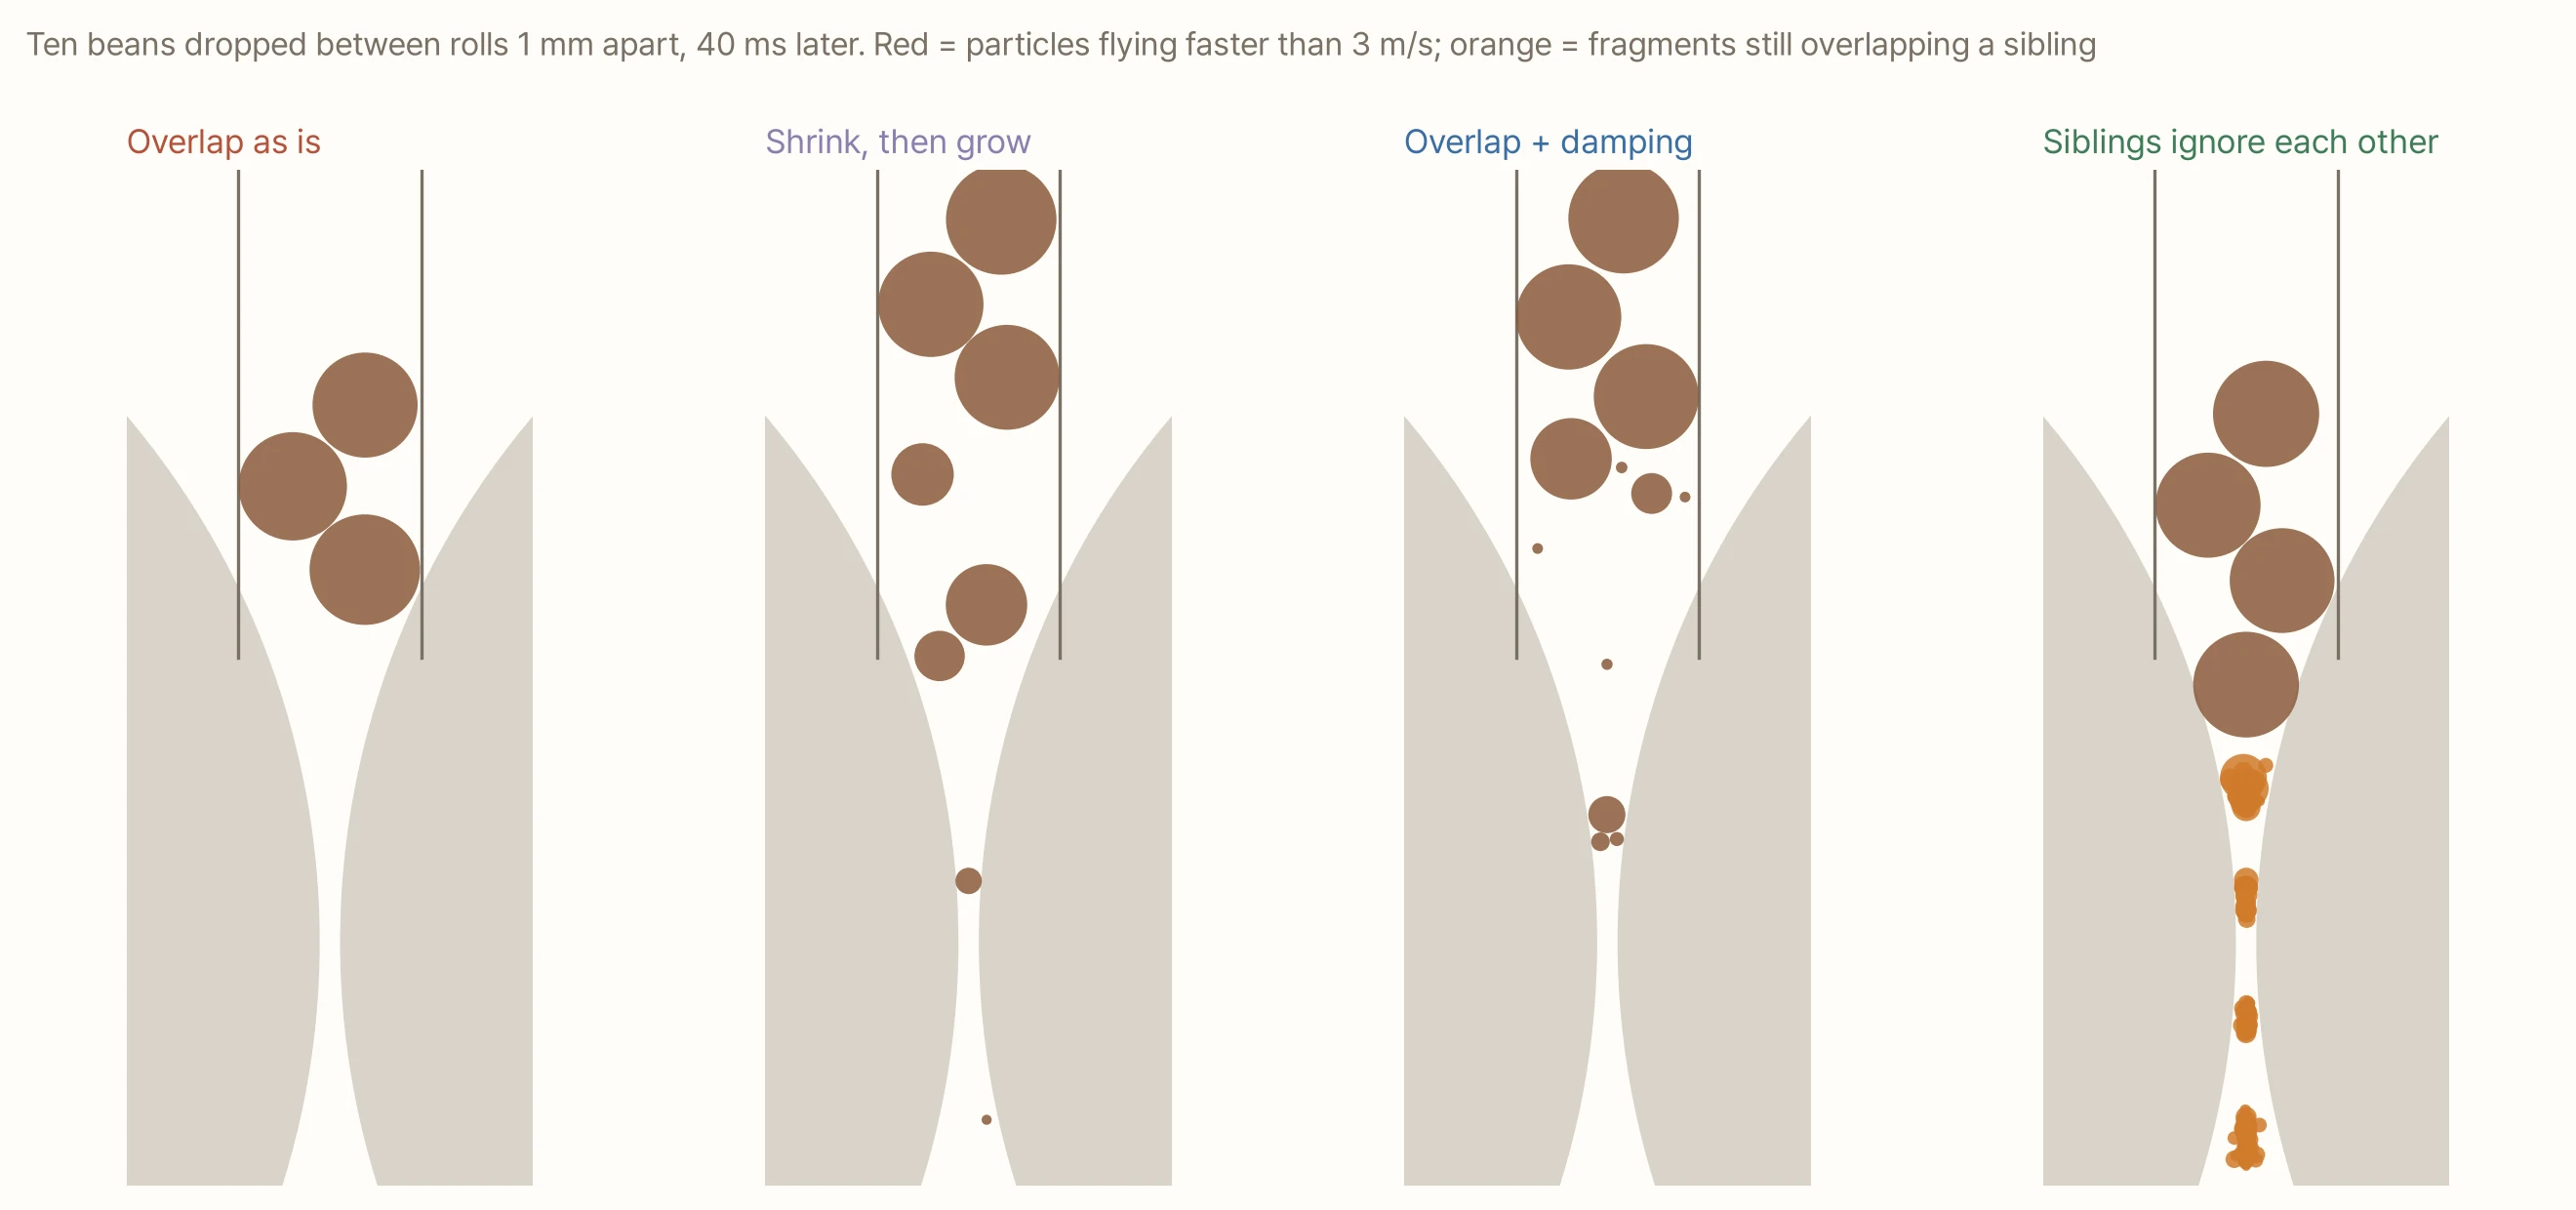
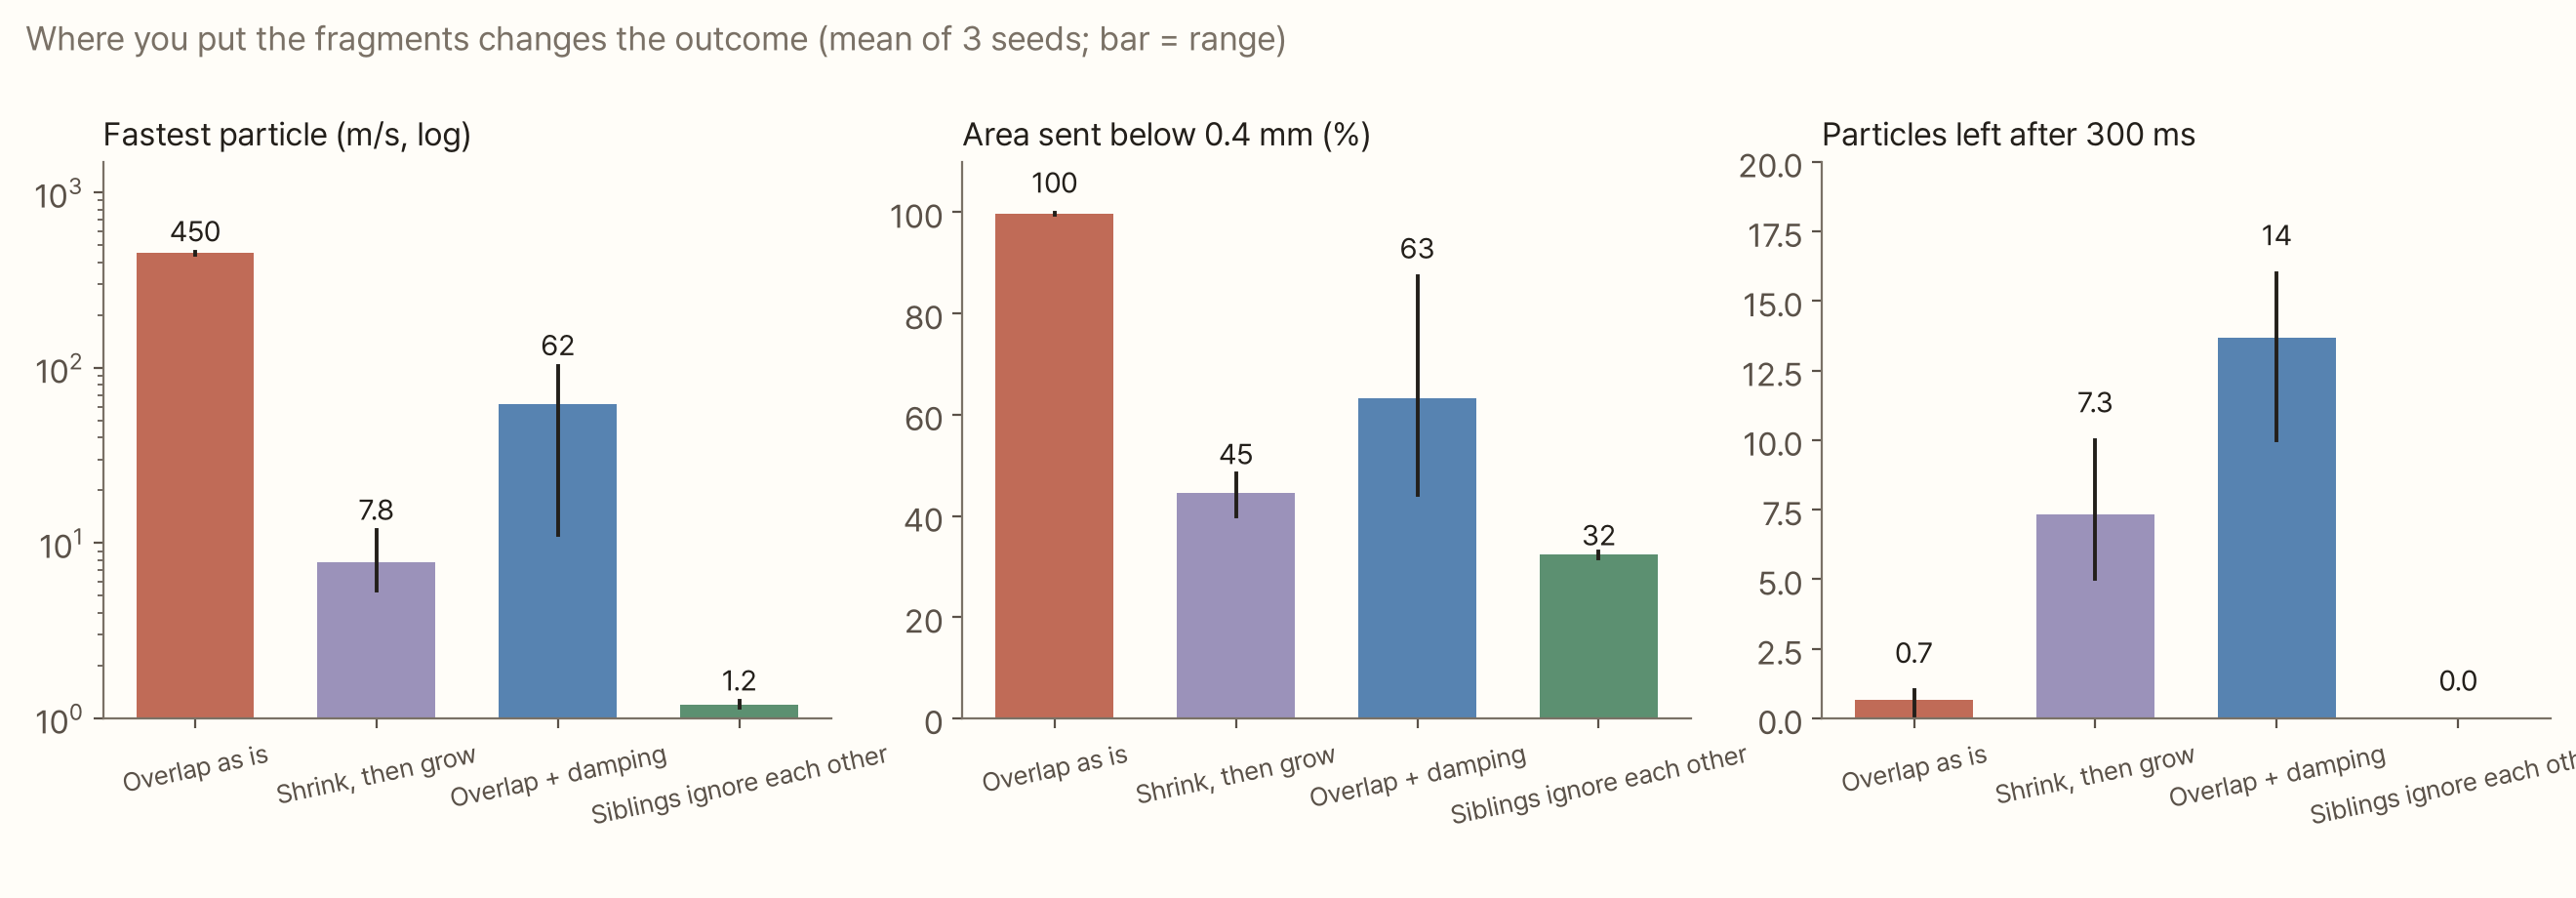
The results split widely.
- Overlap as is: fragments shoved each other apart at hundreds of metres per second and broke again from that force. Ten beans broke 1,100–1,300 times and turned almost entirely into powder below 0.4 mm. That's not a grinder; it's an explosion
- Shrink, then grow: no explosion, but fragments growing in the narrow gap were squeezed upward like something pressed out of a wedge. After 300 ms, 5–10 pieces were still sitting in the chute
- Overlap + damping: quiet for the 5 ms of damping, then the remaining overlaps all popped at once when the damping lifted. Commercial programs tune the strength and duration of this damping more carefully; my simple imitation never found the balance
- Siblings ignore each other: the fastest particle barely exceeded 1 m/s, and all ten beans went through the rolls in 0.1 s. About 33% of the area went below 0.4 mm
Same beans, same rolls, same breakage rule, yet the 'share below 0.4 mm' ranged from 33% to 100%. The rule for placing fragments changed the result more than the rule for breaking. The fourth method has its price too: sibling fragments can pass through each other for a moment, so while they overlap they occupy less space than they really would. Between rolls, where fragments scatter quickly, that matters little, but a calculation that compresses a packed powder bed would need to look at it again.
Changing the gap
Using the fourth method, I ground 20 beans at each roll gap from 0.5 to 3 mm.
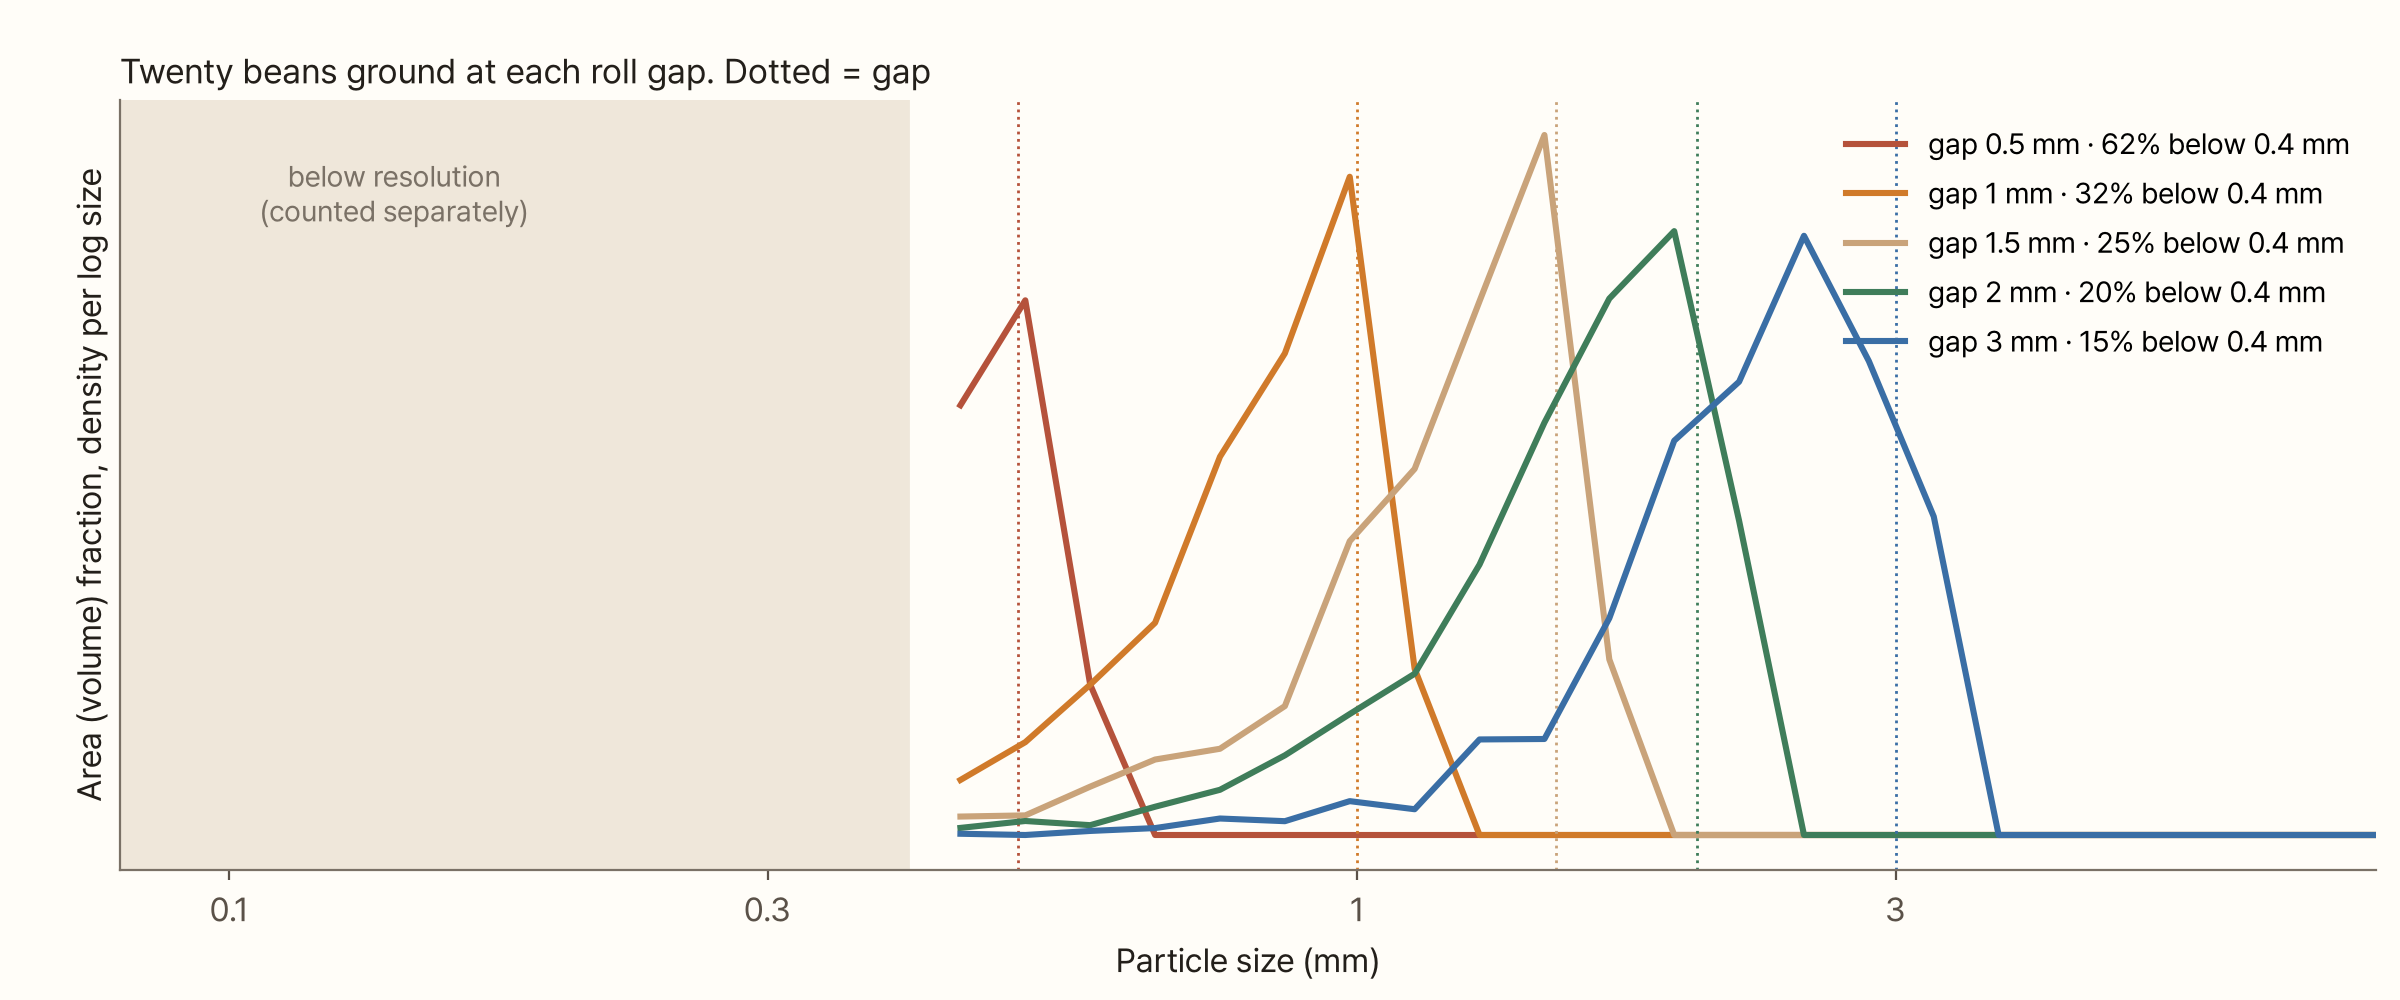
The coarse peak sat just below the gap. Some fragments slightly larger than the gap also came through: they slipped out while squashed. With a linear spring contact a fragment can be pressed 0.1–0.3 mm before it breaks. The share sent below 0.4 mm was 62% at a 0.5 mm gap and 15% at 3 mm; the narrower the gap, the more there was.
This graph doesn't have the fines peak from the last two pieces. Below 0.4 mm I only counted how much, not at what sizes. The shape of the fines has to be set outside the simulation and attached afterwards. Putting the conclusion of "Fines Are the Size of a Cell", a peak fixed at the cell size, into that blank is the next step.
Raising the resolution
What if fragments are kept in the calculation down to smaller sizes? At a 1 mm gap I changed the 'smallest fragment kept' from 1,000 µm to 150 µm and computed the first 100 ms.
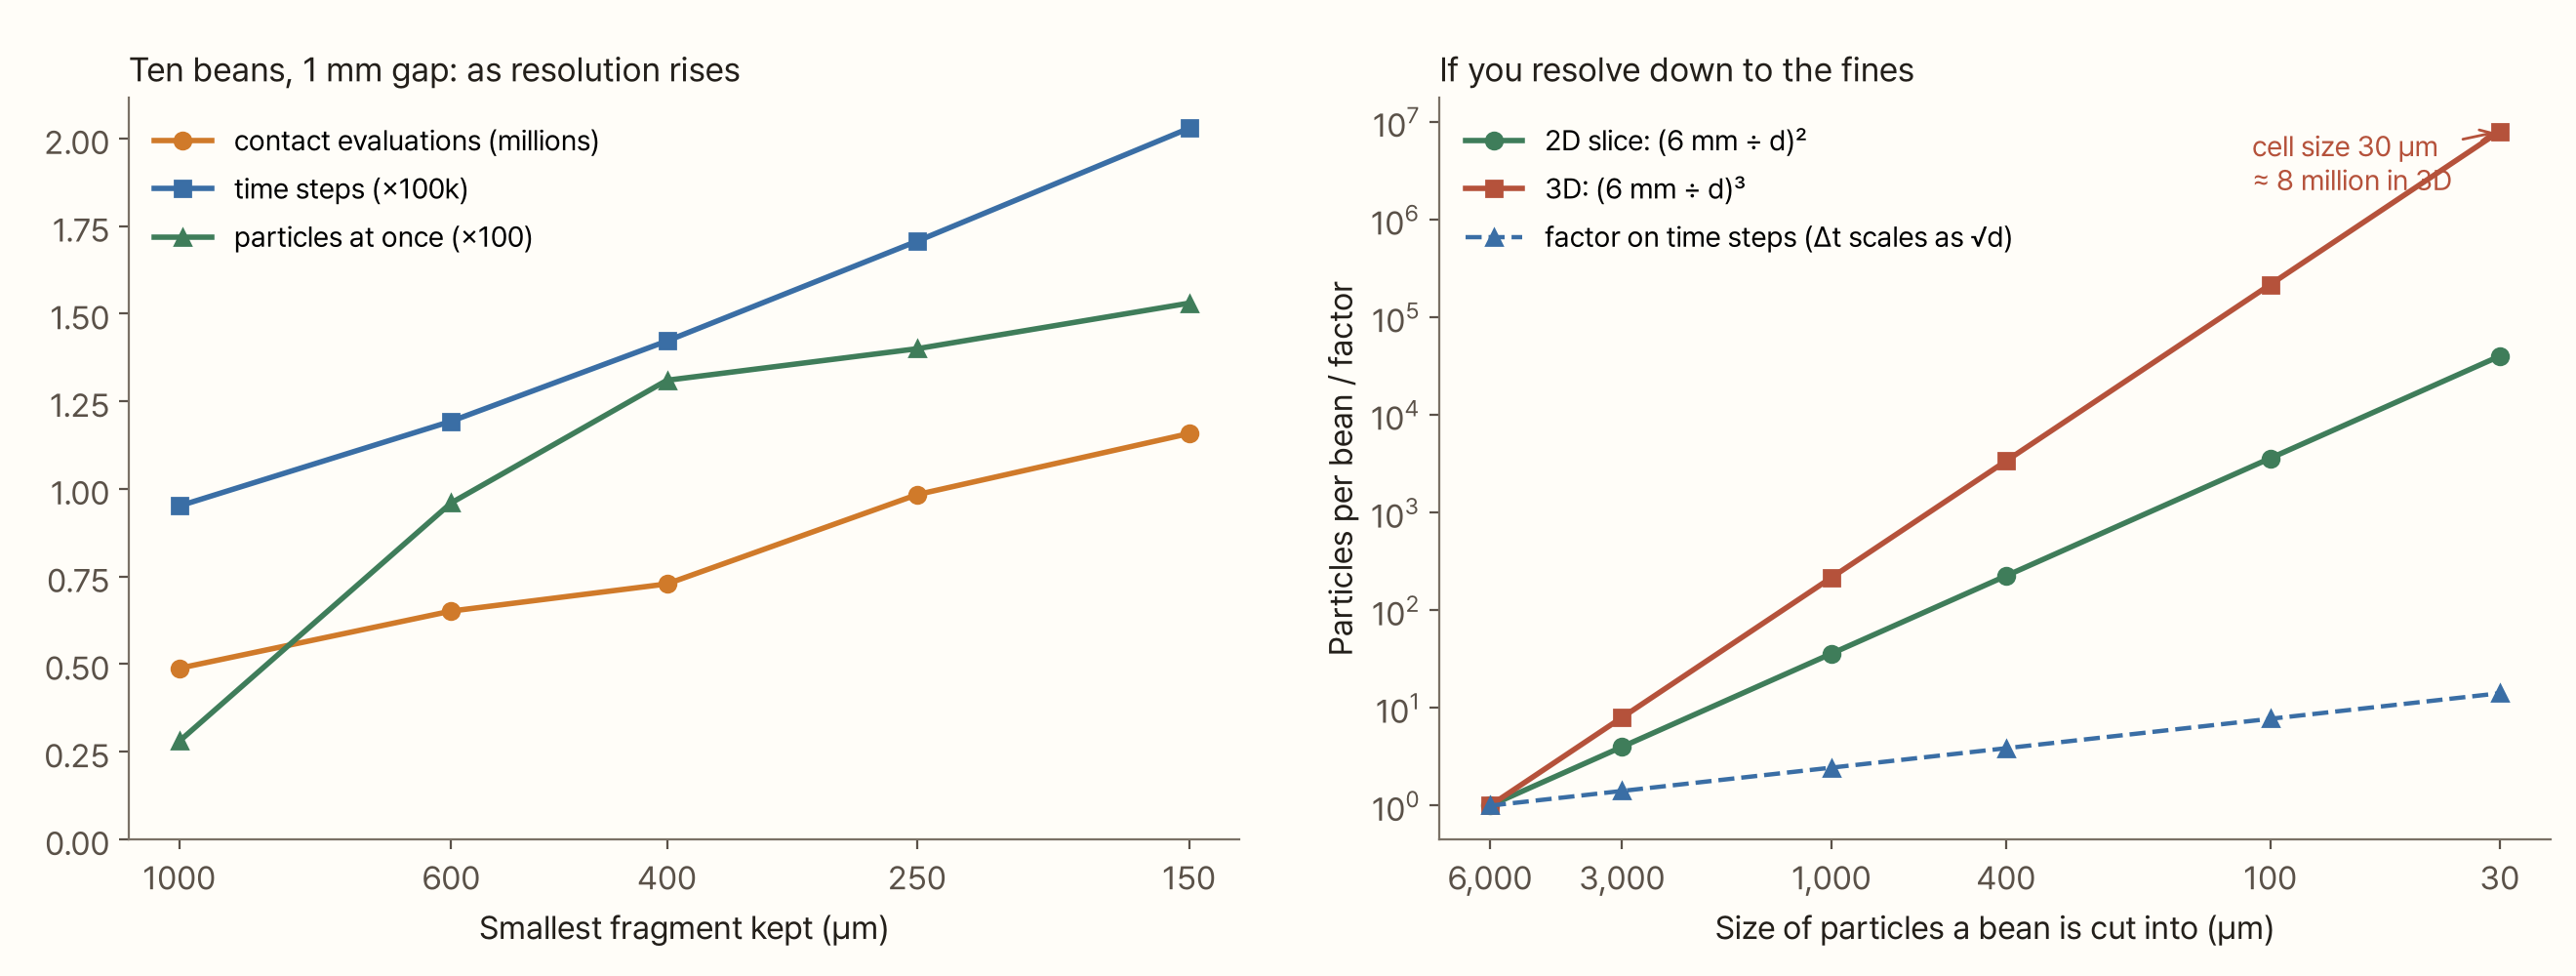
Going from 1,000 µm to 150 µm, the number of time steps rose from 95,000 to 200,000 and computer time from 0.8 s to 12 s. Yet the share below 0.4 mm was almost the same at 400, 250 and 150 µm: 32.6%, 31.6% and 32.0%. In this roll calculation, small fragments that had passed the gap rarely broke again, so following them below 0.4 mm as particles gained little.
The graph on the right rules out resolving everything down to the fines. Cut a 6 mm bean into 30 µm particles and you get 40,000 even in a 2D slice and about 8 million in 3D; using the bean's actual volume gives around 10 million. The time step shrinks accordingly. A single espresso dose (about 130 beans) would be over a billion particles. That's why commercial programs keep unresolved fines out of the calculation. Ciantia et al. (2015), working on crushable soil grains, reported that keeping only 53% of the broken mass inside the calculation and accounting for the rest outside still reproduced the overall behaviour, and made the calculation 100 times faster.
What has to be measured before this works for coffee
Once again I found no peer-reviewed paper that simulates coffee grinding with DEM. The only DEM studies of coffee beans look at how beans move inside roasters (Al-Shemmeri et al. 2021, 2023; Che et al. 2023). There is one vendor demo video of a coffee grinder, without calibration or validation data.
The bigger gap is material properties. DEM needs a density, an elastic modulus, a coefficient of restitution and a friction coefficient for each particle. I found no paper that measured the elastic modulus, restitution or friction of a single roasted bean. For wheat and maize there are several papers that measure these values at different moisture levels. Most of the values in my model are my own choices.
| Value | In this model | Basis |
|---|---|---|
| Density | 0.62 g/cm³ | Roasted bean density from Schenker (2000) |
| Stiffness | a 6 mm bean pressed 0.3 mm at 45 N | Force–displacement of a single bean (Nedomová et al. 2013) |
| Breaking force | mean 45 N at 6 mm, scatter CV about 36% | Measured 30–60 N (Nedomová et al. 2013) |
| Size effect | breaking force ∝ diameter^1.7 | My choice |
| Restitution | 0.3 | My choice |
| Friction | 0.5 | My choice |
For reference, the energy a single bean absorbed up to its first crack in Nedomová et al.'s tests (6.4–13.7 mJ), divided by the bean's mass, is about 40–120 J/kg. That is the same order of magnitude as the breakage energies of the ores the Tavares model deals with. But the beans were pressed slowly between plates and the ore values come from impact tests, so the definitions are not the same.
Try it yourself
Below you can drop beans between the rolls yourself. Pick one of the four ways to place fragments at the top, and change the gap, roll speed, number of beans, smallest fragment and bean breaking force. Releasing a slider restarts the run. Red particles are moving faster than 3 m/s; orange ones are new fragments. The table on the right shows the time step, steps computed, particle count, number of breaks, fastest particle and compute time, and below it the distribution of fragments that came out builds up.
Choose 'Overlap as is' and you can watch beans turn to dust and vanish the moment they touch the rolls. Lower the 'smallest fragment' and the time step shrinks and the calculation slows down.
What this conclusion leaves out
- It's a 2D disc model. Each bean is a 1 mm thick slice. Real particles are three-dimensional and not round. Discs roll easily, so they flow more freely than real pieces
- Breakage is force-based with no damage accumulation. Commercial models use energy and accumulate damage. The weakening from repeated hits is missing
- Fragments are split randomly into 2–4 pieces. I didn't use an experimentally derived fragment distribution (the t10 family). There are no data from actually breaking beans and measuring the pieces
- The four placement methods are my own implementations. In particular 'overlap + damping' is a simplified imitation of a commercial program's method, so its result should not be used to judge that program. I only checked the commercial damping settings as far as the documentation describes them
- Siblings ignoring each other is my own choice, with no literature behind it. It creates no energy, at the cost of letting fragments overlap for a while
- It's a roller grinder, not a burr grinder. Burr teeth, centrifugal force and the gradually narrowing gap of a conical burr come in later pieces
- Most of the properties are not measured values. Change the ones marked 'my choice' in the table above and the results change
- The bonded model comparison pressed only one bean. I didn't run the whole roll grind with a bonded model
Summary
- DEM treats each contact as a spring and damper and solves the motion in very short time steps. At just 90% of the critical step the energy blew up. The step is set by the smallest grain
- There are two ways to add breakage. The bonded model shows the shape of the crack, but it did 4,000 times more work than particle replacement to press a single bean and was hard to tune. Particle replacement is cheap, but you have to decide where the fragments go
- Area-conserving fragments always overlap where the parent was. Depending on how that overlap was handled, the share going below 0.4 mm ranged from 33% to 100% for the same beans and the same rolls
- Widening the roll gap from 0.5 to 3 mm moved the coarse peak with the gap and cut the share below 0.4 mm from 62% to 15%
- Raising the resolution from 400 to 150 µm left the share below 0.4 mm at about 32% and only doubled the compute time. A bean cut into cell-sized particles is about ten million particles, so fines have to be attached outside the calculation
- I found neither a DEM paper on coffee grinding nor any measurement of a single roasted bean's elastic modulus, restitution or friction. What coffee DEM lacks right now is measurement more than computing power
References
- Cundall PA, Strack ODL (1979). A discrete numerical model for granular assemblies. Géotechnique 29(1), 47–65. doi:10.1680/geot.1979.29.1.47
- Potyondy DO, Cundall PA (2004). A bonded-particle model for rock. International Journal of Rock Mechanics and Mining Sciences 41(8), 1329–1364. doi:10.1016/j.ijrmms.2004.09.011
- Tavares LM, das Chagas AS (2021). A stochastic particle replacement strategy for simulating breakage in DEM. Powder Technology 377, 222–232. doi:10.1016/j.powtec.2020.08.091
- Tavares LM (2022). Review and further validation of a practical single-particle breakage model. KONA Powder and Particle Journal 39, 62–83. doi:10.14356/kona.2022012 — the Tavares model's equations, t10
- Altair. EDEM documentation: Tavares UFRJ Breakage Model, Estimate Simulation Time. link — overlapping fragment placement and damping, mass conservation, the 20% of Rayleigh time recommendation
- Patwa A, Ambrose RPK, Casada ME (2016). Discrete element method as an approach to model the wheat milling process. Powder Technology 302, 350–356. doi:10.1016/j.powtec.2016.08.052 — abstract only
- Wang X, Wu W, Jia H (2023). Calibration of discrete element parameters for simulating wheat crushing. Food Science & Nutrition 11(12), 7751–7764. doi:10.1002/fsn3.3693
- Ciantia MO, Arroyo M, Calvetti F, Gens A (2015). An approach to enhance efficiency of DEM modelling of soils with crushable grains. Géotechnique 65(2), 91–110. doi:10.1680/geot.13.P.218 — abstract only
- Schäfer J, Dippel S, Wolf DE (1996). Force schemes in simulations of granular materials. Journal de Physique I 6, 5–20. doi:10.1051/jp1:1996129 — restitution and damping coefficient
- Al-Shemmeri M, Windows-Yule K, Lopez-Quiroga E, Fryer PJ (2021). Coffee bean particle motion in a spouted bed measured using PEPT. Journal of Food Engineering 311, 110709. doi:10.1016/j.jfoodeng.2021.110709
- Che H et al. (2023). PEPT validated CFD-DEM model of aspherical particle motion in a spouted bed. Chemical Engineering Journal 453, 139689. doi:10.1016/j.cej.2022.139689
- Nedomová Š, Trnka J, Stoklasová P, Buchar J (2013). Strength of coffee beans under static and dynamic loading. Acta Universitatis Agriculturae et Silviculturae Mendelianae Brunensis 61(3), 743–749. doi:10.11118/actaun201361030743 — breaking force, displacement and energy of a single bean
- Schenker S (2000). Investigations on the Hot Air Roasting of Coffee Beans. Doctoral thesis, ETH Zürich, Diss. ETH No. 13620 — density of roasted beans
Image credits
- All figures, the cover and the simulation: my own