One-Click Firework Festival Best-Viewing-Spot Map — Building a Map That Calculates 990,000 Grid Cells of Seoul from a Single Line of Input
"One-click" development is all the rage right now. Some companies' actual development environments are changing dramatically because of it, and the debate over it is in full swing. Still, it does feel like the world has gotten better in the sense that anyone can build something reasonably close to what they want. While tinkering with various things, a friend mentioned on KakaoTalk that there was a fireworks festival happening the next day in Yeouido. So I immediately asked Claude the following.
So there's a fireworks festival on the Han River coming up, right? I'd like you to use a map of Seoul along with elevation data and so on to show, as a heatmap on the map, where the fireworks would be best viewed from.
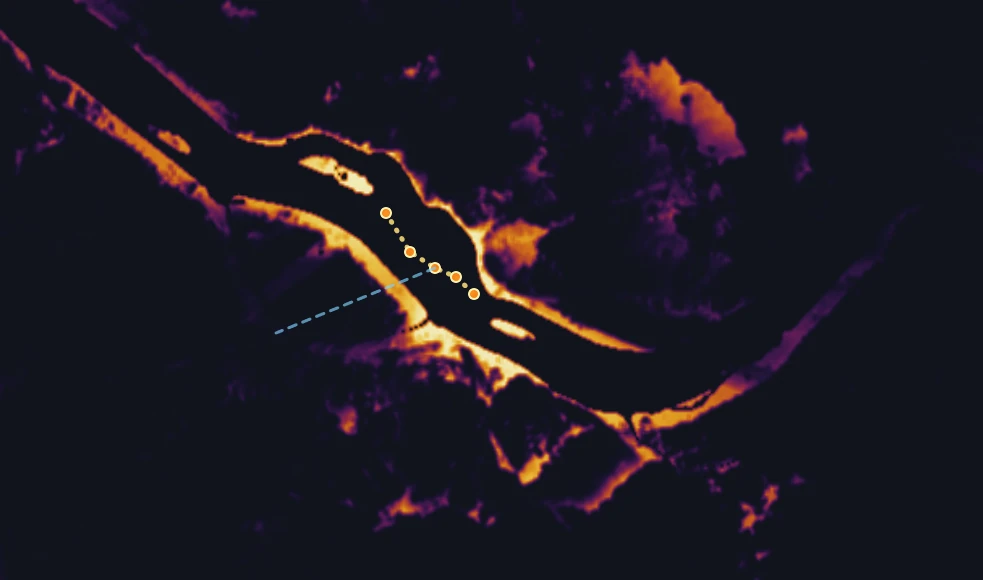
About 40 minutes later, out came a map file that opened in a browser. It was a map that had divided Seoul into 990,000 cells, each 30 meters by 30 meters, checked "can the fireworks be seen from here" for every single one, and colored them accordingly.
Results First
The Seoul International Fireworks Festival 2026 runs from 8:00 to 9:10 p.m. on Saturday, September 5, with fireworks launched from the stretch of the Han River between Mapo Bridge and Hangang Railway Bridge. The top results of the calculation were as follows.
| Rank | Spot | Score | Distance to Launch Point |
|---|---|---|---|
| 1 | Ichon Hangang Park, west side | 1.00 | 1.4 km |
| 2 | Nodeul Island | 1.00 | 1.4 km |
| 3 | Nodeulnaru Park | 1.00 | 1.5 km |
| 4 | Sayuksin Historical Park | 0.99 | 1.3 km |
| 5 | Hyosajeong | 0.99 | 1.7 km |
| 6 | Yeouido Hangang Park, east side (near Wonhyo Bridge) | 0.99 | 0.65 km |
| 7 | Yongyangbongjeojeong Park Sky Observatory | 0.98 | 1.7 km |
The Hangang parks to the west came in a notch lower — Yanghwa at 0.79, Seonyudo at 0.76. Their sightlines were open, but they lost points for a different reason.
The wind. At 180 meters above ground — the height at which the fireworks burst — the wind at 8 p.m. on the 5th blows from the east-northeast at 9.8 meters per second. That means the smoke drifts west-southwest. If you're positioned to the west, at spots like Yanghwa, Seonyudo, or Mangwon, you end up watching through the smoke; if you're to the east, at spots like Ichon, Nodeul Island, or Banpo, the wind is blowing toward you and the view stays clear. This is part of why five of the top six spots are on the east side.
The weather itself is good: a temperature of 23.5°C, 0 percent chance of rain, 16 percent cloud cover, and 20 kilometers of visibility.
Elevation Alone Doesn't Give You the Answer
My first mental picture was simple: high places would have the best view — somewhere like Namsan or Eungbongsan.
But in Seoul, what blocks your view isn't mountains — it's buildings. Standing on flat ground 3 kilometers from the Han River, the angle at which you look up at fireworks bursting 250 meters in the air is only about 5 degrees. A single 15-story apartment building in front of you is enough to end the view right there.
So whether the terrain data includes building heights turns out to be everything — and this is where the approach got overhauled three times.
First, SRTM. This is worldwide elevation data made by a U.S. space shuttle scanning the surface with radar. It clocked Namsan at 259 meters. The real figure is 262 meters, so that's accurate. But it put the site of Yeouido's Parc1 tower at 13 meters — the spot where a 333-meter building actually stands.
Second, Copernicus GLO-30. Made by the European Space Agency, and more recent. It put Namsan at 267.5 meters, which was actually even more accurate. But it listed the site of the 63 Building at 18 meters — a 249-meter building.
This is where the reason becomes clear. Most worldwide elevation data is built to measure the ground itself. Buildings are treated as noise and stripped out. That's the right approach for geological surveys or flood prediction, but for judging sightlines in a city, it's exactly the opposite of useful.
The third thing found was global building-height data produced by the European Commission's Joint Research Centre. Every 100-meter cell is marked with the average height of the buildings standing inside it. On top of that, 69,380 individual Seoul buildings were pulled separately from OpenStreetMap and layered in. Of those, 16,570 had a recorded number of floors or height, and the tallest value that came out was 322 meters — Yeouido's Parc1. Only now did things start to come into focus.
Overhauling all three approaches took about 20 minutes. I did nothing during that time. In fact, all the facts and judgments described above were things Claude found and reasoned through on its own — all I had written, after all, was "I'd like you to show it on the map, like a heatmap."
How the Calculation Was Done
The underlying principle itself isn't complicated. Just imagine this.
Suppose there's a very bright light bulb at the spot where the fireworks explode. That bulb shoots out beams of light in every direction. Wherever a beam reaches the ground is a place where the fireworks can be seen; wherever a building or mountain blocks it and casts a shadow is a place where they can't. This is exactly the calculation that mapping people call a viewshed.
In practice, it was run like this.
- Beams of light are cast in 4,000 directions, checking the height every 15 meters out to a distance of 15 kilometers
- There isn't just one launch point. Five spots were set in the middle of the river between Mapo Bridge and Hangang Railway Bridge
- The burst height isn't just one value either — six levels: 70, 120, 180, 250, 320, and 400 meters
- Five times six — the calculation was run 30 times, and the score was based on "how many of these could be seen"
If only the high bursts were visible and the low ones weren't, that counted as a half-view and lost points. That matches reality — you need to be able to see the low bursts too for it to count as really watching the show.
The curvature of the earth and the slight bending of light by the atmosphere were also factored in — that makes about a 6.8-meter difference at a distance of 10 kilometers. Nobody had told it to account for this; it simply included it on its own.
The 30 calculations took 50 seconds.
Where It Went Wrong
After the calculation finished, pulling up the scores for each famous spot showed the summit of Namsan scoring 0.08 — 8 out of 100. That doesn't make sense. The view from Namsan toward Yeouido is wide open.
So a cross-section was taken to see exactly where the sightline was being blocked.
== Namsan summit  (elevation 268 m, observer height 269 m, distance to launch point 4.70 km, burst height 250 m)
   minimum clearance -48.0 m @ 50 m mark  (terrain 257 + building 60 = 317 m)
Something 317 meters tall was blocking the view just 50 meters ahead. It was N Seoul Tower. The coordinates it had been given happened to sit right at the tower's base, so the tower was blocking its own view. Just moving 50 meters toward the plaza brought the score up to 0.79. The data was fine all along — it was the coordinates that were the problem, and a single cross-section caught it.
Eungbongsan was examined the same way. In this case, the 0.06 score turned out to be genuine.
== Eungbongsan  (elevation 95 m, distance to launch point 7.83 km, burst height 250 m)
   minimum clearance -22.9 m @ 3000 m mark  (terrain 108 + building 72 = 180 m)
It's blocked by the Maebongsan ridgeline 3 kilometers ahead. From 7.8 kilometers away, the angle of looking up at something 250 meters in the air is only 1.1 degrees. That's nearly horizontal, so a single ridge blocks the whole thing. Its reputation as a night-view spot turned out to be a separate matter from fireworks.
Retracing things this way also turned up two bugs in the calculation itself.
One. Hyosajeong and Sayuksin Historical Park both came out at 0. These are spots that every newspaper lists as prime viewing spots. The cause was absurd: when checking whether the sightline was blocked, the calculation was starting its check from the cell the observer is standing in. If there happened to be a building on the very spot where you were standing, it was judging that building as blocking your own view. Once the observer's own cell was excluded, both spots jumped to 0.99.
Two. The riverbank of Yeouido Hangang Park scored 0. Since you can't stand on the river itself, water needs to be excluded from the calculation — but defining water as "elevation 5.5 meters or below" ended up classifying the riverside walking path (3 meters) as part of the river too. That was switched to OpenStreetMap's actual river boundary lines instead. This also required handling the fact that the Han River is stored as multiple separate pieces, with Bamseom and Nodeul Islands marked as holes within it.
The final check was this: the top of the finished ranking matched, almost exactly, the list of prime spots the newspapers had named — Ichon Hangang Park, Nodeul Island, Nodeulnaru Park, Sayuksin Historical Park, Hyosajeong, and Yongyangbongjeojeong Park. Different methods, same answer.
If the Tool Doesn't Exist, Build It
The computer this calculation ran on didn't have a single mapping library installed. It only had a bare Python install, and there was no way to download packages either.
Normally, that's where things would stop. "I'd need to set up the environment first."
Instead, whatever was needed got built on the spot: code to read the satellite elevation files, code to decompress the data packed inside them, code to export the results as image files. The decompression step didn't work the first time and produced strange values, but a check was added on its own — "does the size of the decompressed result match what's expected" — and that caught the problem.
There's something this means for ordinary people. "I can't do it because the environment isn't set up" doesn't hold up the way it used to.
So Why Does a Single Line Work?
Three things came together.
First, the raw materials are already all public. Worldwide elevation data from the European Space Agency, building-height data from the European Union, buildings and rivers from OpenStreetMap, hour-by-hour weather forecasts. All of it is free, and none of it requires signing up for anything. The real old bottleneck was "not knowing this stuff existed." That bottleneck is gone.
Second, the format barrier has gotten lower. Satellite data comes in unfamiliar file formats and unfamiliar coordinate systems. It used to take days just to get through that. Now it takes minutes.
The third is that it checks its own work — and of the three, this is the biggest one. Seeing that the 63 Building came out at 18 meters and deciding "this data won't do," seeing Namsan score 0 and taking a cross-section to find out why. Without that, what comes out is plausible-looking garbage. And that's actually more dangerous, because once something looks like a map, people tend to believe it.
So How Do You Actually "One-Click" Something?
This is probably what most people are actually curious about, more than the fireworks. Everyone talks about "one-clicking" things, but when you try it yourself it doesn't work well, or you figure something built that way can't really reach production quality. But if you use it well, you actually can get pretty decent results fast, and it can genuinely produce things fit for use in an industrial setting. Maintenance and further development are, of course, a separate matter.
Here are a few basic principles for pulling off a good "one-click."
State both the purpose and the shape of the output. My prompt had both "where it's best viewed from" (the purpose) and "like a heatmap on a map" (the shape). State only the purpose and you get a table; state only the shape and you get something pretty but useless.
Don't specify the data source. The machine knows more about what public data exists than I do. If I had said "use SRTM," the result would have ended up missing buildings entirely.
When a result looks off, ask for the reasoning behind it. When Namsan came out at 0, a single request — "show me the reasoning behind this result" — is what surfaced both bugs. Skip that one line, and you walk away with a wrong map and never know it.
Ask about the limitations up front. Ask "what part of this result shouldn't be trusted?" If no answer comes back, the result isn't finished yet.
It Really Is "One-Click" — But the Limits Are Just as Clear
Let me note these honestly.
Because the building-height data is an average value per 100-meter cell, it undercounts super-tall buildings. In reality, they block more than this map suggests. Scores may have come out more optimistic than they should be.
Things at eye level — street trees, pedestrian overpasses, banners — aren't included at all. Along riverside walking paths, these are often exactly what actually blocks the view.
Crowds and access control aren't factored in. Wonhyo Bridge will be fully closed from 9 a.m. on the 5th until 3 a.m. the next day, and Yeouinaru Station will have a one-hour temporary closure starting at 8:40 p.m., with trains passing through without stopping if crowding gets heavy. You might not even be able to reach a spot with a perfect score of 1.
The map is a reference, nothing more. A calculation like this is far more useful for ruling out "you won't be able to see anything at all from here" than for declaring "this is the single best spot."
If you enjoyed reading this, please leave a comment.
Honestly, writing this article was not something I "one-clicked."
And I hope no one takes this to mean that everything can now be one-clicked.
I'll close by offering my sincere sympathy to the developers who keep quietly building, even while getting scolded with "it worked with one click for me, why do you say it can't be done, why are you so slow."