When Should You Make Kimchi This Year? — A Regional Kimjang Map from 30 Years of Temperatures, and Why the First Cold Snap Is a Trap
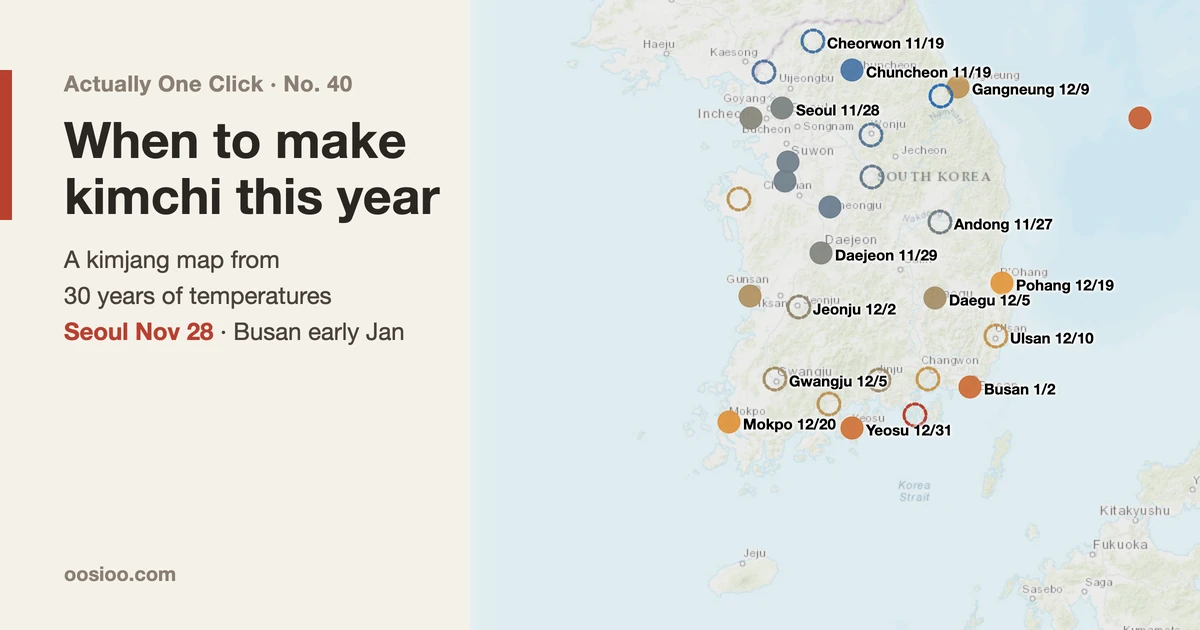
Kimjang, Korea's once-a-year making of winter kimchi, is traditionally timed for when the daily mean temperature stays at or below 4°C and the daily low at or below 0°C. The Korea Meteorological Administration used to publish this itself; since 2016 it has been left to private forecasters. I applied the same rule to 1991–2020 station temperatures to recalculate each region's normal date: Seoul 28 November, Daejeon 29 November, Chuncheon 19 November, Gangneung 9 December, Busan 2 January. The biggest error in the calculation came from one word, "stays". Taking the first day the temperature dipped below 4°C made Seoul's date 14 days early on average. Reanalysis temperatures, used to cover the whole country evenly, pulled Seoul's date 7 days earlier, because the grid washed out the city's heat. Seoul's normal date has moved 2–3 days later over 70 years, but the latest 30 years show no trend. This year the KMA one-month outlook says "above normal" from 9 November to 6 December, so around 1 December is likely for Seoul. The brief cold snap around 7 November is not the time.
In the first week of November the same conversation starts in Korean households. When are we doing it this year? When should we buy the cabbages? When should the salted cabbage be delivered?
The "it" is kimjang: the once-a-year job of making a winter's worth of kimchi in one go. A family will salt dozens of heads of napa cabbage, rub each leaf with a paste of chilli flakes, garlic, ginger and salted seafood, and pack the lot away to ferment slowly through the cold months. Timing matters. Make it too early and the kimchi sours before winter really starts. Leave it too late and the cabbage freezes in the field.
Older relatives set the date by sayings like "when the first ice forms" or "after Ipdong", the solar term that marks the start of winter. Search online and one rule keeps coming up: "when the daily mean temperature stays at or below 4°C and the daily low at or below 0°C." What is harder to find is where those numbers came from, what date they give for your own town, and whether this year will be different from a normal year.
This time I put that rule onto real temperature records. For points across South Korea I worked out the normal kimjang date from 30 years of temperatures, then overlaid this year's forecast and the Korea Meteorological Administration's one-month outlook to mark "roughly when this year" on a map. I also added a calculator that turns a number of cabbages into amounts of seasoning.
What I set out to do
- Trace the kimjang timing rule back to a primary source.
- Find out what happened to the kimjang forecasts the Korea Meteorological Administration (KMA) used to publish.
- Work out each region's normal kimjang date from daily station temperatures, filling the gaps with reanalysis temperatures where there is no station.
- Check in numbers whether the normal date has moved later over the past decades.
- Combine this year's forecast with the KMA one-month outlook to estimate this year's date.
- Build the map and the seasoning calculator into a web page.
The research, calculations, charts and web page were done by AI agents. My part was setting the direction and reading the results. I told the agents to say so whenever a number could not be checked against a primary source.
Where "4°C and 0°C" comes from
First, the source of the rule. A KMA press release, "Kimjang timing forecast for 2010" (12 November 2010), puts it like this:
The appropriate time for kimjang is considered to be when the daily minimum temperature stays at or below 0°C and the daily mean temperature at or below 4°C.
A reason usually comes with it. If it is too warm the kimchi turns sour quickly; if it is too cold the cabbage and radish freeze and lose their flavor. The same release put that year's window at 15–30 November for Seoul, Gyeonggi and the central inland, 1–15 December for the southern inland and the west and east coasts, and after 15 December for the south coast.
The next question was why I hadn't seen a KMA kimjang forecast in years. In a press release on 11 February 2016, titled roughly "Spring blossom, autumn foliage and kimjang timing: now available from many sources", the KMA said it was handing the production of seasonal information such as blossom, foliage and kimjang dates over to the private sector. Since then private weather companies have published kimjang dates each year using the same rule. A 2019 post by one of them, Weatheri, gives the rule word for word ("when the daily mean stays at or below 4°C and the daily minimum at or below 0°C") and says it is calculated from KMA short-range and medium-range forecasts, the one-month outlook and climate normals.
I could not confirm from an original document whether 2015 was the last year the KMA published the forecast itself. What I did confirm is the 2010 press release and the 2016 handover.
How do you count "stays"?
The rule is one sentence, but to compute it you have to decide one thing: what counts as "stays at or below"?
The first version the agent wrote was simple. It took the first day after mid-October when the daily mean dropped below 4°C. Run on Seoul station data for 1981–2010, that gave an average of 10 November. The normal date for Seoul published by the KMA and private forecasters is the end of November. That was more than two weeks early.
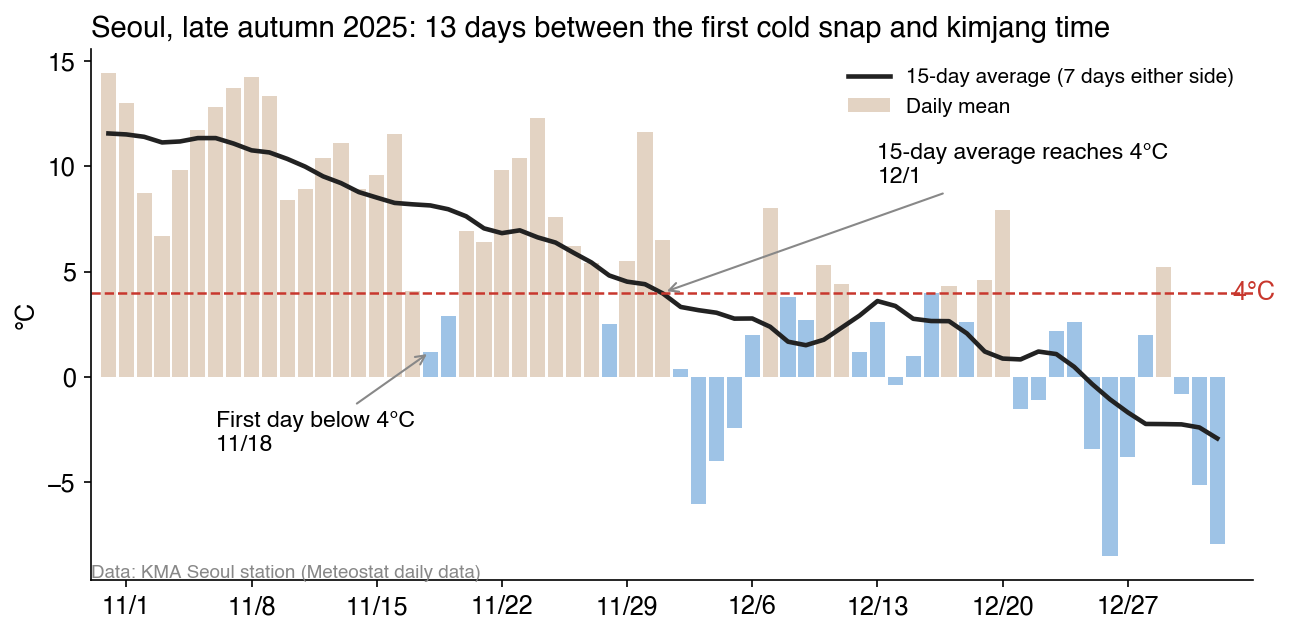
One chart explains why. In late autumn it is common for cold air to come down for a day or two and then pull back. In 2025 Seoul first went below 4°C on 18 November, but the following ten days and more averaged 5–12°C. Kimchi made then would spend those warm days fermenting fast. The word "stays" is in the rule precisely to filter out cold snaps like that.
So I changed the calculation:
- Normal date: average the temperature for each calendar day over 30 years, then smooth that curve with a 15-day moving average (7 days either side). The normal date is the first day on which the smoothed mean is at or below 4°C and the smoothed minimum at or below 0°C.
- Date for an individual year (for the trend): the first day the year's 15-day moving average of the daily mean is at or below 4°C.
With this, Seoul station gives a normal date of 28 November for 1981–2010. Weatheri's 2019 post gives 29 November for Seoul over the same period: one day apart. Counting through Seoul's records from 1951 to 2025, the first day below 4°C came on average 14 days earlier than the date picked by the 15-day average.
Which temperature data I used
Two kinds:
- Station temperatures: daily mean and minimum temperatures from KMA surface stations. I downloaded them from Meteostat's bulk daily data, which collects observations from many countries and can be fetched without a key. Seoul (Songwol-dong) runs continuously from December 1950.
- Reanalysis temperatures (ERA5): temperatures recomputed for the whole globe on a grid of roughly 25 km by the European Centre for Medium-Range Weather Forecasts (ECMWF), blending observations with a forecast model. I took 31 points from September 1990 to 31 October 2026 through Open-Meteo's historical data service.
Station data are the real temperatures, but they had many holes. For KMA stations such as Daegu, Gwangju, Jeonju and Cheongju, the bundle had no daily data at all, or only one year from 2021–2022. I filled those with airport and air-force weather station records from the same cities (Daegu Airport, Cheongju Airport, Gunsan Airport, Gimhae Airport, Osan, Pyeongtaek, Gimpo Airport, Incheon Airport). Places still uncovered (Gwangju, Jeonju, Wonju, Andong, Jinju and others) use the reanalysis grid value and are marked differently on the map.
The period is 1991–2020, the same as the climate normals the KMA uses now.
Normal kimjang dates by region
Here are the normal dates calculated from station data:
| Point | Normal date | Mean ≤ 4°C | Minimum ≤ 0°C |
|---|---|---|---|
| Chuncheon | 19 Nov | 19 Nov | 15 Nov |
| Gimpo Airport | 25 Nov | 25 Nov | 21 Nov |
| Cheongju Airport | 25 Nov | 25 Nov | 18 Nov |
| Osan | 26 Nov | 26 Nov | 21 Nov |
| Seoul | 28 Nov | 28 Nov | 27 Nov |
| Daejeon | 29 Nov | 29 Nov | 24 Nov |
| Incheon | 30 Nov | 30 Nov | 30 Nov |
| Daegu Airport | 5 Dec | 5 Dec | 2 Dec |
| Gunsan Airport | 7 Dec | 6 Dec | 7 Dec |
| Gangneung | 9 Dec | 9 Dec | 8 Dec |
| Pohang | 19 Dec | 19 Dec | 9 Dec |
| Gimhae Airport | 19 Dec | 19 Dec | 10 Dec |
| Mokpo | 20 Dec | 18 Dec | 20 Dec |
| Yeosu | 31 Dec | 28 Dec | 31 Dec |
| Busan | 2 Jan | 2 Jan | 28 Dec |
| Ulleung | 6 Jan | 18 Dec | 6 Jan |
| Jeju | Never reached | — | — |
The central inland comes in late November, the southern inland and the west and east coasts in early to mid December, and the south coast from late December into early January. That is almost the same three-way split as the KMA's 2010 press release. On Jeju, the 30-year average curve never drops to a mean of 4°C even in midwinter, so this rule gives no date at all.
At most points the 4°C mean arrives later, so that sets the date. At coastal points such as Mokpo, Yeosu and Ulleung it is the other way round: the 0°C minimum comes later, because the sea keeps the land warm at night.
How much later in 70 years?
People say "kimjang gets later every year". I checked it in numbers. Seoul station has data from 1951, so I could recompute the normal date for 30-year windows, sliding ten years at a time.
| 30-year window | Seoul normal date |
|---|---|
| 1951–1980 | 26 Nov |
| 1961–1990 | 25 Nov |
| 1971–2000 | 25 Nov |
| 1981–2010 | 28 Nov |
| 1991–2020 | 28 Nov |
| 1996–2025 | 29 Nov |
The latest 30 years are three days later than 1951–1980. Comparing 1971–2000 with 1996–2025 the same way, Daejeon moved 5 days later, Incheon 4 days and Chuncheon 1 day. Coastal points such as Mokpo, Ulleung and Gangneung stayed within 0–1 day.
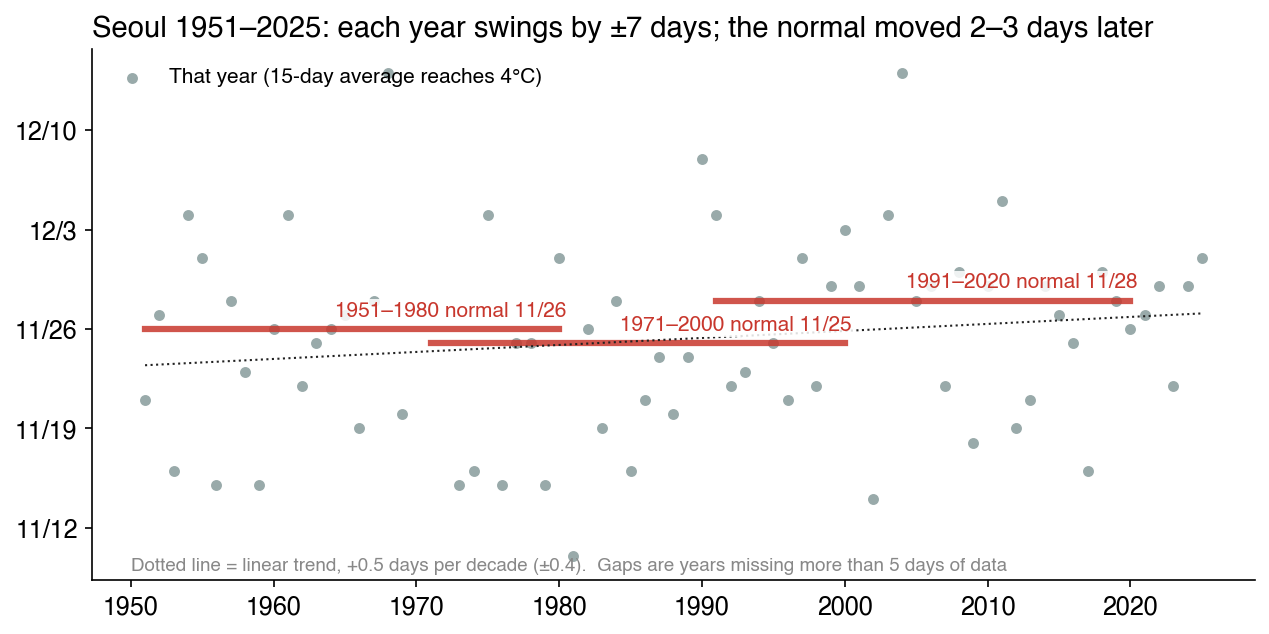
Plotting individual years changes the picture a little, though. Seoul's date swings from year to year with a standard deviation of about 7 days. The earliest year was 1981 (10 November), the latest 1968 (14 December). A straight line through all of 1951–2025 gives a trend of 0.5 days (±0.4) later per decade. Take only the latest 30 years (1996–2025) and it is −0.4 days (±1.3) per decade: you cannot say it got later or earlier. Running the same calculation on the 31 reanalysis points, the median trend over the latest 30 years was −0.15 days per decade.
Weatheri's 2019 post says Seoul's date moved about four days later, from 25 November in 1920–1950 to 29 November in 1981–2010. Over the long run my numbers point the same way. But it is not the same as the feeling that "it's been getting later every year lately". What moved later is 2–4 days spread over decades. The difference between one year and the next is much bigger. So this year's date can't be set from the normal alone.
What about this year?
There are two clues for this year.
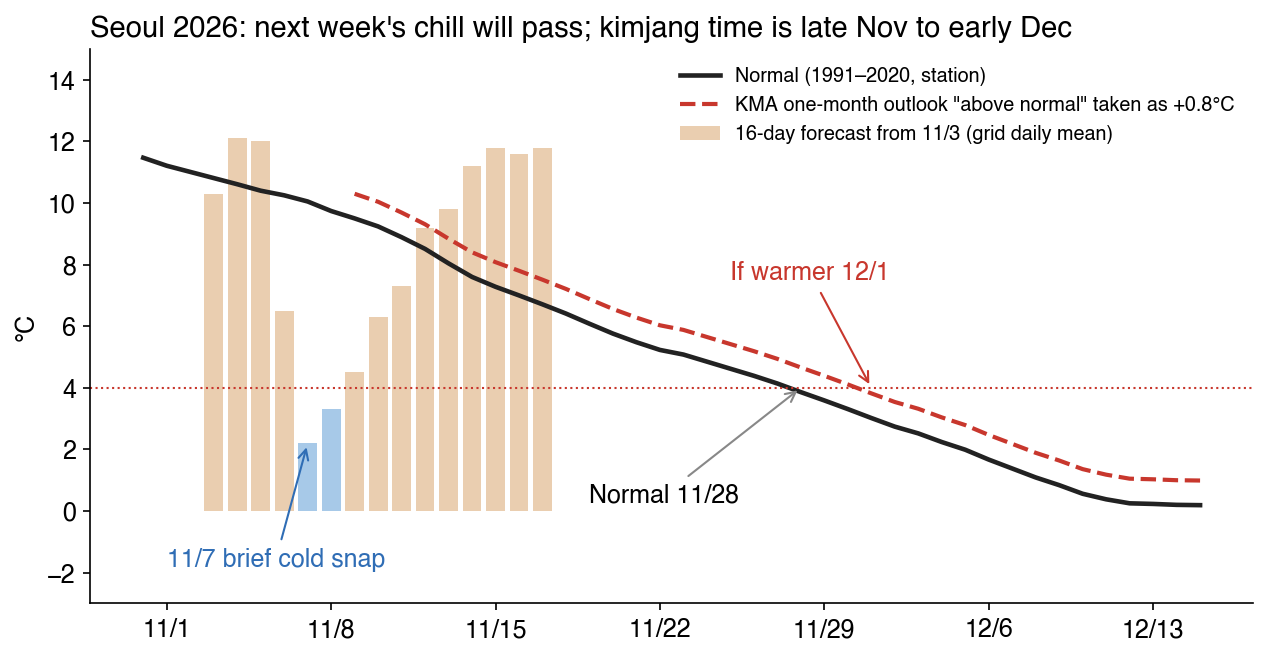
1. The 16-day forecast. In the forecast I downloaded on the morning of 3 November (Open-Meteo's default forecast, which was almost identical to the ECMWF model run alone), the daily mean drops below 4°C across most of central Korea on 7–9 November. The Seoul grid point falls to 2.2°C on 7 November. But three days later it climbs again, averaging 10.4°C over 11–17 November, higher than Seoul station's normal for that week (7–9°C). That is the "first cold snap" from earlier, exactly. Salting cabbage for this weekend's chill would be too early.
2. The KMA one-month outlook. The outlook issued on 29 October (covering 9 November to 6 December) says the average temperature will be "above normal" in all four weeks, with probabilities of 50%, 50%, 60% and 50%. "Above normal" means the top third of the 30 years from 1991 to 2020. The normal range for week three (23–29 November) is 4.4–6.0°C and for week four (30 November–6 December) 2.2–4.0°C, so the threshold for "above" sits about 0.8–0.9°C over the normal mean.
So I raised the normal curve with a scenario of "0.8°C warmer than normal from 9 November" and recalculated.
| Point | Normal | This year (0.8°C warmer) |
|---|---|---|
| Chuncheon | 19 Nov | 22 Nov |
| Seoul | 28 Nov | 1 Dec |
| Daejeon | 29 Nov | 2 Dec |
| Incheon | 30 Nov | 3 Dec |
| Daegu Airport | 5 Dec | 8 Dec |
| Gangneung | 9 Dec | 15 Dec |
| Pohang | 19 Dec | 28 Dec |
| Mokpo | 20 Dec | 29 Dec |
| Busan | 2 Jan | Not reached all winter |
In the central inland, 0.8°C turns into about three days, because at that time of year the normal curve falls 0.2–0.3°C a day. On the coast the curve is flatter, so the same 0.8°C becomes 6–9 days. Where the curve hovers around the threshold, as in Busan, even a little warmth means the rule is never met all winter. In places like that it is more realistic to pick the coldest ten days of the year than to hit a date.
Don't read this table as a forecast. It is a scenario that turns the KMA outlook into a single number, and nobody knows December's weather yet. The two clues agree only this far: this year it is safer to aim a few days later than normal.
Try it
Click a point on the map to see its normal date, the date for each threshold, this year's scenario and the brief cold snap in the current forecast. Solid dots are stations; dashed rings are places with no station, calculated from the reanalysis grid. In the "Seasoning" tab, enter a number of cabbages or a weight of salted cabbage to get amounts for the seasoning paste.
The calculator's ratios come from "Making napa cabbage kimchi" on Nongsaro, the Rural Development Administration's farming portal (produced with the National Institute of Agricultural Sciences). By weight of salted cabbage they are: chilli flakes 4.5%, garlic 2.0%, ginger 1.0%, salted seafood (jeotgal) 5.0%, sesame 0.5%, sugar 0.5% and glutinous rice paste 8.5%. Other fillings such as julienned radish, small green onions and water dropwort come to about 20% of the cabbage. For 5 kg of salted cabbage that is 220 g of chilli, 100 g of garlic, 50 g of ginger and 250 g of salted seafood.
I could not find an official figure for how much one head of cabbage weighs after salting. Heads vary in size, so the calculator uses 2 kg as a default assumption that you can change. Weighing it yourself is the most accurate. Why the seasoning is balanced this way is covered separately in A A Page for Today No. 21, Seven Syllables for Balancing Flavor.
Where it went wrong
A date from a single day's temperature. This is the first mistake, described above. Translating the rule into code word for word gave Seoul an average date of 10 November for 1981–2010, more than two weeks off the known value. Following up on why it was early showed it was catching a single day of the first cold snap. Only after "stays" became a 15-day moving average did 28 November come out. The least noticeable verb in the rule moved the date by more than two weeks.
Reanalysis erases the city. At first I calculated all 31 points from ERA5 reanalysis. It is the same gridded dataset everywhere, which makes points easy to compare, and it has no missing days. The result put Seoul's normal date at 21 November, a week earlier than the 28 November from station data.
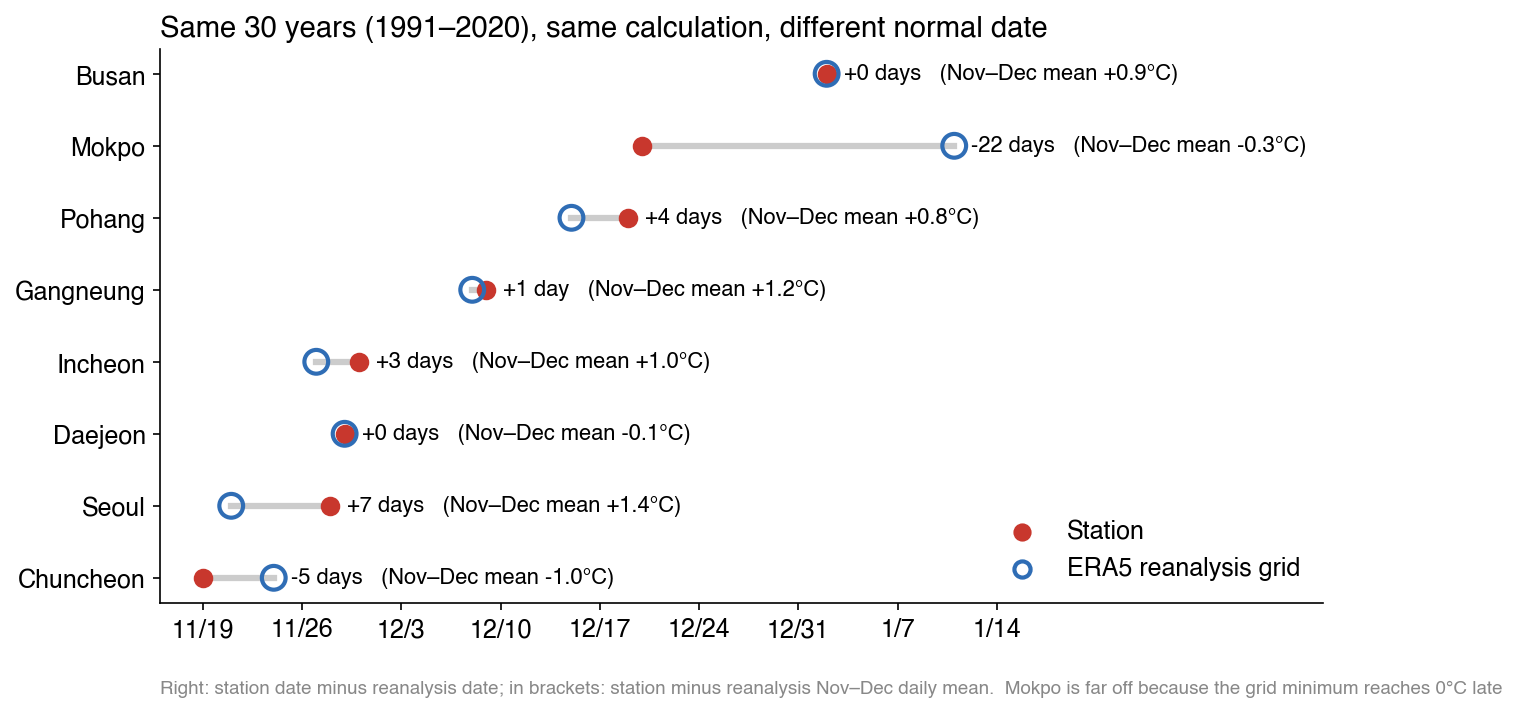
Same 1991–2020 period, same calculation, different answer. Comparing November–December daily means directly, Seoul station was 1.4°C warmer than the reanalysis. One 25 km grid cell mixes the city center, the slopes of Bukhansan and the Han River, and the heat of the downtown area where the Songwol-dong station stands disappears into that average. The same thing happened to temperature as in episode 1, the fireworks map, where a global elevation dataset erased the buildings. In the other direction, Chuncheon sits in a basin; its station was 1.0°C colder, so the reanalysis came out 5 days later.
Mokpo was off by 22 days. The mean temperature differed by only 0.3°C, but the grid's minimum temperature reached 0°C much later. It looks as if a grid cell that takes in a lot of sea kept night temperatures high. At the eight stations, the reanalysis differed by −5 to +7 days, with Mokpo alone at −22.
I switched the map to stations by default. Reanalysis is used only where there is no station, drawn as a dashed ring with a note that it may be off by about a week.
Stations with nothing in them. Once I switched to stations, data ran short. For KMA stations in Daegu, Gwangju, Jeonju and Cheongju, the bundle had no daily data or only one year. I filled them with airport and air-force station records, but not all of those could be trusted either. Yanggu station gave a January mean of 0.4°C, warmer than Chuncheon (−4.4°C), which is further south. Compared day by day, its November–December mean was 4.2°C above Chuncheon's. It looked like data missing its night-time readings, so I dropped it. I didn't confirm the cause; I dropped it because the number made no sense.
Even at KMA stations, 30–47% of daily minimums between November and early January were missing. The 30-year average curve barely moves when missing days are left out. But when counting dates year by year the minimums were hard to trust, so the trend calculation uses only the daily mean.
Removing nearby points removed a mountain. Station dots and reanalysis dots were overlapping on the map, so I had reanalysis points within 25 km of a station removed. Daegwallyeong disappeared, because it is 17 km from Gangneung station. Daegwallyeong is 767 m above sea level; its normal date (reanalysis) is 14 November, almost a month before Gangneung (9 December). Lumping them together by distance alone was a mistake, so Daegwallyeong was kept as an exception.
Trying to carry the forecast anomaly forward. At first I measured how much warmer than normal the 16-day forecast was and tried to raise the normal curve by that anomaly. To remove the grid differences between the forecast model and the reanalysis, I also corrected for bias using the previous 31 days. But the minimum-temperature anomaly at south-coast points came out around −3°C, and there had been no such cold in that period. It seems the two datasets draw coastal grid cells differently. On top of that, forecasting late November from an early-November anomaly was a stretch to begin with. I dropped the approach and turned the KMA outlook's "above normal" into a +0.8°C scenario instead. It is less sophisticated, but it is clear what it assumes.
The data service's limit. To compare with 1920–1950, I tried to download Seoul reanalysis data again starting from 1941, and hit the free Open-Meteo service's hourly request limit (429). Before 1940 there is no reanalysis anyway. The long-range comparison uses only Seoul station data from 1951, and the 1920–1950 figure stops at quoting Weatheri's post.
Why this works in one click
The kimjang date is a problem that already has a definition. There is a written rule, 30 years of daily temperatures are public, and an organization's result for the same calculation (Seoul, 29 November) is on record. With an answer to check against, a wrong calculation shows up at once. Here too, when the first run said 10 November, it was obvious on the spot that something was off.
The data were the trickier part. Which dataset erases the city, which station skips the night, which grid cell swallows the sea: you only see these by running and comparing. The agent ran comparisons fast and many times, and I picked out the numbers that made no sense.
If you want to try
- Don't translate the rule as written; have the agent find the primary source first. A word like "stays" changes how you compute it.
- Pick one known value as your benchmark. Here it was "Seoul, 1981–2010, 29 November".
- Download gridded and station data together and compare them at the same points. Once you know how many days apart they are, you can decide how far to trust places that only have the grid.
- For this year's estimate, write down what you assumed as a number, such as "if it is 0.8°C warmer than normal".
What this cannot do
- It is not a forecast. This year's dates are a scenario turning the KMA one-month outlook into +0.8°C. If December differs from the outlook, the dates change too. They may change after publication as new forecasts and outlooks come out.
- It is not the temperature in your back yard. There is one station per city, and the reanalysis is a 25 km grid. Within one city, a hillside and a riverbank can differ by days.
- Temperature alone doesn't decide how kimchi tastes. The cabbage harvest and price, how well it is salted, and where it is stored (a kimchi refrigerator or a jar buried in the ground) matter as much as the temperature. If you store it in a kimchi fridge, the outdoor temperature means much less.
- The rule doesn't fit Jeju or parts of the south coast. These places never reach the thresholds on the 30-year average, or only just, so picking the coldest stretch of the year works better than chasing a date.
- The weight per head is an assumption. The calculator's "2 kg per head" is not a sourced standard value.
Sources
- KMA press release, "Kimjang timing forecast for 2010" (Korean), 2010-11-12. https://www.kma.go.kr/kma/flexer/html/press2/2010/11/12/ATC201011121007051_159f4576-cd97-491f-b8f7-10318deb0e9c.hwp.files/Sections1.html
- KMA press release on handing seasonal information (blossom, foliage, kimjang timing) to the private sector (Korean), 2016-02-11. https://www.kma.go.kr/kma/flexer/html/press/2016/02/11/ATC201602111019131_eab6c714-482c-4e54-810c-1727b7b8b5cb.hwp.files/Sections1.html
- Weatheri, "Kimjang timing 2019" (Korean), 2019-11-05. https://www.weatheri.co.kr/board/board03_read.php?id=293
- KMA one-month outlook (9 November–6 December 2026), issued 2026-10-29 (Korean). https://www.weather.go.kr/w/repositary/xml/fct/mon/fct_mon1_108_20261029.pdf
- Rural Development Administration, Nongsaro, "Making napa cabbage kimchi" (with the National Institute of Agricultural Sciences, 2001; Korean). https://www.nongsaro.go.kr/portal/ps/psb/psby/vodPlay.ps?mvpNo=17
- Daily station temperatures: Meteostat bulk data (a public bundle of KMA, airport and air-force observations). https://dev.meteostat.net/bulk/
- Reanalysis temperatures: Hersbach et al., ERA5 (ECMWF/Copernicus), via the Open-Meteo Historical Weather API. https://open-meteo.com/en/docs/historical-weather-api
- 16-day forecast: Open-Meteo Forecast API (best_match), downloaded 2026-11-03. https://open-meteo.com/en/docs
- Base map: Esri World Topo Map.