Can Satellites Find Landmines? — On Armed Forces Day, Mapping Border-Area Mines with Free Satellite and Terrain Data
On Armed Forces Day, I tried to use free satellite imagery to map where landmines might be buried or might have washed downstream. The AI's first answer was "not as it stands." I changed course, mapping the southern riverbanks of rivers flowing down from the North and changes in the land north of the demarcation line separately — and end with the fact that the mines themselves never became visible.
Today is Armed Forces Day. Ten days ago, on September 21, three of our soldiers were injured when they stepped on landmines while clearing a search path inside the Demilitarized Zone in Yeoncheon, Gyeonggi Province. The spot was about 10 meters south of the Military Demarcation Line. A week later, the Joint Chiefs of Staff announced that the mines were very likely North Korean, and the United Nations Command judged it a violation of the Armistice Agreement.
Watching the news, I got curious. Since the spring of 2024, there have been a string of reports that North Korea is building walls, bulldozing land, and laying mines along the demarcation line. Outlets like 38 North have tracked this using commercial satellite imagery. So how much could be seen using free satellite imagery that anyone can access? And where exactly should people be careful about the mines that reportedly wash down from the North every summer?
What I Set Out to Do
What I set out to do was simple: combine recent defense news, analyses like those from 38 North, and freely available satellite imagery to map out places where mines might be buried and places they might wash downstream.
This time, the AI didn't just build it right away. Its first answer was, "Not as it stands." There were two reasons.
- Free satellite imagery can't show mines. Freely available satellite imagery has a resolution of 10–30 m per pixel. At that resolution you can't see a mine, let alone the person burying it. The imagery 38 North uses is paid imagery with a resolution of tens of centimeters per pixel. A map claiming "AI found mine-risk areas from satellites" would be an exaggeration.
- South Korean minefields should not be mapped precisely. Piecing together our military facilities from public data into a map is something that requires legal caution. On top of that, some people will read an unmarked area as safe. In a mine map, that is the most dangerous misreading of all.
Instead, it suggested redirecting the approach like this:
- For the North, look only at traces of changed land. Even if the mines themselves aren't visible, places where trees were cut and land was bulldozed can show up even at 10 m resolution.
- For the South, shade the riverbanks broadly. Along rivers flowing down from the North, mark the floodplain the water reaches during floods only at the level of "be careful around here." Use only reported locations for actual discovery sites.
- Treat what can't be done as part of the conclusion.
I decided to go with that approach.
What Came Out of It
The map carries two things.
First, riverbanks where stray mines warrant caution. I pulled out, from public map data, the rivers that cross the Military Demarcation Line from north to south: eight in all — the Imjin, Sami, Yeokgok, Hantan, Hwa, Geumseong, Bukhan, and Inbuk rivers. I measured distance along the watercourse starting from where each river crosses the demarcation line. I shaded only land within 500 m of the river centerline that is no more than 5 m above the water level — the kind of riverbank that would be submerged when the water rises.
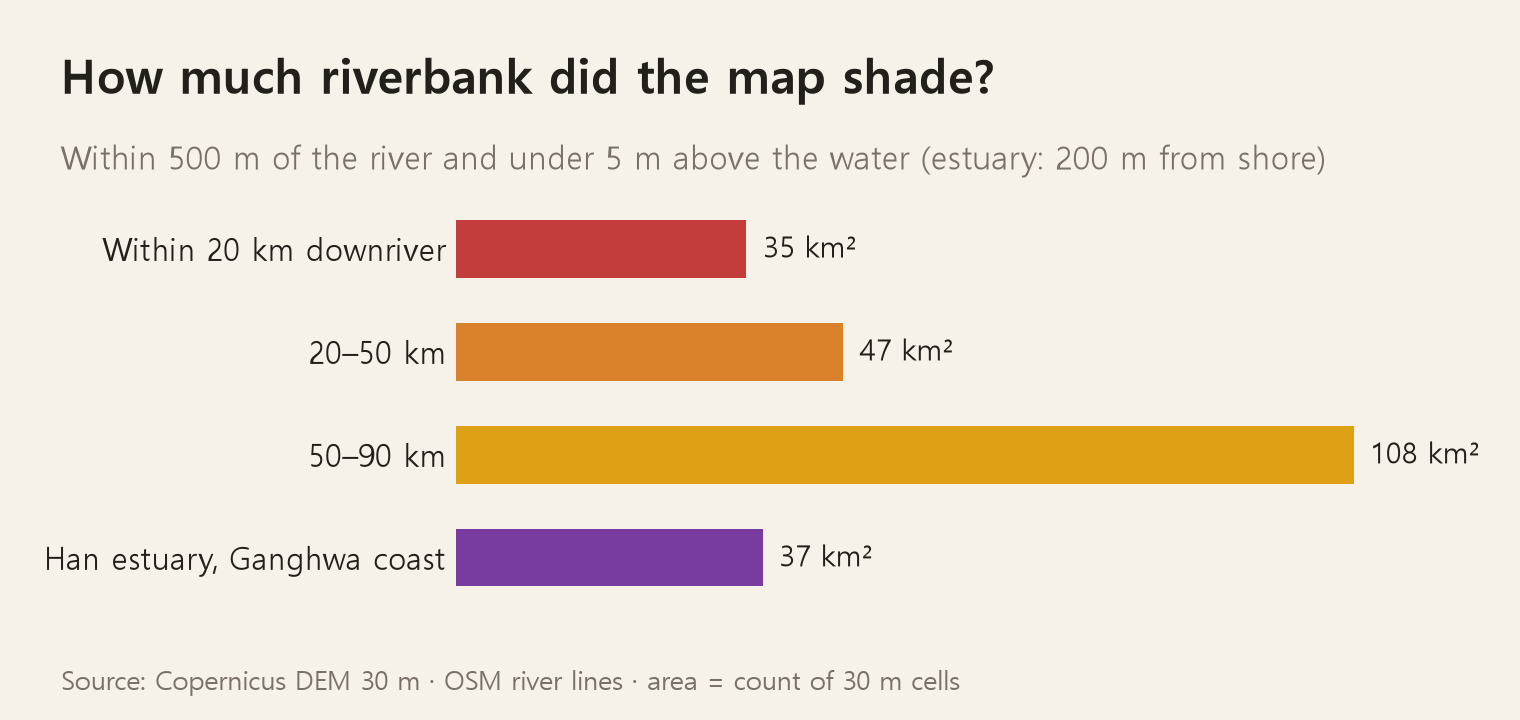
The total shaded area comes to about 227 km². Within 20 km of the demarcation line along the watercourse it's 35 km², 20–50 km is 47 km², and 50–90 km is 108 km². The Han River estuary and Ganghwa coast account for 37 km².
Second, the sites where mines were actually found. I plotted 14 reported discovery sites at the village or island level. Placing these points against the watercourse distances above, they split into two clusters.
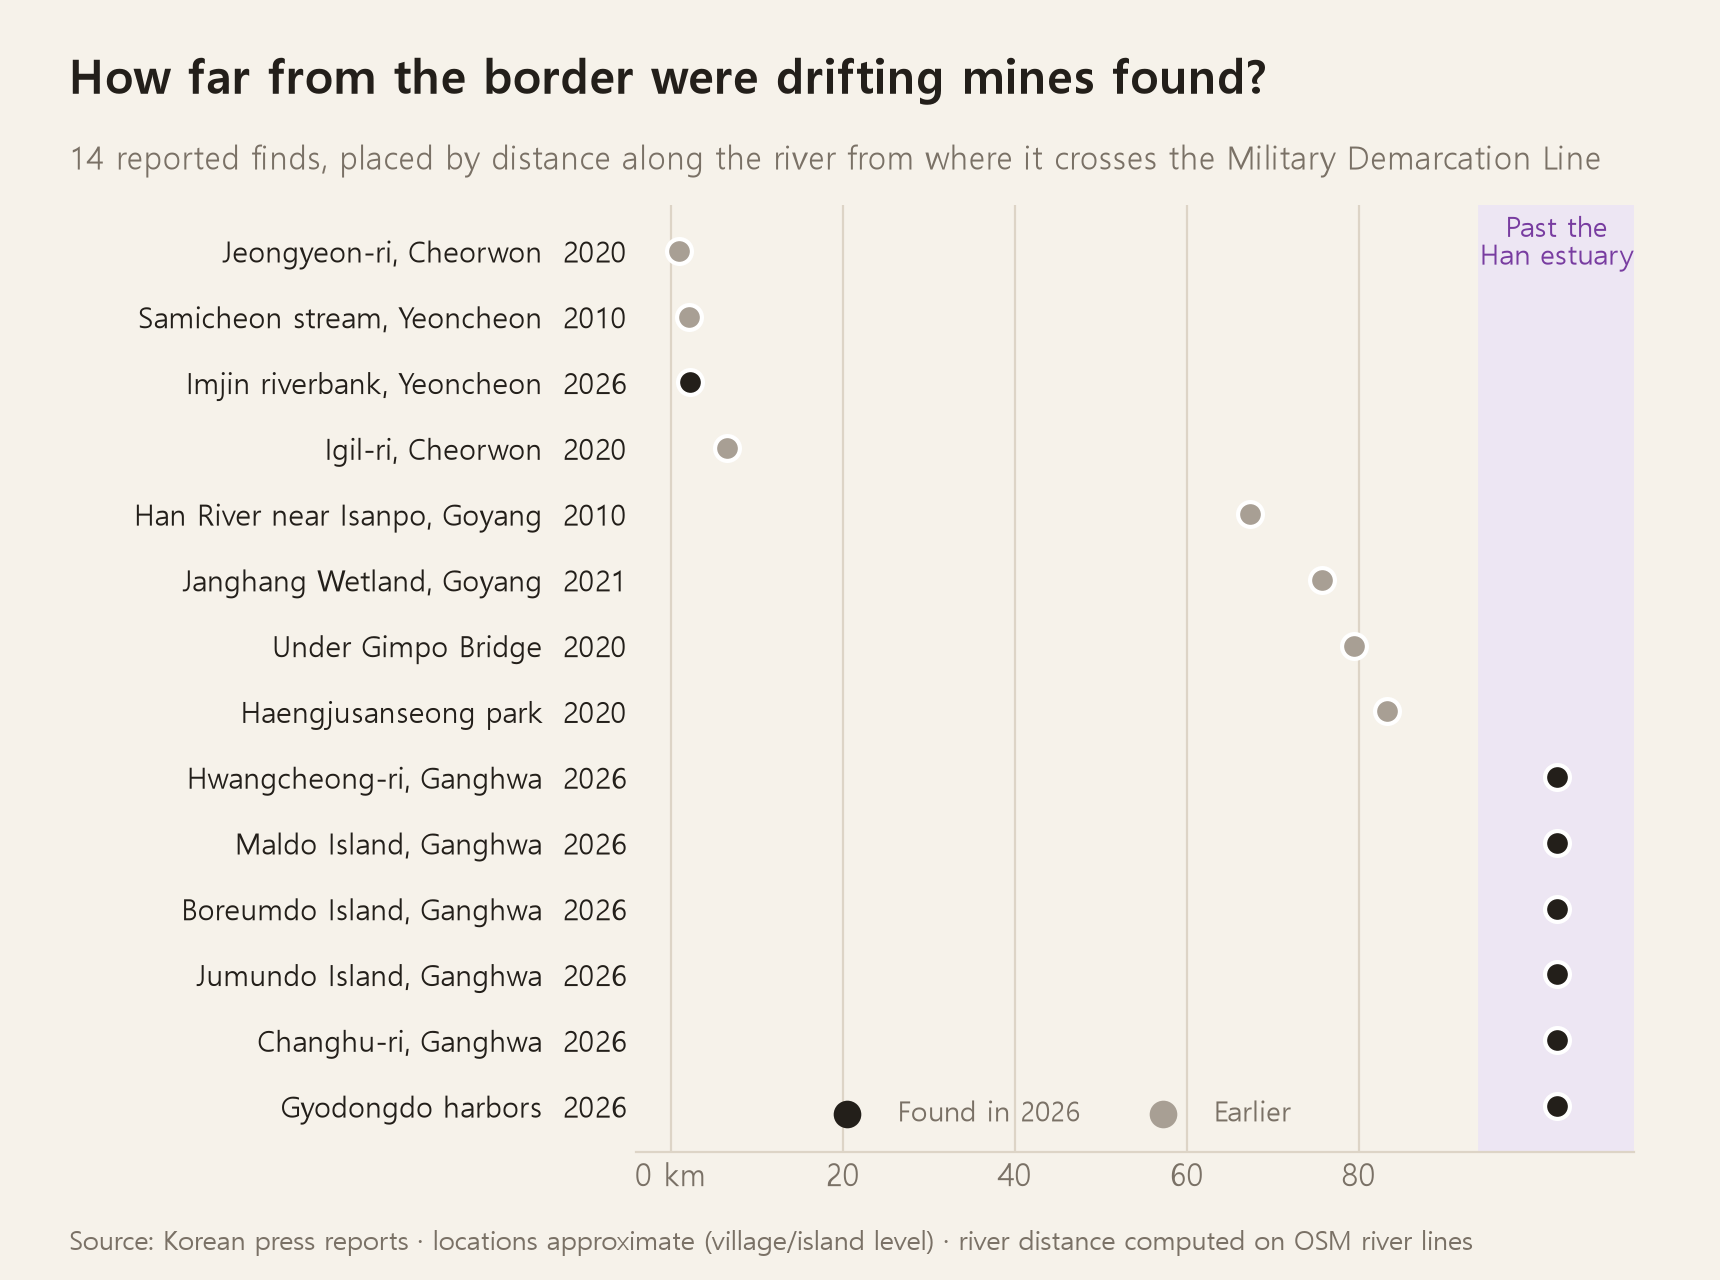
One cluster is less than 10 km from the demarcation line along the watercourse. In 2010, a person fishing on the Sami River in Yeoncheon picked up a wooden-box mine, and one person died. After heavy rain in the summer of 2020, mines surfaced all over the Igil-ri and Jeongyeon-ri area of Cheorwon. This past August, a visitor reported what appeared to be an antipersonnel mine along the Imjin riverbank in Baekhak-myeon, Yeoncheon.
The other cluster is 70–85 km downstream, in the lower Han River — Goyang's Janghang Wetland, under the Gimpo Bridge, and in front of Haengju Mountain Fortress. And farther still, past the Han River estuary, are Ganghwa's islands. This past summer alone, Ganghwa County found 12 wooden-box mines over two weeks, and the Marine Corps recovered 16 more along the coasts of Gyodong, Maldo, Jumundo, and Boreumdo.
In other words, mines are not dangerous only right at the demarcation line. Wooden-box mines float, and even after traveling all the way down a river and out to sea, they can ride the incoming tide onto island shores.
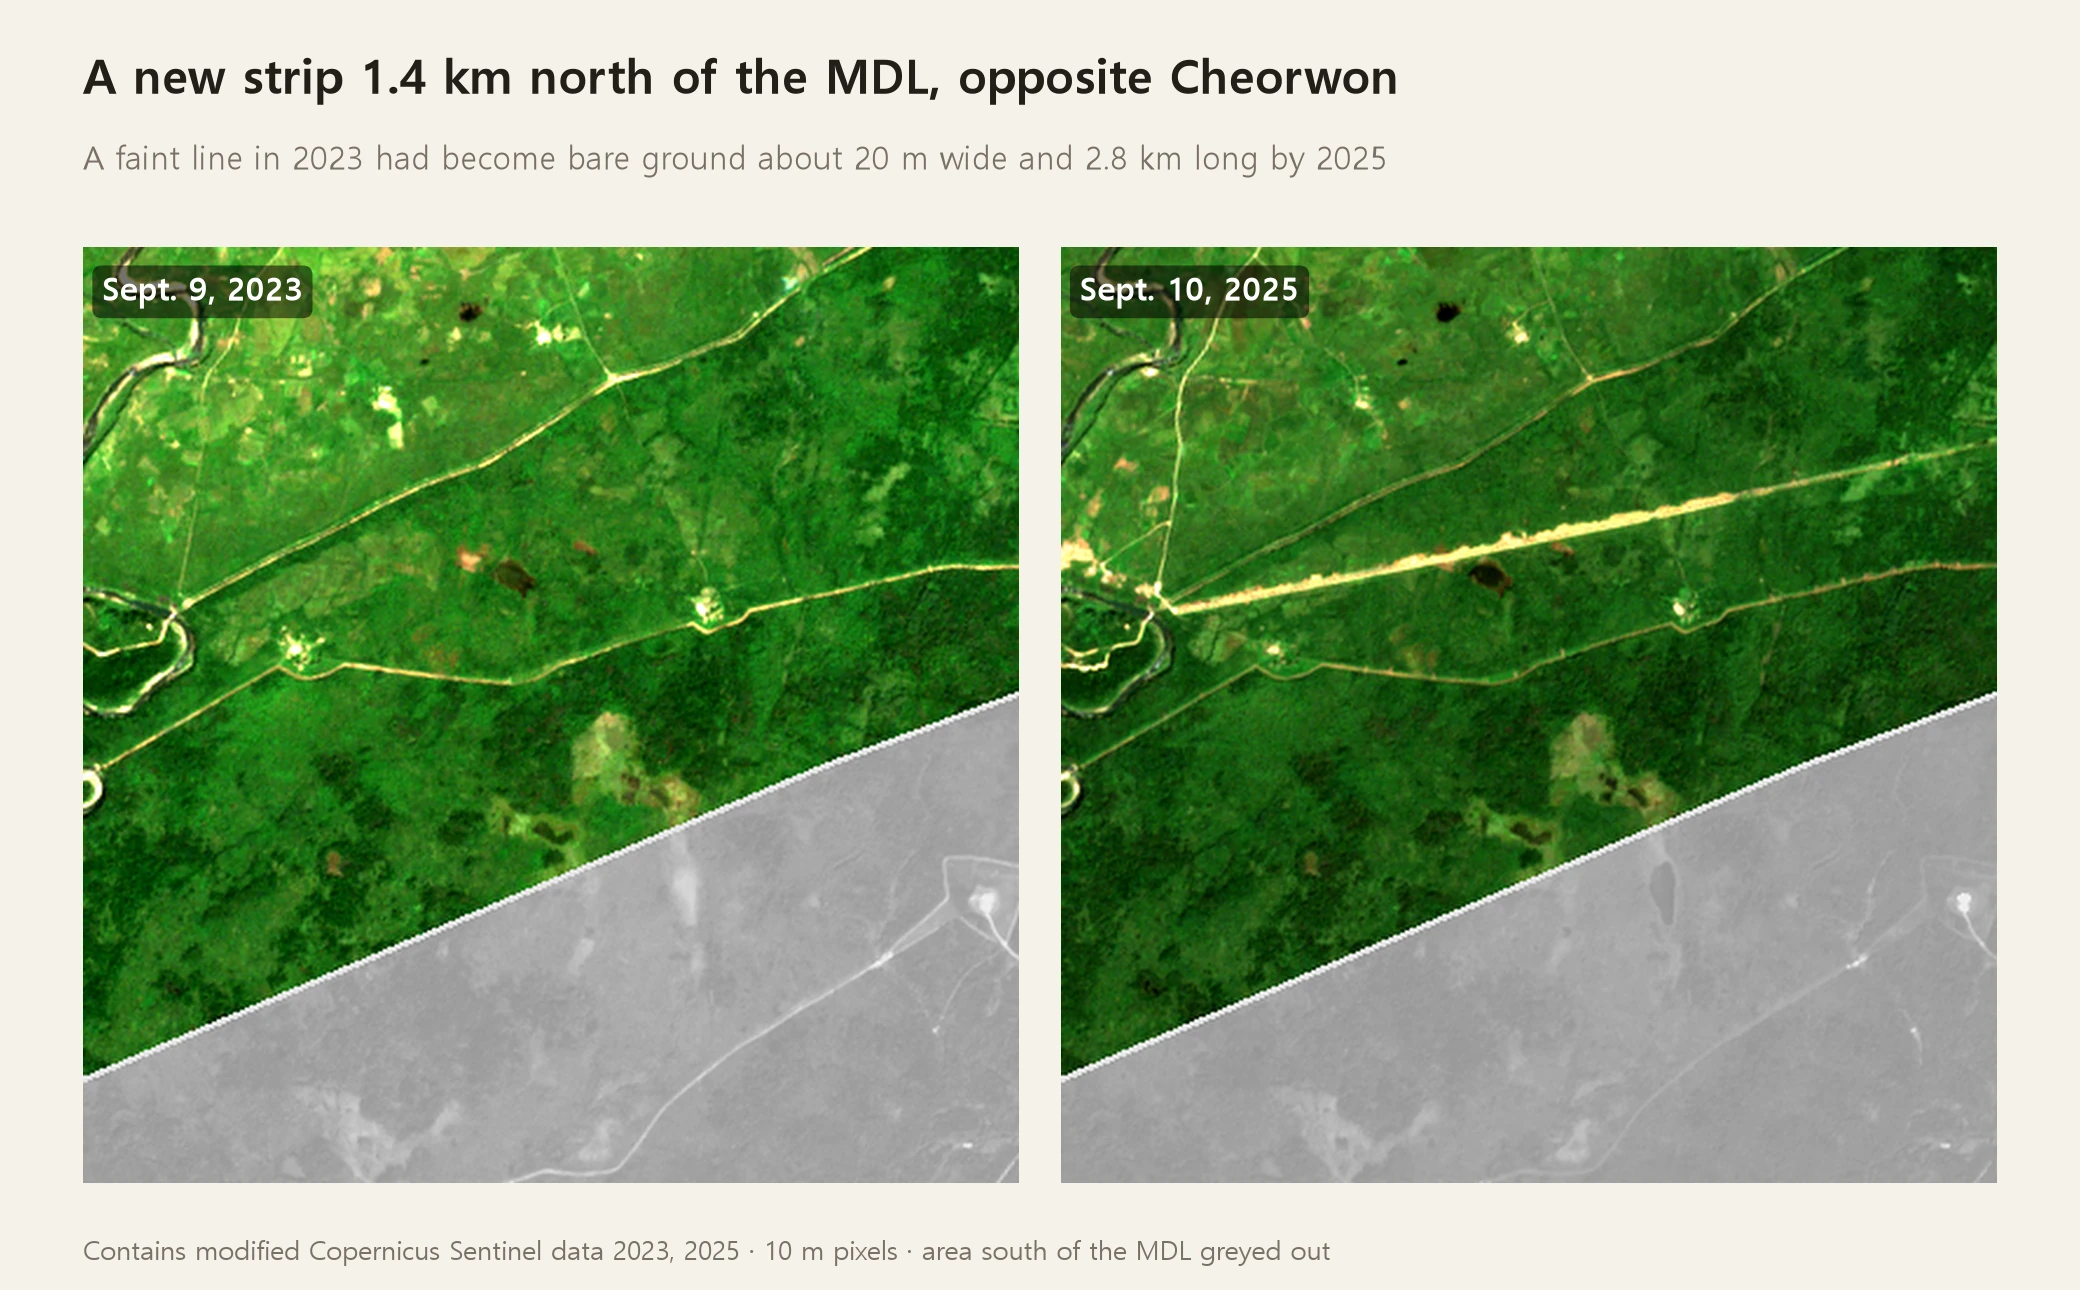
Third, newly bared strips of land north of the demarcation line. I overlaid hundreds of free satellite photos of the area within 4 km north of the demarcation line, one set for each summer of 2023, 2024, 2025, and 2026. I selected only the 10 m pixels that were green in 2023 but stayed bare ground throughout the summers of 2025 and 2026. Among those, I shaded in dark only the ones that formed narrow, elongated shapes. Zoomed out, these appear as teal dots; zoomed in, they appear as bands.
The largest one was located opposite Cheorwon — it's the photo at the top of this piece. A spot that was only a faint line in September 2023 had become a stretch of bare ground roughly 20 m wide and about 2.8 km long by September 2025, and it remains so in the 2026 photo. The location and length are similar to the "anti-tank wall about 2 km north of the demarcation line and about 2.5 km long, opposite Cheorwon" that was disclosed in the National Assembly last October. Still, I can't say it's the same feature — the wall is reportedly 2 m thick, while each pixel in this imagery is 10 m. All this photo can tell us is that "the soil at that spot has been exposed."
On the eastern front, a new winding path cutting through the forest toward the demarcation line became visible.
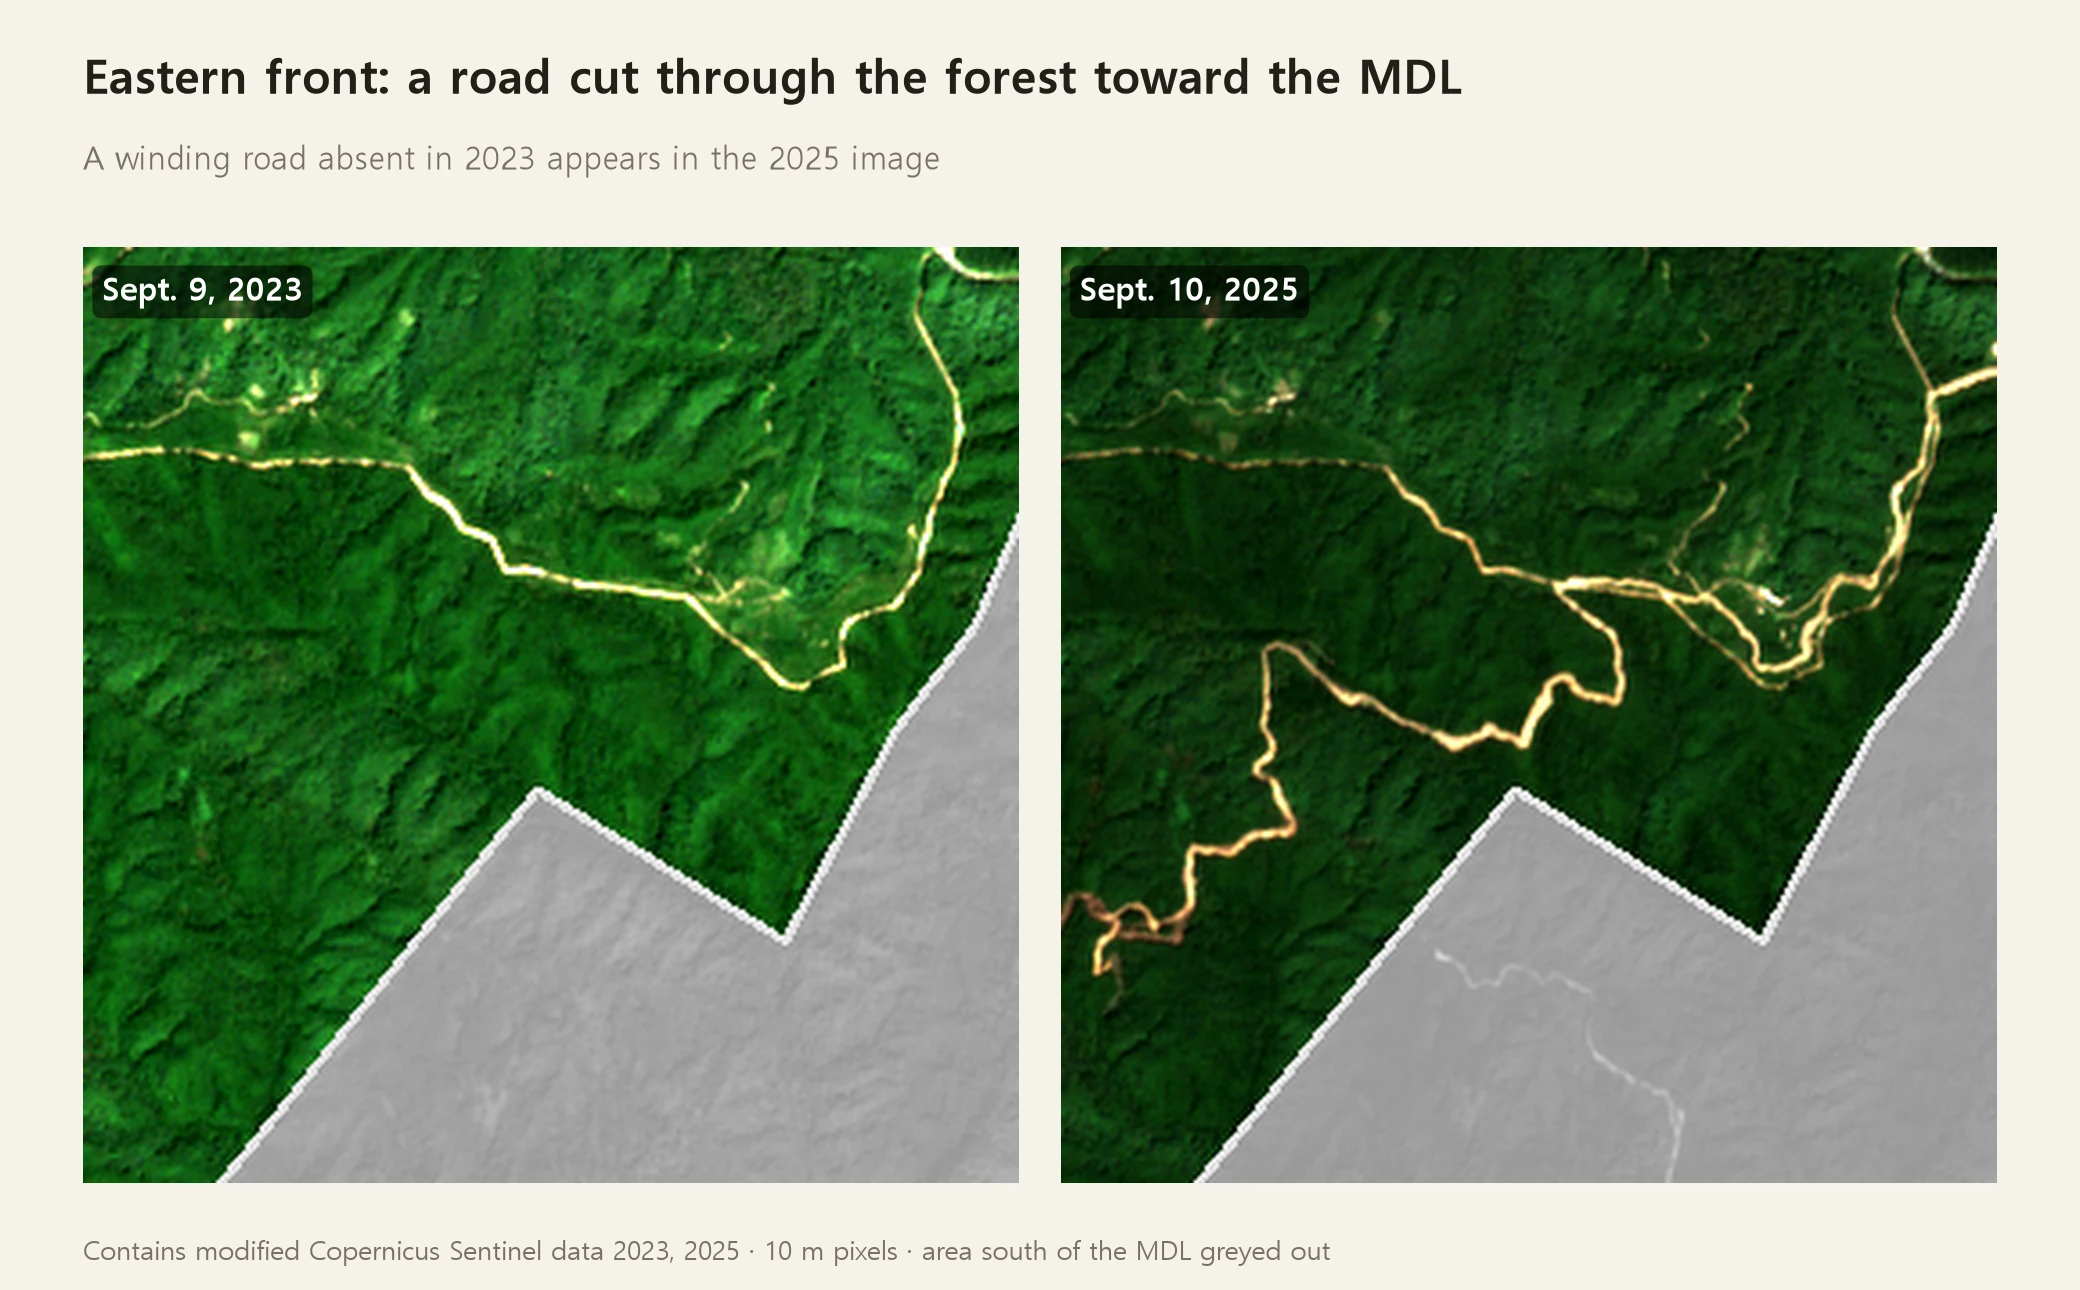
In total, 28 such narrow, elongated strips of bare ground were identified, adding up to 16.8 km in length: 14 strips totaling 7.3 km in the west, 7 strips totaling 6.2 km in the center, and 7 strips totaling 3.3 km in the east.
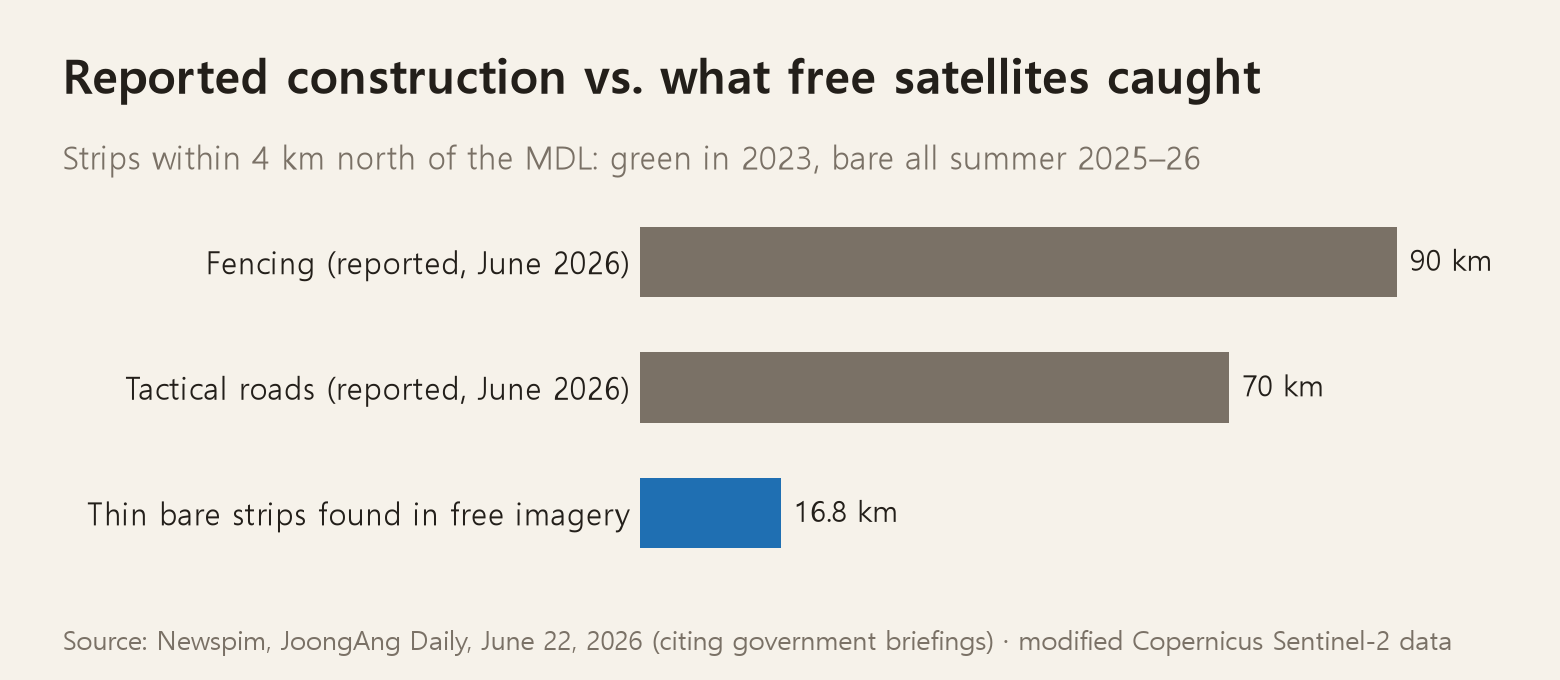
According to June reporting this year citing government explanations, North Korea has built about 90 km of fencing and about 70 km of tactical roads. What free satellite imagery captured is about a tenth of that. Places where an existing road was simply widened, places that were already grassland, and anything as thin as barbed wire don't show up with this method.
How It Went
From start to a draft of the map and the manuscript took about an hour and ten minutes. More than half of that was spent waiting for satellite imagery downloads and overlay calculations. The work session dropped once partway through, and I had to resume the calculations.
What I did by hand was setting the direction and, now and then, looking at an intermediate result and flagging "this looks off." Everything else went like this:
- Started by gathering news reports. I built a table, by date, location, and figures, of articles from 2024 through this September on North Korea's demarcation-line construction, mine accidents, and stray-mine discoveries. Whenever two or more sources disagreed, I had it noted as a discrepancy. For the September 21 accident, one source gave 18 injured while the Joint Chiefs of Staff announcement gave 3; I used 3.
- Obtained the demarcation line as a vector line. Public map data (OpenStreetMap) includes the Military Demarcation Line encoded as a border line. I used this line to divide north from south.
- Calculated the South from terrain data. Using the 30 m terrain data the European Space Agency releases for free, I measured, river by river, how much higher the land is than the water level. I measured distance along the watercourse starting from the point each river crosses the demarcation line.
- Stacked satellite imagery for the North. Europe's Sentinel-2 satellites photograph the same spot every five days. From more than 470 summer scenes across the four years, I removed clouds and shadows and took the median value for each pixel.
- Checked again with imagery. For the 15 largest sites filtered out numerically, I placed before-and-after photos from the same season side by side and checked them by eye.
Free satellite imagery captures the southern side of the line just as much as the northern side. In the photos and maps in this piece, everything south of the demarcation line has been redacted in gray. The only thing shaded on the southern side is the riverbanks.
Where I Got It Wrong
This is the real substance of this series. This time there were an unusually large number of places I got wrong.
First, the method I chose initially found nothing at all. At first I compared, year by year, how green the land stayed through the summer (a vegetation index). If land had been bulldozed, the area near the demarcation line should have dimmed year after year.
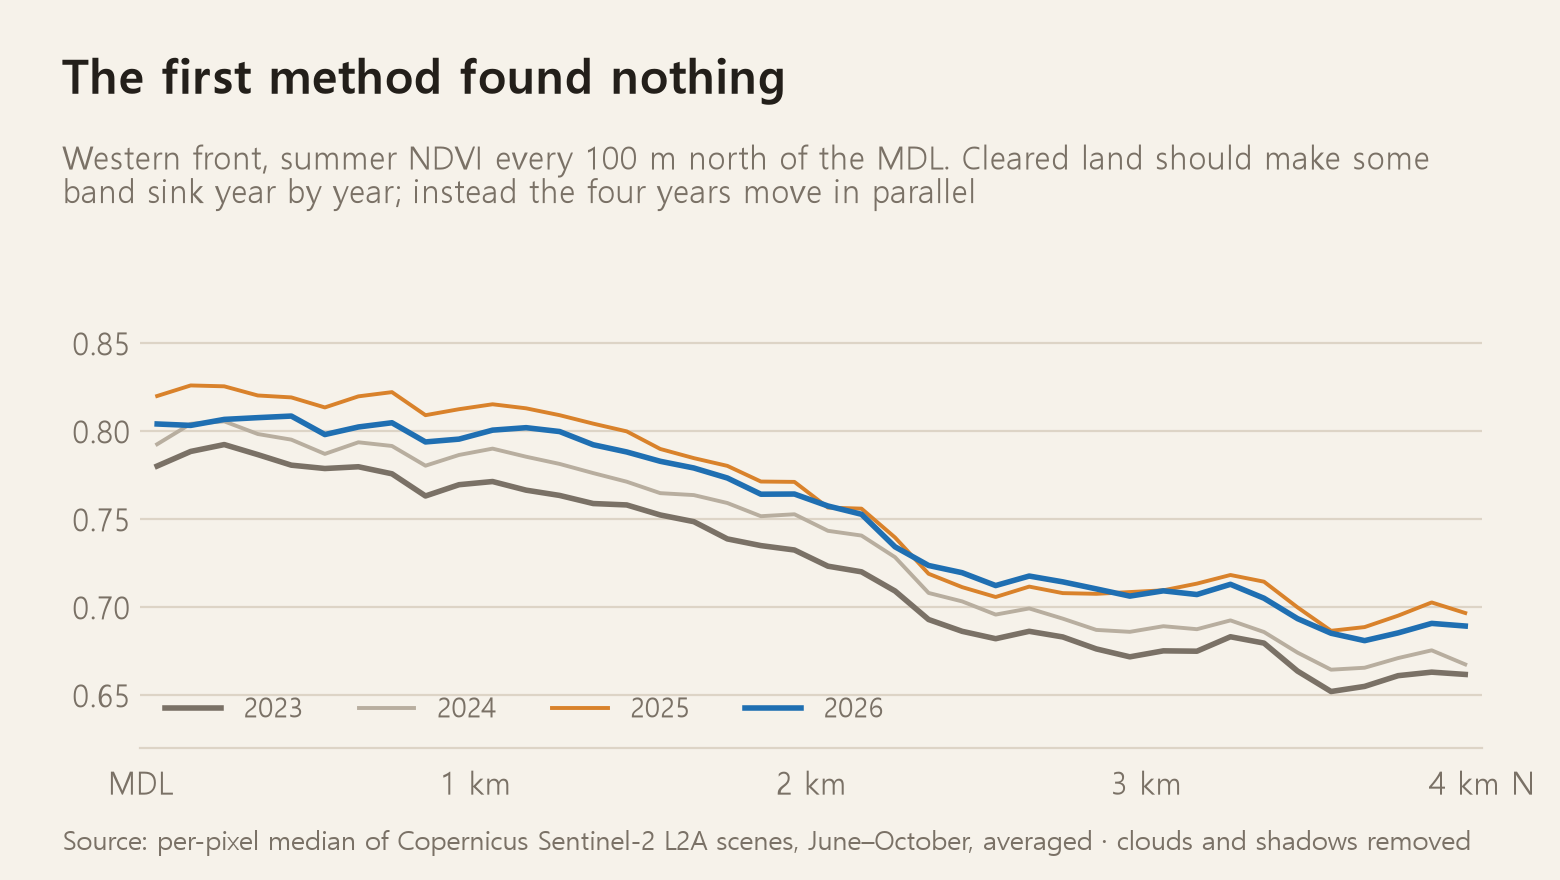
The four years' lines simply rose and fell together. If anything, 2025 was highest across every segment — it was just a year with a lot of rain. There were two reasons for this. Even land where trees had been cut shows up green again by summer once grass regrows. And the construction area itself is small: even a 160 km stretch of construction at 20 m wide comes to only 3 km², which is 0.4% of the 900 km² strip within 4 km north of the demarcation line. Averaging buries it completely.
I switched to a different index that distinguishes forest from grassland (a moisture index using near-infrared and short-wave infrared) and ran it again. That also just showed 2025 higher across the board and found nothing. So I abandoned averaging and turned to looking at pixels one at a time — selecting only pixels that were "green at midsummer in 2023 but still bare ground at midsummer in both 2025 and 2026." Only then did the Cheorwon strip emerge.
This past August, the Korea Research Institute of Standards and Science's Satellite Analysis Center announced, using the same free satellite (plus 3 m commercial imagery), that forest in the North's DMZ had shrunk by 25.1% between 2024 and 2025. My method could not confirm that figure, because summer photos alone can't distinguish forest that has turned into grassland.
Second, about half the newly bared land was actually farmland. Checking the 15 largest sites from the pixel-based results against photos, 6 looked like roads or construction, 8 were farmland and riverbanks, and 1 couldn't be judged because of cloud cover. In North Korean farmland near the estuary on the west coast, fields can turn to bare ground depending on what's planted each year. So I filtered by shape: construction is narrow and long, farmland is blocky. Filtering for "average width 25 m or less, length 300 m or more" kept all 6 construction sites and dropped 5 farmland sites. Two riverbank sites stayed in because they were narrow too. So even on the map, dark teal doesn't mean construction in every case.
Third, the coordinates gathered during research were wrong. While compiling the news reports, I had attached rough coordinates to each location, but of the 10 sites marked as North Korean construction sites, 7 landed south of the demarcation line. Pulling imagery for the coordinates labeled "wall opposite Jeokseong" produced a photo of a southern village and factory. So I decided not to plot North Korean construction locations as points on the map at all. The Ganghwa islands were also off by about 10 km from their initial coordinates. I re-searched by place name and corrected them to the village or island level, which also changed the watercourse distances for the discovery sites. The 2010 Sami River accident site initially came out at 8 km and was corrected to 2 km.
Fourth, I shaded the riverbanks too broadly. At first I shaded "land within 1.5 km of the river that is no more than 6 m above the water level," and that pulled in the entire Gimpo and Ilsan plains on the lower Han River. Just the stretch beyond 50 km came to 286 km². Mines turn up on riverbank sandbars and wetlands, not in new towns. I narrowed it to within 500 m and no more than 5 m above the water level.
Fifth, I overran the map's edge twice. The western edge of my first drawn extent was at 126.3° E, but Maldo, Boreumdo, and Jumundo — where mines turned up this summer — lie west of that. When I widened the extent, this time purple shading spilled across the water north of Gyodong Island onto the North Korean coast. The demarcation line ends at the Han River estuary, so there's no north-south dividing line in the sea to its west. I cut it once more, this time by latitude.
Sixth, I placed photos from different seasons side by side. The before-and-after photos I first pulled were from late October 2023 (autumn foliage) and September 2025 (midsummer green). Laid out this way, everything looks like it changed. I re-pulled both as early-September photos.
Seventh, the lines disappeared when zoomed out. A 30 m-wide riverbank becomes thinner than a point and disappears when the map is shrunk to show all of northern Gyeonggi. My first map capture was nearly empty. I changed it to show a version drawn thick in 240 m cells when zoomed out, and switch to the 30 m version when zoomed in.
Why This Took Just One Line
All the data is openly available for free, and its formats are standardized. European satellite imagery is published so that anyone can download just the tile they need, without logging in. Terrain data and map data are the same. If a person did this by hand, a whole day would go into finding the data, downloading it, and getting the formats to match. AI does that part almost instantly.
But in this installment, that's as far as the one-line part went. What made the result trustworthy was the seven times I caught something wrong along the way. More than half of those were things visible only by pulling up the image and looking — a photo that turned out to show a southern village, an empty map, photos from mismatched seasons.
If You Want to Try This Yourself
- It's fine to ask it to tell you why something won't work, first. This time, the AI volunteered the reasons the original plan wouldn't work, and that's what saved the result. If I had just said "do it anyway," I would have ended up with a map pretending to show mines.
- Don't trust coordinates — plot them and look. Seven out of 10 researched coordinates landed on the wrong side of the line. Plotting a point on a map takes one minute.
- Compare before-and-after shots from the same season. This is the most common illusion in satellite-image comparisons.
- If averaging shows nothing, drop down to the pixel level. Small changes get buried in an average.
What This Can't Do
- Mines themselves are not visible. Not a single mine was directly found on this map. A wooden-box mine is about the size of a palm, and the M14 antipersonnel mine is 5.5 cm in diameter. A single pixel of free satellite imagery is 10 m. Even the September 21 accident site was 10 m from a spot the Joint Chiefs of Staff had flagged a year earlier as showing "terrain change." What satellites can see stops at traces of exposed soil.
- An unmarked area doesn't mean it's safe. The color on the southern riverbanks is simply a tendency — "reported mines have turned up in places like this" — spread across the terrain. Mines can also turn up in tributaries, valleys, and rivers we weren't able to name. If you come across a suspicious wooden box or plastic object, don't touch it — report it to 112 or a nearby military unit.
- South Korean minefields were not addressed. The minefields our military has confirmed alone cover 31.6 km². Unconfirmed areas are estimated by private research institutes at roughly eighteen times that. That is not something to piece together from public data.
- The timing of changes is only known by summer, not precisely. This method can only say "green in summer 2023, bare ground in summer 2025." It doesn't reveal exactly when the land was bulldozed.
Having done it, the conclusion was the same as what the AI said at the start: free satellite imagery cannot find mines. Even so, I was able to map some of the traces of land bulldozed to bury mines, and the riverbanks where drifted mines come ashore. Once the summer monsoon ends, I hope people will think, at least once, of the red riverbanks on this map.
If you enjoyed reading this, please leave a comment.
Sources
- September 21 Yeoncheon mine accident: RFA 2026-09-21, Seoul Shinmun 2026-09-28, UPI 2026-09-29/30, Korea Times 2026-09-30
- Scale of North Korean construction: Newspim/JoongAng Daily 2026-06-22, Yonhap News 2025-10-14, NK News 2025-11-26, Daily NK 2026-08-10 (KRISS Satellite Analysis Center)
- Stray mines: Seoul Shinmun 2010-08-01/2021-06-04/2026-07-26, Etoday 2010-08-01, Kyunghyang Shinmun 2020-09-29/2024-07-17, Seoul Economic Daily 2026-08-07/09-23
- Minefield area: Seoul Economic Daily 2026-10-01
- Satellite: Contains modified Copernicus Sentinel data 2023–2026 (via Element 84 Earth Search)
- Terrain: produced using Copernicus WorldDEM-30 © DLR e.V. 2010-2014 and © Airbus Defence and Space GmbH 2014-2018 provided under COPERNICUS by the European Union and ESA
- Demarcation line and river geometry: © OpenStreetMap contributors
- Base map: Tiles © Esri