Looking at a Cup of Coffee as a System
From the moment a bean fractures between the burrs to the moment it touches the tongue, I've mapped the process in eight stages, charting what research has established at each stage and where the gaps remain. The starting point for the series "From Burr to Tongue."
Coffee talk is full of numbers. Water at 93°C, pressure at 9 bar, extraction yield of 18–22%, espresso pulled in around 25 seconds. But trace where these numbers came from, and the trail goes cold faster than you'd expect. Some come from a single experiment, some trickle down from a reference table half a century old, and some nobody can trace back to whoever said them first.
I work with cameras, looking at small objects and figuring out what they are and how big they are. Doing this long enough builds a habit: when I'm handed a number, the first thing I ask is "measured with what, and how?" And I'd rather see a distribution than a single average. The average brightness of a photo tells you nothing about what's actually in the frame. A cup of coffee, too, is usually summed up in two numbers — concentration and yield — and it's worth asking just how much those two numbers really say about what's happening inside the cup.
This series looks at coffee with that same habit. I break the process down into stages — from the instant a bean fractures between the burrs to the instant it touches the tongue — and check, stage by stage, what academic research has established and what's still unknown. Where experiments are missing, I try to fill the gap with simulation, and I build those simulations so you can play with them right in the browser. I'm calling the series "From Burr to Tongue."
Today is episode 0 — the one where I draw the map.
Breaking a Cup Into Eight Stages
Viewed as a process, making a cup of coffee breaks down into eight stages. The output of one stage becomes the input of the next.
- The bean. A hard particle with its own moisture content, roast level, and internal pore structure.
- The burr. The grinder's cutting surface. Shape, gap, rotation speed, and temperature are the variables.
- Particle size distribution. Grounds coming off the burr vary widely in size. This size distribution is the starting point for every stage that follows.
- The puck/bed. The state of the grounds once they're packed into a basket or dripper. How densely the particles are packed determines how easily water can pass through — permeability.
- Water flow. Pressure or gravity drives water through those gaps. It can pass through evenly, or it can funnel toward one path.
- Extraction. Water dissolves compounds out of the particle surface and interior. Different compounds dissolve at different rates.
- The cup. The total amount dissolved gets summarized into two numbers: concentration (TDS) and extraction yield (EY).
- The tongue. A person drinks that cup and judges it.
Click a stage on the map below and you'll see that stage's variables, what's been confirmed, and what's still unknown. The bar under each stage counts the evidence charted for it. Green is peer-reviewed research, orange is industry/vendor/blog material, and red is a confirmed gap.
What's Known at Each Stage
From here on, I'll highlight only the most representative items, stage by stage, out of the roughly 80 papers I reviewed while preparing this series. Every number is followed by its source, and non-peer-reviewed industry or vendor material is flagged separately.
The bean. Slowly crushing a single roasted bean takes 30–60 N — roughly the force of setting a 3–6 kg object on top of it (Nedomová 2013). The moisture left after roasting amounts to only a few percent, but that small difference matters a great deal during grinding. Dark roasts (1.0–1.3% moisture) pick up a negative charge when ground, while light roasts (2.8–3.0%) pick up a positive one. The polarity flips around 2% moisture (Méndez Harper 2024). On the other hand, I couldn't find any systematically measured data for the fracture-mechanics constants that describe how hard a bean is or how easily a crack propagates through it.
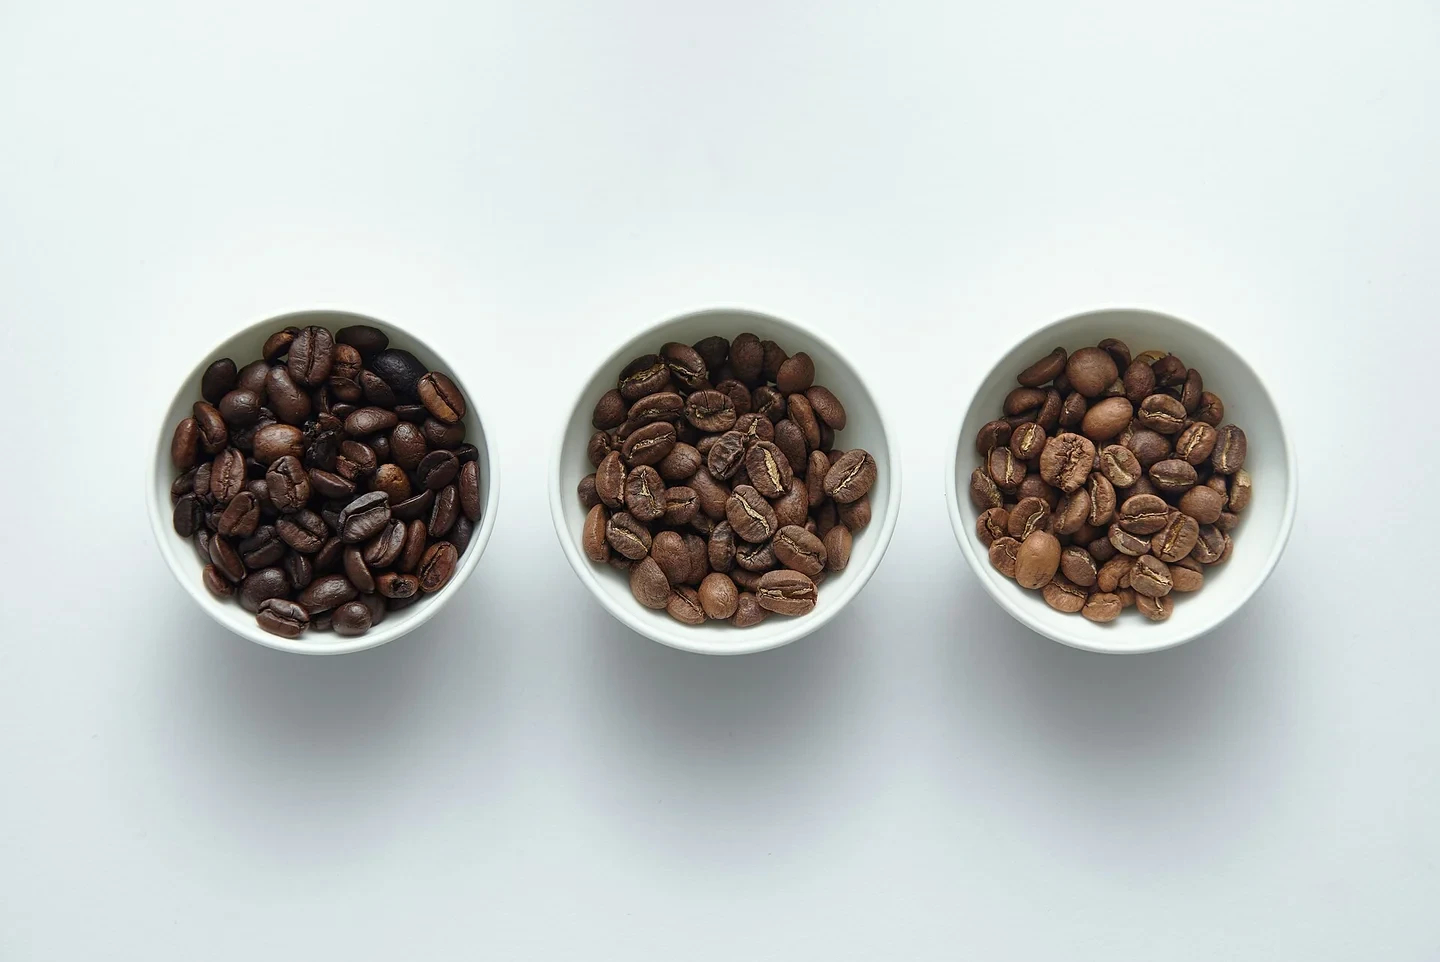
The same amount (15 g) of beans roasted to different degrees. Photo: Alorin / Wikimedia Commons (CC BY 4.0)
The burr. This stage was the biggest surprise. I couldn't find a single peer-reviewed paper that ran a controlled experiment on how flat versus conical burrs, burr size, or rotation speed change the resulting particle distribution. The largest dataset I found was a blog post that re-analyzed 300 particle distributions across 24 espresso grinders. There, conical burrs were less uniform on average, but the two distributions overlapped so much that some conical grinders beat some flat ones (Gagné 2023, non-peer-reviewed). Industry sources disagree with each other on which direction rotation speed matters. There's no peer-reviewed measurement of how hot a grinder gets, either. All that's left is a single 2004 case report from an equipment maker, which found that grinding continuously for 10 minutes raised the grounds' temperature by about 12°C (Pico Technology 2004, non-peer-reviewed). Nor was there any paper modeling how a bean fractures between burrs using particle simulation (DEM) — just one demo video from a software vendor.
Grinder burrs come in two broad types: flat burrs, where two ridged discs spin facing each other, and conical burrs, where a cone-shaped blade spins inside an outer ring.
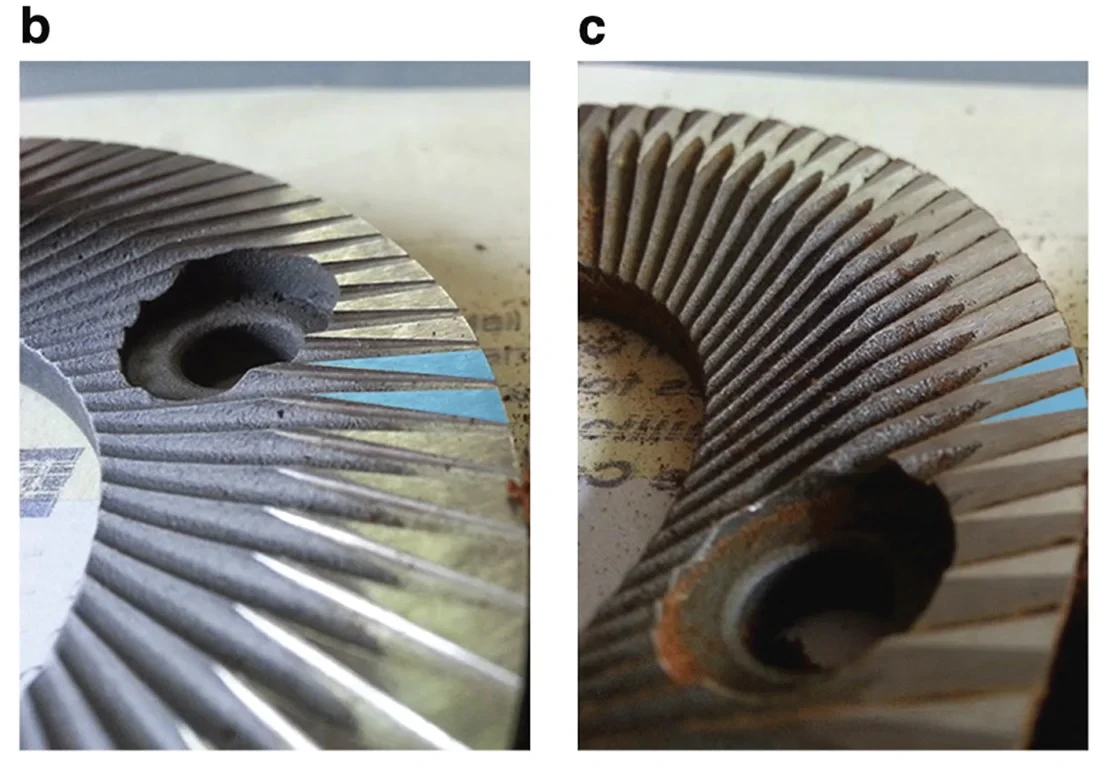
Flat burrs. The Turkish burr (b) and coffee burr (c) of the EK43 used in the bean-temperature experiment. Figure: Uman et al. 2016, Scientific Reports, CC BY 4.0. Photo by Spencer Webb. The grinder diagram (a) from the original figure has been omitted here.
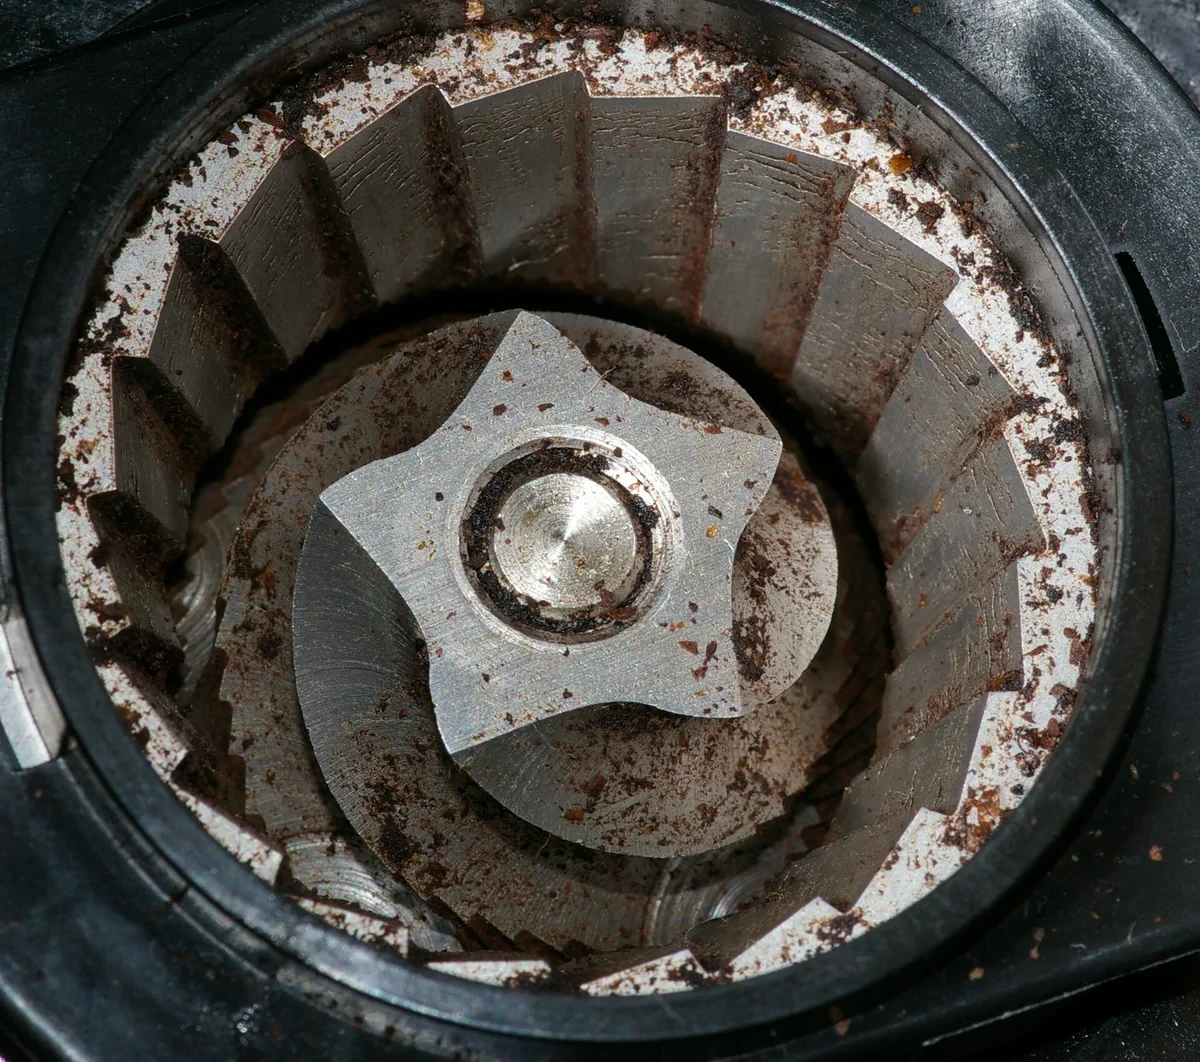
A conical burr. Photo: Hustvedt / Wikimedia Commons (CC BY-SA 3.0)
Particle size distribution. The size distribution of ground coffee has two peaks. The smaller peak sits consistently around 30–40 µm regardless of grinder. Since coffee cells run 25–50 µm across, the leading explanation is that these fines are fragments of cell walls (Mo 2023). The larger peak shifts anywhere between 200 and 1000 µm depending on grind setting. Even measuring this distribution isn't simple. In one experiment, counting particles one by one found that 99% were smaller than 100 µm — yet those small particles accounted for 80% of the total surface area (Cameron 2020). Plot the same grounds by particle count versus by volume, and you get entirely different-looking charts. Laser diffraction, sieving, and camera-based methods all give different answers from each other. Even the international standard for laser diffraction admits that it diverges from other methods for non-spherical particles (ISO 13320).
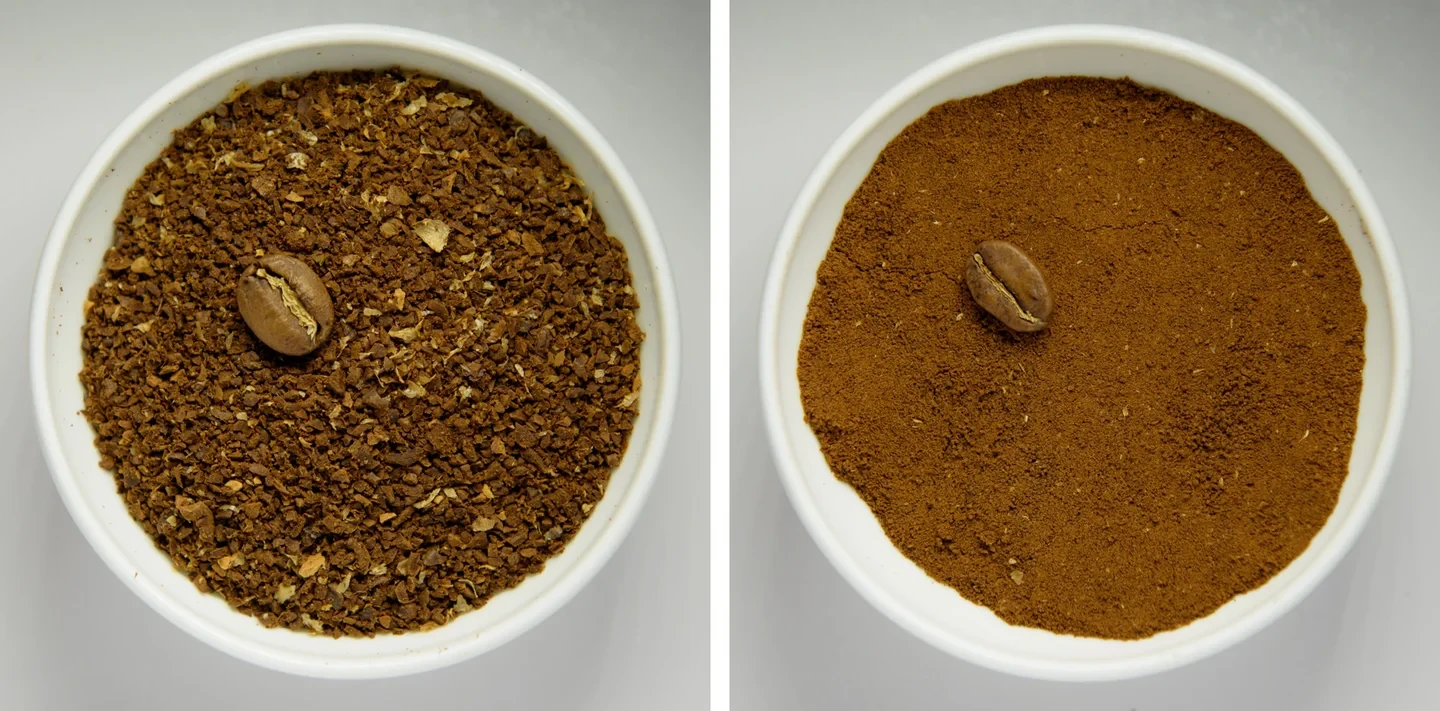
Coarse grounds (left) and fine grounds (right). The bowls are 70 mm in diameter. In the coarse grind, fine powder is visible mixed in among the larger particles. Photo: Alorin / Wikimedia Commons (CC BY 4.0), two images placed side by side.
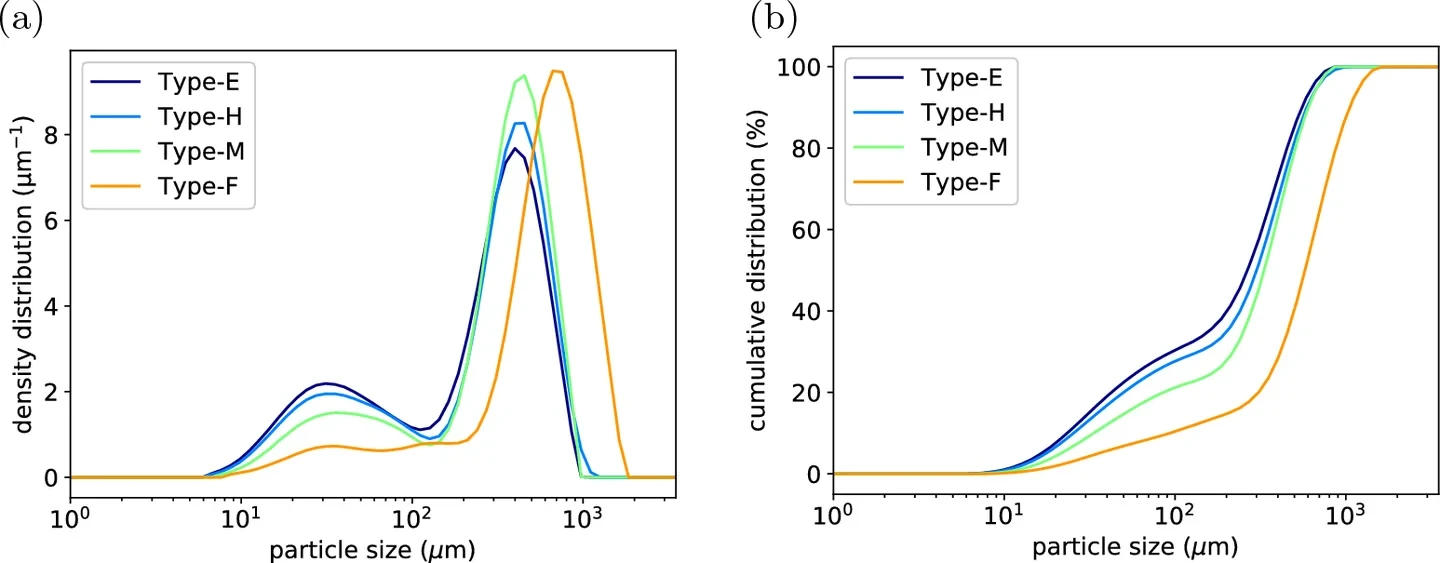
A bimodal distribution. The same beans ground for espresso (E), capsule (H), moka pot (M), and drip (F) brewing, measured by laser diffraction. (a) Distribution, (b) cumulative distribution. Figure: Mo et al. 2023, Scientific Reports, CC BY 4.0
The puck. An espresso puck's permeability falls roughly in the range of 10⁻¹³–10⁻¹⁴ m² (Corrochano 2015). What drives this value is the fines. Adding more particles smaller than 100 µm lowers permeability and lengthens shot time (Smrke 2024). Tamping pressure had no detectable effect on how fast caffeine and trigonelline were extracted (Kuhn 2017). I couldn't find any controlled study on the effect of the puck-prep tools baristas fuss over — WDT tools, distributors.
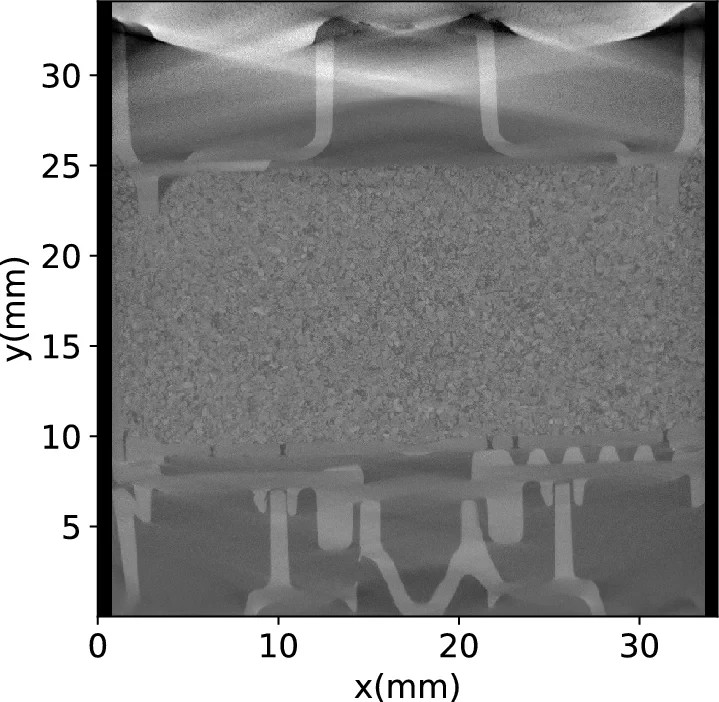
A vertical slice through coffee grounds in a capsule, imaged by X-ray µCT. The bumpy band in the middle is the puck. The researchers separated particles from voids in this 3D image and then ran calculations of water flowing through those voids. Figure: Mo et al. 2023, Scientific Reports, CC BY 4.0
Water flow. You'd expect raising pressure to make water flow proportionally faster, but in café machines, flow rate scaled with pressure only up to about 5 bar; above that, it saturated. The reason is that pressure compresses the puck and narrows the gaps (Waszkiewicz 2026). Another study explains the same phenomenon through inertial effects (Mo 2023), so this is currently a point where interpretations in the field diverge. Channeling — where water funnels down one path — is well explained in theory: a path that sees more water loses more compounds and becomes looser, and that looser path draws even more water (Lee 2023). But no one has yet filmed the actual moment a channel forms under 9 bar of pressure.
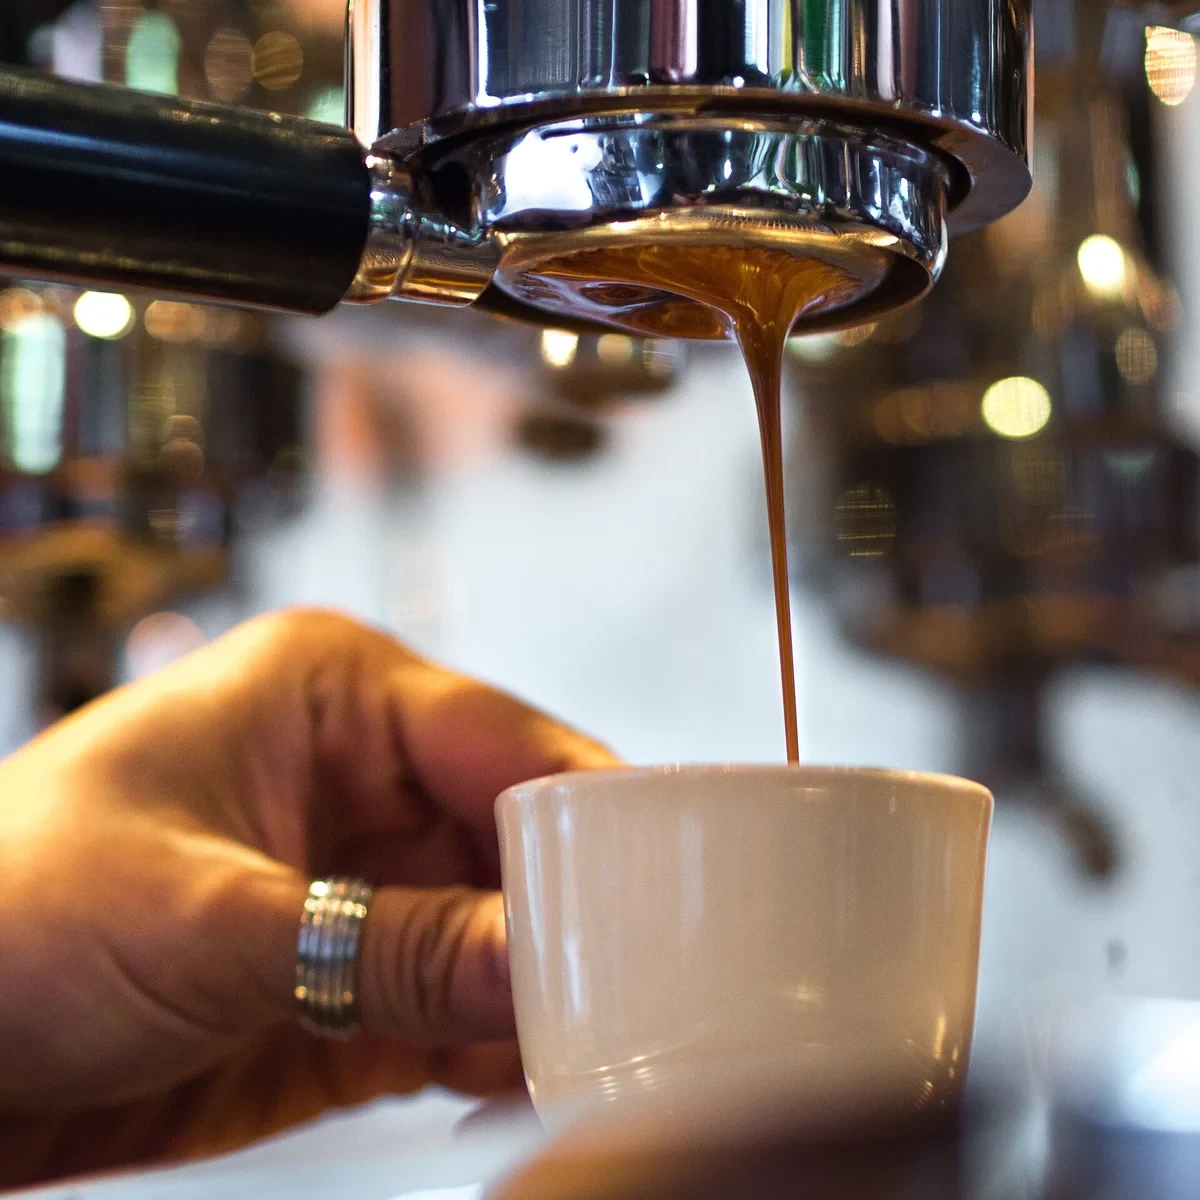
Espresso pulled with a bottomless (naked) portafilter. With the basket's underside exposed, you can see with your own eyes whether water is passing through the puck evenly. In this photo, it converges into a single stream. Baristas treat a stream that splits into multiple strands or sprays sideways as a sign of channeling. Photo: Takeaway / Wikimedia Commons (CC BY-SA 4.0)
Extraction. Compounds come out in two ways: quickly, at particle surfaces where broken cells are exposed, and slowly, diffusing out through narrow pores deep inside the particle (Moroney 2015). Different compounds also follow different timelines. Split an espresso shot into ten fractions, and trigonelline and total dissolved solids drop off fastest, while chlorogenic acids and caffeine decline more slowly (Schmieder 2023). For full-immersion methods like the French press, yield plateaus at around 21% regardless of how you change the coffee-to-water ratio (Liang 2021).
The cup. The concentration and yield measured in the cup are averages over the whole puck. Peering inside a fine-grind bed with a mathematical model reveals local yields that vary by about 5 percentage points depending on position. Conical drippers and cylindrical beds produced similar concentrations in the cup, but their internal extraction variance differed (Moroney 2019). In other words, two cups with the same average can be different on the inside.
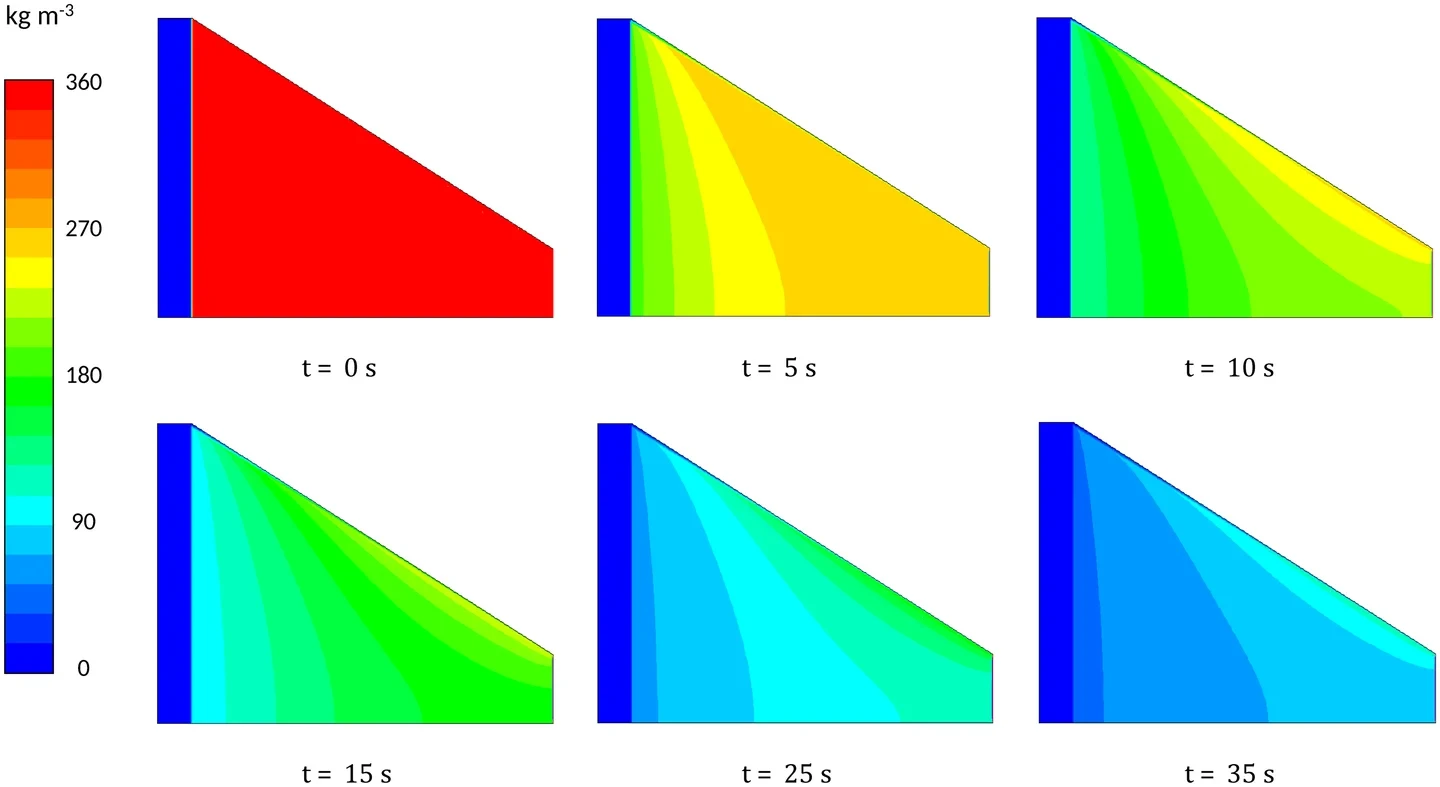
CFD calculation of the soluble compound concentration remaining in the grounds of a fine-grind conical bed, from 0 to 35 seconds. Red marks where a lot remains; blue marks where it's nearly depleted. The concentration that reaches the cup is a single number, but inside the bed it's this uneven. Figure: Moroney et al. 2019, PLOS ONE, CC BY 4.0
The tongue. Sensory research turns out to be sturdier than you'd expect. When concentration and yield were held constant, a panel couldn't distinguish coffee brewed at 87, 90, or 93°C (Batali 2020). Sweetness actually declined as concentration and yield rose (Frost 2020). Consumers split into two groups with different taste preferences, so there was no single 'ideal box' that suited everyone (Guinard 2023). There's a clear open question too: nobody has measured whether extraction variance inside the cup — the distribution the average hides — changes how it tastes.
The Stages Don't Operate in Isolation
I've split this into eight stages, but they're all linked to each other. One paradox makes that clear.
The finer the grind, the larger the surface area, so you'd expect better extraction. Models that assume water passes evenly through the puck predict exactly that — yield should keep climbing as the grind gets finer. But pull an actual espresso shot, and yield peaks at some grind setting, then drops once you go finer than that. Shot-to-shot variance grows too (Cameron 2020). The researchers interpreted this as water failing to flow evenly through the finer grind. The same study reported that cutting the dose from 20 g to 15 g and grinding coarser achieved the same yield more reliably — meaning you could save up to 25% on beans.
Unpacked stage by stage, this paradox runs like this: a finer grind from the burr (stage 2) produces more fines (stage 3), and the fines clog the puck's gaps and lower permeability (stage 4). In a puck with low, uneven permeability, water funnels down certain paths (stage 5); those paths get over-extracted while the rest gets under-extracted (stage 6). The refractometer reads the blended average of the two (stage 7).
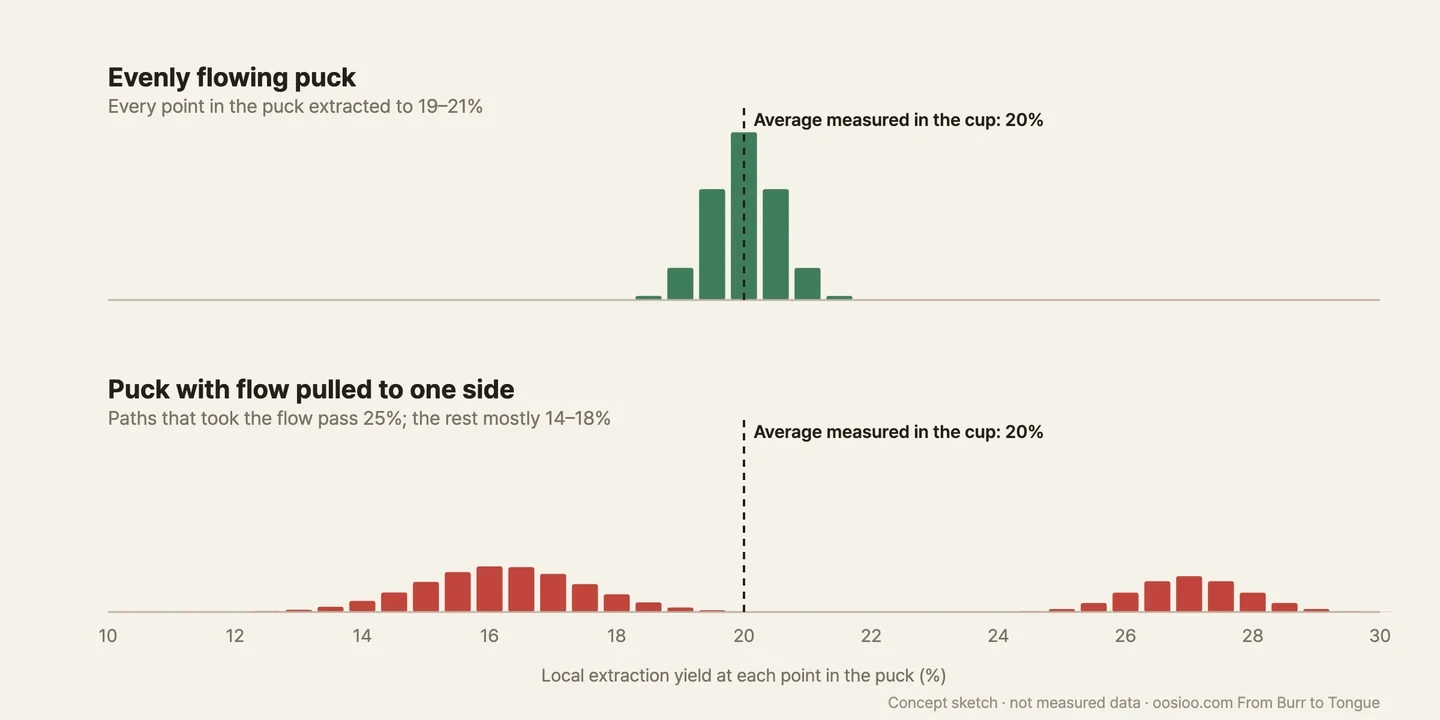
The figure above is conceptual, not a measurement. It depicts two cups with the same 20% average yield. In one, the entire puck extracted evenly; in the other, part of it over-extracted and part under-extracted. Measured with a refractometer, both cups give the same number. Look at only one stage, and this problem stays invisible — grind researchers look at distributions, fluid researchers look at permeability, sensory researchers look at the cup. Connecting those dots is what this series is for.
The Blanks on the Map
Once I'd gathered the literature together, the evidence wasn't spread evenly. It gets thicker downstream and thinner upstream.
Extraction and sensory science are fields that mathematicians, physicists, food engineers, and sensory scientists have spent a long time working on. Flow inside the puck has also seen a string of studies in the last few years, imaging the puck's interior with X-ray CT and then computing fluid flow on top of it. But the grinder — the actual starting point of everything — turns out to be covered mostly by industry measurements, blogs, and vendor demos. Here's a summary of the gaps this survey turned up.
- There's no peer-reviewed paper modeling coffee grinding with particle simulation (DEM)
- There's no controlled experiment on burr shape, size, rotation speed, or alignment
- There's no peer-reviewed study measuring burr or grounds temperature during grinding
- There are no fracture-mechanics constants for coffee beans
- There's no peer-reviewed study comparing particle distributions between blade grinders and burr grinders
- There's no controlled study of puck-prep tools' effects
- No one has filmed the moment a channel forms under pressure
- There's no study measuring whether extraction variance inside the cup changes the taste
- Even the definition of "fines" differs from study to study (under 100 µm, the cell-size peak, a laser cutoff around 70 µm)
These blanks split into two kinds: ones that need lab equipment to fill, and ones you can approach with computation and measurement tools. This series takes on the latter. Measuring particles from photographs, simulating a burr's cross-section, running water through a puck — these are all things worth trying with a vision engineer's toolkit.
How to Read This Series
Each piece holds onto one question. I'll lay out the physics and chemistry needed, read prior research together with its numbers, and then simulate or measure it myself. Simulations are embedded right in the piece so you can play with them directly.
Evidence is marked in three categories.
- Confirmed: A fact verified in a peer-reviewed paper. The reference list notes whether I read the full text or only checked the abstract.
- Model estimate: A result produced by a simulation built for this series. It remains a hypothesis until verified experimentally.
- Open question: Where research is simply absent.
Industry measurements, blogs, and vendor material are flagged in the text as 'non-peer-reviewed.' In this field, industry sources are often the largest dataset available, so I can't just discard them — but I won't weigh them the same as peer-reviewed research either.
References
- Nedomová Š et al. (2013). Strength of coffee beans under static and dynamic loading. Acta Univ. Agric. Silvic. Mendel. Brun. 61(3), 743–749. doi:10.11118/actaun201361030743 — verified full text
- Méndez Harper J et al. (2024). Moisture-controlled triboelectrification during coffee grinding. Matter 7(1), 266–283. doi:10.1016/j.matt.2023.11.005 — verified full text (arXiv)
- Gagné J (2023). What I learned from analyzing 300 particle size distributions for 24 espresso grinders. Coffee ad Astra. link — non-peer-reviewed
- Pico Technology (2004). Espresso coffee grinder testing. link — non-peer-reviewed, equipment vendor case study
- Mo C et al. (2023). Exploring the link between coffee matrix microstructure and flow properties using combined X-ray microtomography and smoothed particle hydrodynamics simulations. Scientific Reports 13, 16374. doi:10.1038/s41598-023-42380-y — verified full text
- Cameron MI et al. (2020). Systematically improving espresso: insights from mathematical modeling and experiment. Matter 2(3), 631–648. doi:10.1016/j.matt.2019.12.019 — verified full text (author's PDF)
- ISO 13320:2020. Particle size analysis — Laser diffraction methods. link — verified against the official sample text
- Corrochano et al. (2015). A new methodology to estimate the steady-state permeability of roast and ground coffee in packed beds. Journal of Food Engineering. doi:10.1016/j.jfoodeng.2014.11.006 — abstract verified
- Smrke S et al. (2024). The role of fines in espresso extraction dynamics. Scientific Reports 14, 5612. doi:10.1038/s41598-024-55831-x — verified full text
- Kuhn M et al. (2017). Time-resolved extraction of caffeine and trigonelline from finely-ground espresso coffee with varying particle sizes and tamping pressures. Journal of Food Engineering 206, 37–47. doi:10.1016/j.jfoodeng.2017.03.002 — abstract verified
- Waszkiewicz R et al. (2026). Under pressure: poroelastic regulation of flow in espresso brewing. Physics of Fluids 38(6), 063113. doi:10.1063/5.0319611 — verified full text (arXiv)
- Lee WT et al. (2023). Uneven extraction in coffee brewing. Physics of Fluids 35(5), 054110. doi:10.1063/5.0138998 — verified full text (arXiv)
- Moroney KM et al. (2015). Modelling of coffee extraction during brewing using multiscale methods: an experimentally validated model. Chemical Engineering Science 137, 216–234. doi:10.1016/j.ces.2015.06.003 — content verified via a follow-up paper's abstract
- Schmieder BKL et al. (2023). Influence of flow rate, particle size, and temperature on espresso extraction kinetics. Foods 12(15), 2871. doi:10.3390/foods12152871 — verified full text
- Liang J et al. (2021). An equilibrium desorption model for the strength and extraction yield of full immersion brewed coffee. Scientific Reports 11, 6904. doi:10.1038/s41598-021-85787-1 — abstract verified
- Moroney KM et al. (2019). Analysing extraction uniformity from porous coffee beds using mathematical modelling and computational fluid dynamics approaches. PLOS ONE 14(7), e0219906. doi:10.1371/journal.pone.0219906 — verified full text
- Batali ME et al. (2020). Brew temperature, at fixed brew strength and extraction, has little impact on the sensory profile of drip brew coffee. Scientific Reports 10, 16450. doi:10.1038/s41598-020-73341-4 — abstract verified
- Frost SC et al. (2020). Effects of brew strength, brew yield, and roast on the sensory quality of drip brewed coffee. Journal of Food Science 85(8), 2530–2543. doi:10.1111/1750-3841.15326 — abstract and SCA summary verified
- Guinard J-X et al. (2023). A new Coffee Brewing Control Chart relating sensory properties and consumer liking to brew strength, extraction yield, and brew ratio. Journal of Food Science 88(5), 2168–2177. doi:10.1111/1750-3841.16531 — abstract verified
- Uman E et al. (2016). The effect of bean origin and temperature on grinding roasted coffee. Scientific Reports 6, 24483. doi:10.1038/srep24483 — verified full text
Image Credits
- Beans at different roast levels: Alorin, Wikimedia Commons, CC BY 4.0
- Flat burrs: Uman et al. (2016) Fig. 2b·c, Scientific Reports, CC BY 4.0 (photo by Spencer Webb, cropped from the original)
- Conical burr: Hustvedt, Wikimedia Commons, CC BY-SA 3.0
- Coarsely and finely ground coffee: Alorin, Wikimedia Commons coarse · fine, CC BY 4.0 (two images placed side by side)
- Particle size distribution, puck µCT cross-section: Mo et al. (2023) Fig. 3·4, Scientific Reports, CC BY 4.0
- Naked portafilter: Takeaway, Wikimedia Commons, CC BY-SA 4.0
- Extraction simulation of a conical bed: Moroney et al. (2019) Fig. 9, PLOS ONE, CC BY 4.0
- All other figures and the map: created by the author


