Heroes on the Boundary
Who comes closest to a superhero in real life? Scoring 34 heroes from Marvel and DC to find the line that divides the two worlds, we run into PCA, LDA, and support vector machines, then follow the machines that draw lines in reality, from bankruptcy prediction to facial recognition. The third piece in the A Page for Today series.
Today, once again, I opened my idea notebook to a random page. What came out this time wasn't a sentence but a question.
Who do you think comes closest to a superhero in real life?
The usual answers are firefighters, ER doctors, parents raising children. All fair answers. But to answer the question properly, you first have to decide what a superhero even is. Superheroes usually have extraordinary abilities. They fly, or lift anything, or see what no one else can.
When we say superhero, we usually picture the two worlds we know from the movies: Marvel and DC. Spider-Man and Iron Man stand on one side, Superman and Batman on the other. What separates them? A fan would answer instantly, by feel. But try to teach that feeling to a machine, and the story changes. Today I want to draw a line between Marvel and DC. Drawing that line brings out the heroes caught on the border, and they're today's main characters.
Ability Alone Doesn't Split Them
I picked 34 heroes first — 17 from Marvel, 17 from DC — and scored each one on five traits from 0 to 10: raw power, goodness, practical usefulness (how useful the power would be in everyday life), everyday troubles (how much they worry about money, illness, family, addiction, and the like), and mythic-ness (how close they are to a god, an alien, or a legend). To these I added the factual year of first appearance and a score for the realism of their setting — whether their home base is an actual city or a fictional one. A disclosure up front: every score except the year of first appearance is my own judgment call. Superman gets a 10 for power, Hawkeye a 2. I expect plenty of fans to disagree.
First, let's plot the traits the movie posters love to boast about — power and goodness.
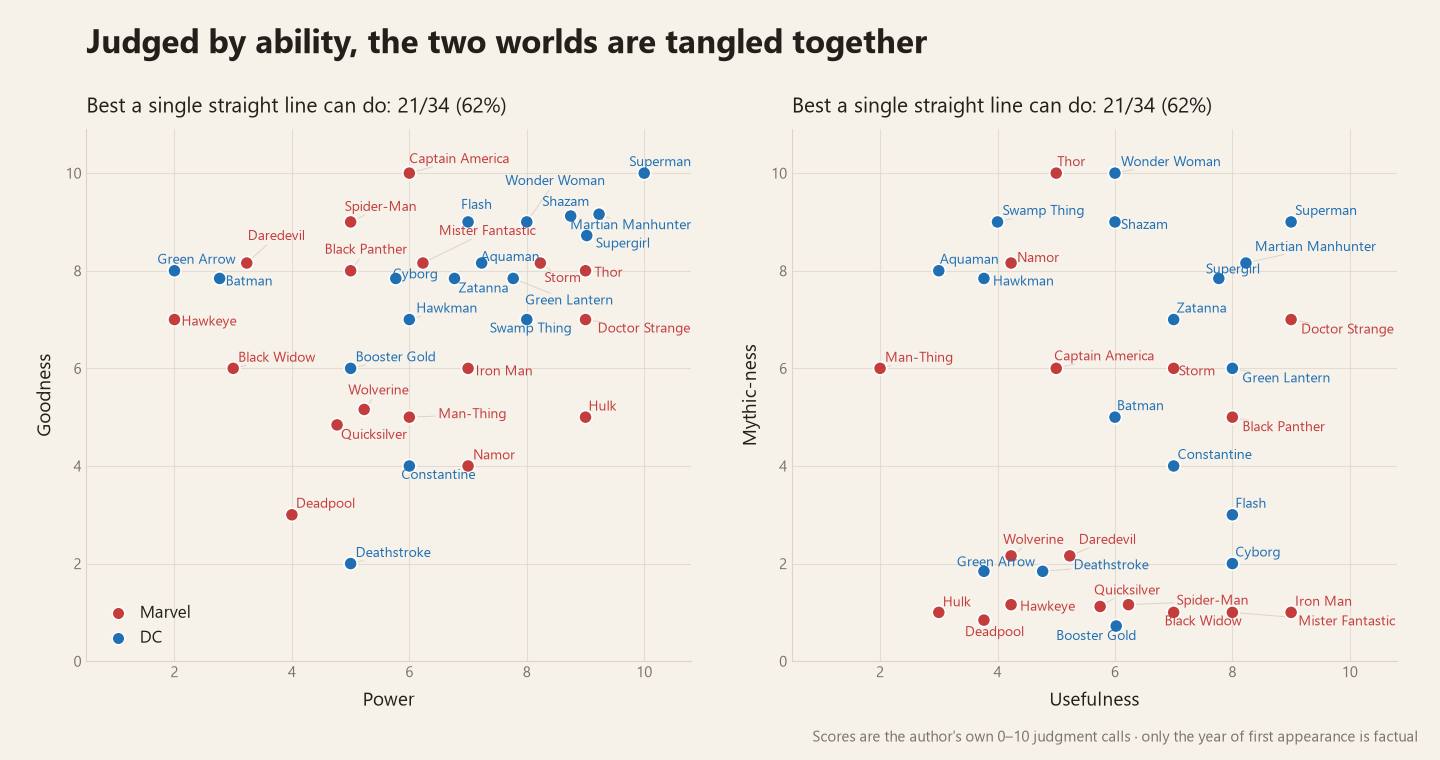
Red and blue are tangled together. Black Panther sits right next to Cyborg; Deadpool sits near Deathstroke. However you draw a straight line, it only gets 21 of the 34 heroes (62%) right. Flip a coin and you'd get half right anyway — meaning ability alone can't separate Marvel from DC.
No surprise they're tangled. The two companies have been eyeing each other for over eighty years.
| Marvel | DC | What They Share |
|---|---|---|
| Namor (1939) | Aquaman (1941) | King of an undersea kingdom |
| Quicksilver (1964) | Flash (1956, Barry Allen) | Runs faster than anyone |
| Hawkeye (1964) | Green Arrow (1941) | Fights with just a bow, no powers |
| Man-Thing (May 1971) | Swamp Thing (July 1971) | A plant monster born from a swamp |
| Deadpool (1991) | Deathstroke (1980) | Masked mercenary; even their real names echo each other, Wade Wilson and Slade Wilson |
Deadpool's real name is a writer's joke, a twist on Deathstroke's real name, Slade Wilson. Man-Thing and Swamp Thing debuted two months apart, and the story goes that the writers who created the two characters were roommates at the time.
There was even a fight over a name. In 1940, a publisher called Fawcett put out a hero named Captain Marvel — a boy who shouts "Shazam!" and transforms into an adult hero, a story that outsold Superman in the 1940s. DC, which owned Superman, sued for copying, and Fawcett shelved the character's comics in 1953. In the meantime, Marvel launched its own Captain Marvel in 1967 and secured the name as a trademark. DC later bought the original character, but couldn't use the name anymore. In the end, the hero took the name of his own magic word: Shazam. Body at DC, old name at Marvel — a hero literally standing on the border.
The Direction of Widest Spread: PCA
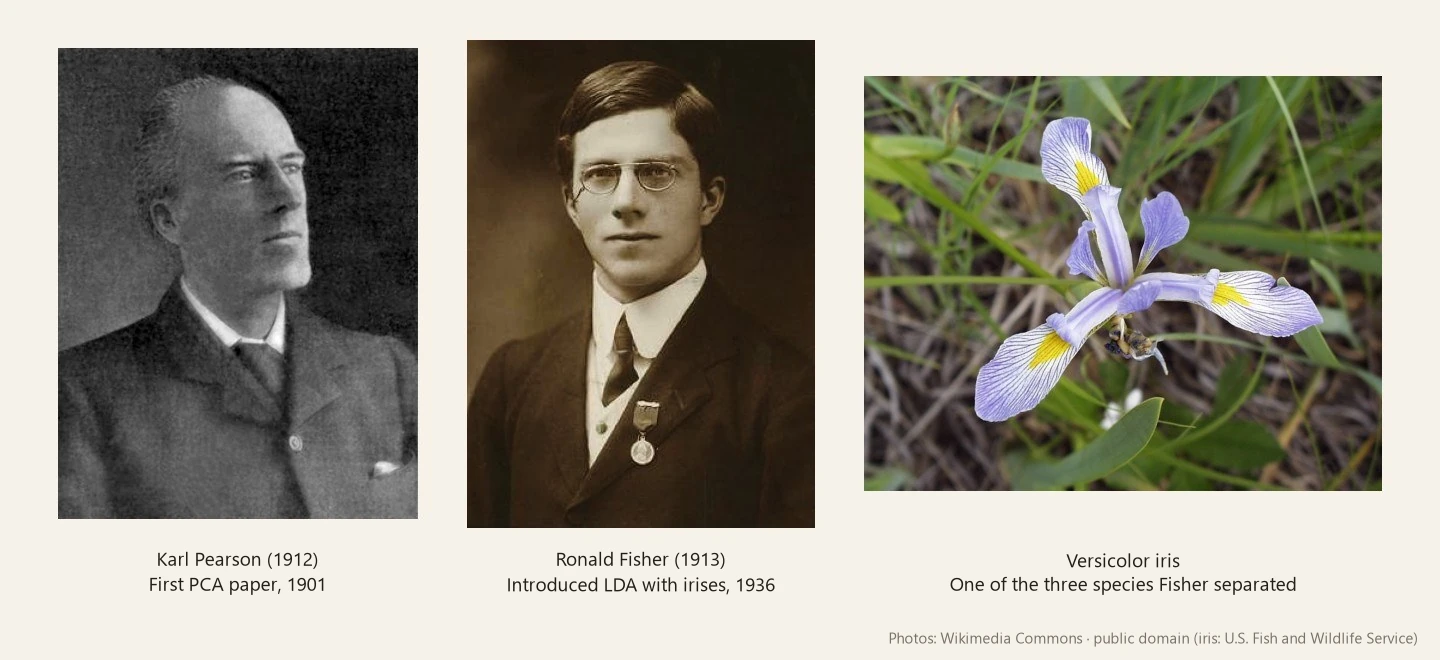
With seven traits, you can't fit everything into one chart. The first tool to reach for here is Principal Component Analysis (PCA). The British statistician Karl Pearson introduced it in 1901 in a paper titled "On Lines and Planes of Closest Fit to Systems of Points in Space," and in 1933 the American statistician Harold Hotelling gave it the name "principal components."
What PCA does is simple. It finds the direction in which the points are spread widest and places the first axis there. Then it places a second axis along the next-widest direction. When seven entangled traits are involved, just a couple of axes can reveal much of the overall shape. The key point is that PCA has no idea who's Marvel and who's DC — it never looks at the answer, only at the spread.
Running PCA on the 34 heroes, the first axis alone explained 49% of the total spread. It's interesting to look at what makes up this axis. Everyday troubles, late debut, and realistic setting go one way; mythic-ness, power, and goodness go the other. Without ever seeing the answer, the machine found on its own that the biggest difference was between "godlike heroes" and "human heroes."
Lining the 34 heroes up along this axis and splitting them with a single dashed line gets 26 right (76%) — much better than splitting by ability score, because Marvel leans toward human-scale heroes and DC toward godlike ones. Still, there are misses. Thor, a literal god; Namor, king of the sea; and Captain America, born in 1941, all end up on DC's side, while the anxious Constantine and fame-chasing Booster Gold end up on Marvel's side. For PCA, the widest direction isn't necessarily the direction that separates the two groups.
The Direction That Separates the Two Groups Most: LDA
Linear Discriminant Analysis (LDA) finds its axis while looking at the answer. It's the method the British statistician Ronald Fisher demonstrated in 1936, separating three species using the sepal and petal length and width of 150 irises. This dataset, collected by the botanist Edgar Anderson, still opens the first chapter of machine learning textbooks today.
Fisher's idea goes like this: a good axis is one where the two groups' averages sit far apart while the points within each group huddle close together. You just need to find the direction that maximizes the distance between the averages divided by the spread within each group. Think of a tug-of-war: you draw the line on the field so the two teams stand as far apart as possible, while each team bunches into a single cluster.
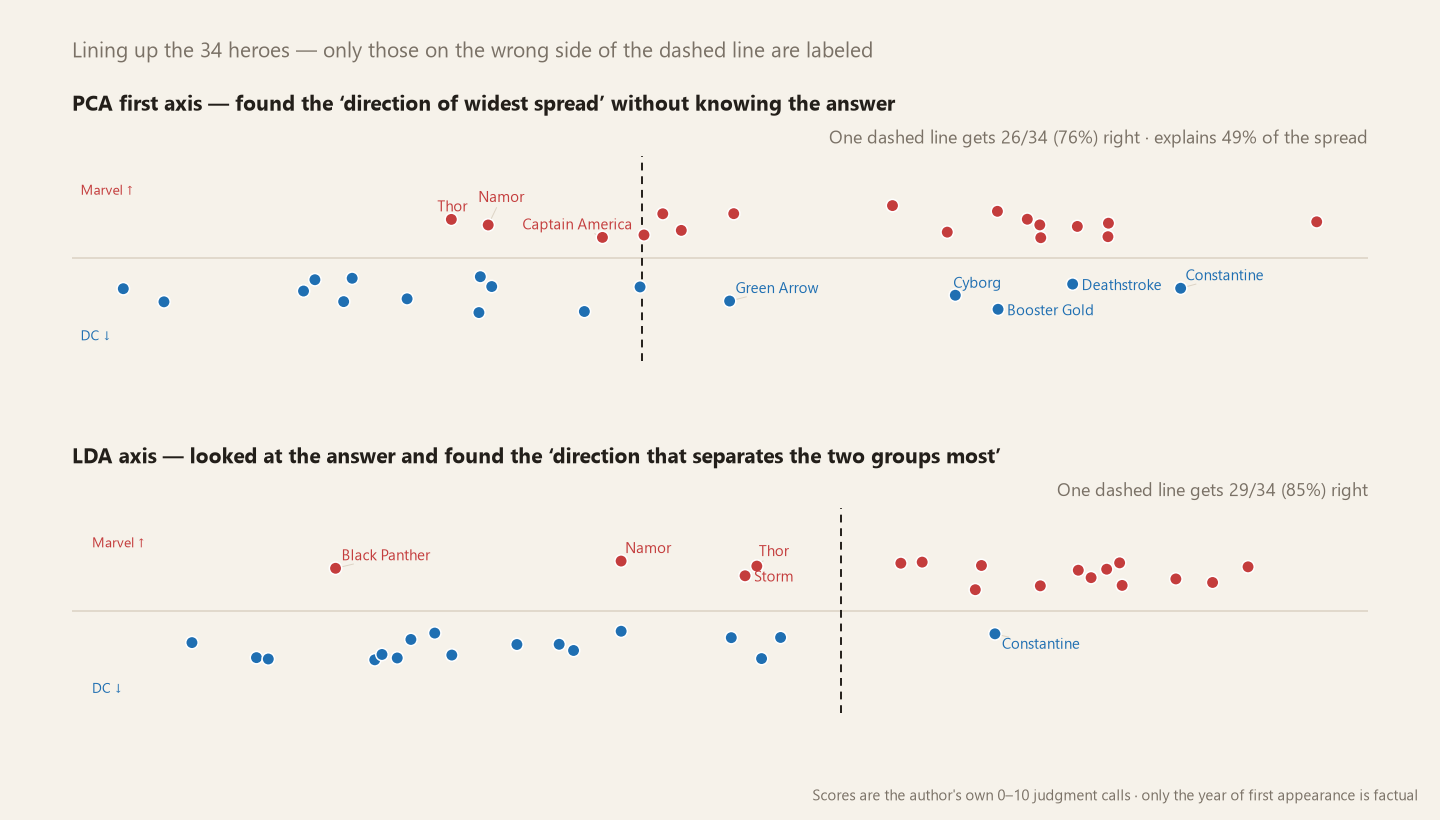
Along the LDA axis, 29 heroes (85%) land in the right spot. What's even more surprising is what LDA chose to weight.
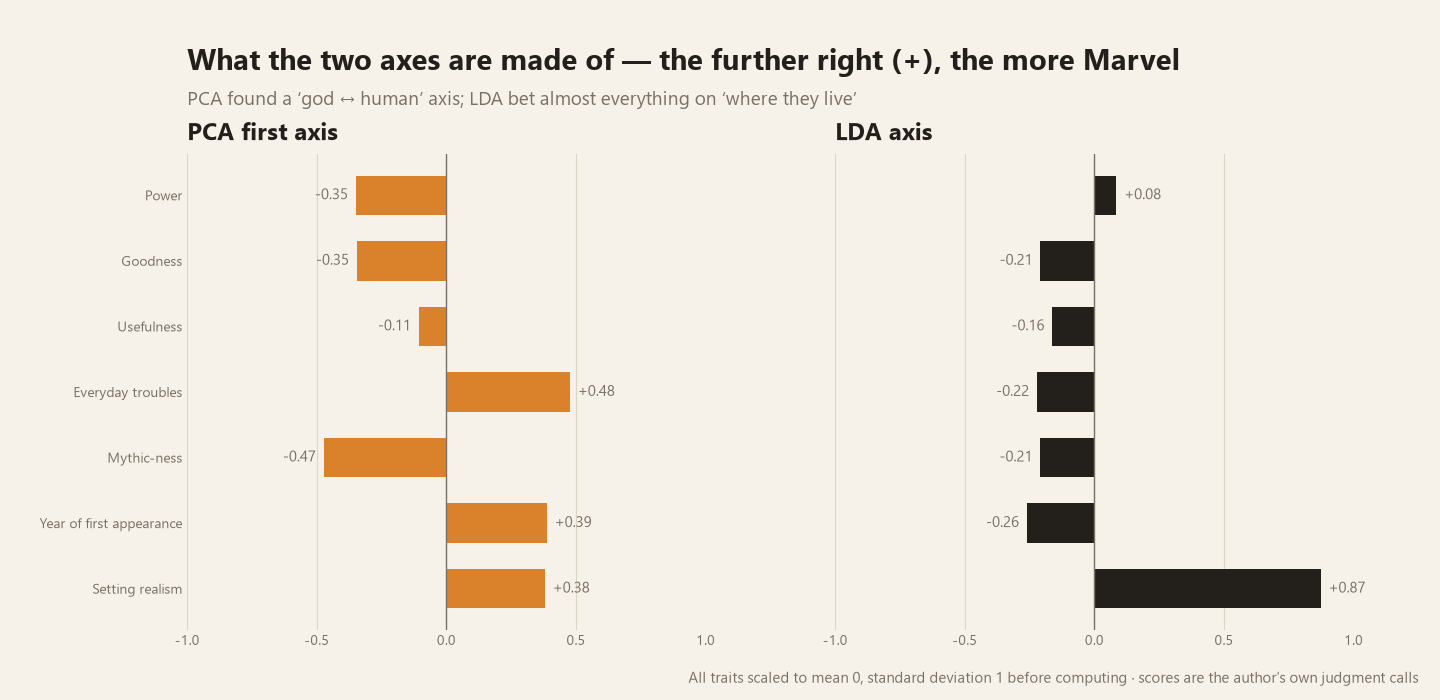
It wasn't power, goodness, or mythic-ness. The trait that best separates Marvel from DC is where the hero lives. Most Marvel heroes live in an actual New York City — Spider-Man in Queens, Daredevil in Hell's Kitchen, Doctor Strange in Greenwich Village. DC heroes live in cities that don't exist on any map: Superman's Metropolis, Batman's Gotham, Flash's Central City. The machine has rediscovered, in numbers, the very phrase Marvel liked to use about itself: "the world outside your window."
The five LDA got wrong are interesting too. Black Panther, who lives in the fictional nation of Wakanda, and Namor, who lives in undersea Atlantis, are Marvel heroes who ended up on DC's side. Cyborg from Detroit, Swamp Thing from the Louisiana swamps, and Constantine from the back alleys of London are DC heroes who ended up on Marvel's side. Namor and Swamp Thing already showed up in the look-alike table above — characters who copied one another end up meeting right on the border.
The Widest Path: Support Vector Machines
There's a third way to draw the line. If several lines can separate the two groups, which one is best? In 1963, the Soviet researchers Vladimir Vapnik and Alexander Lerner answered: carve a path between the two groups, and choose the line whose path is widest. This width is called the margin, and the classifier that maximizes the margin is called a support vector machine (SVM).
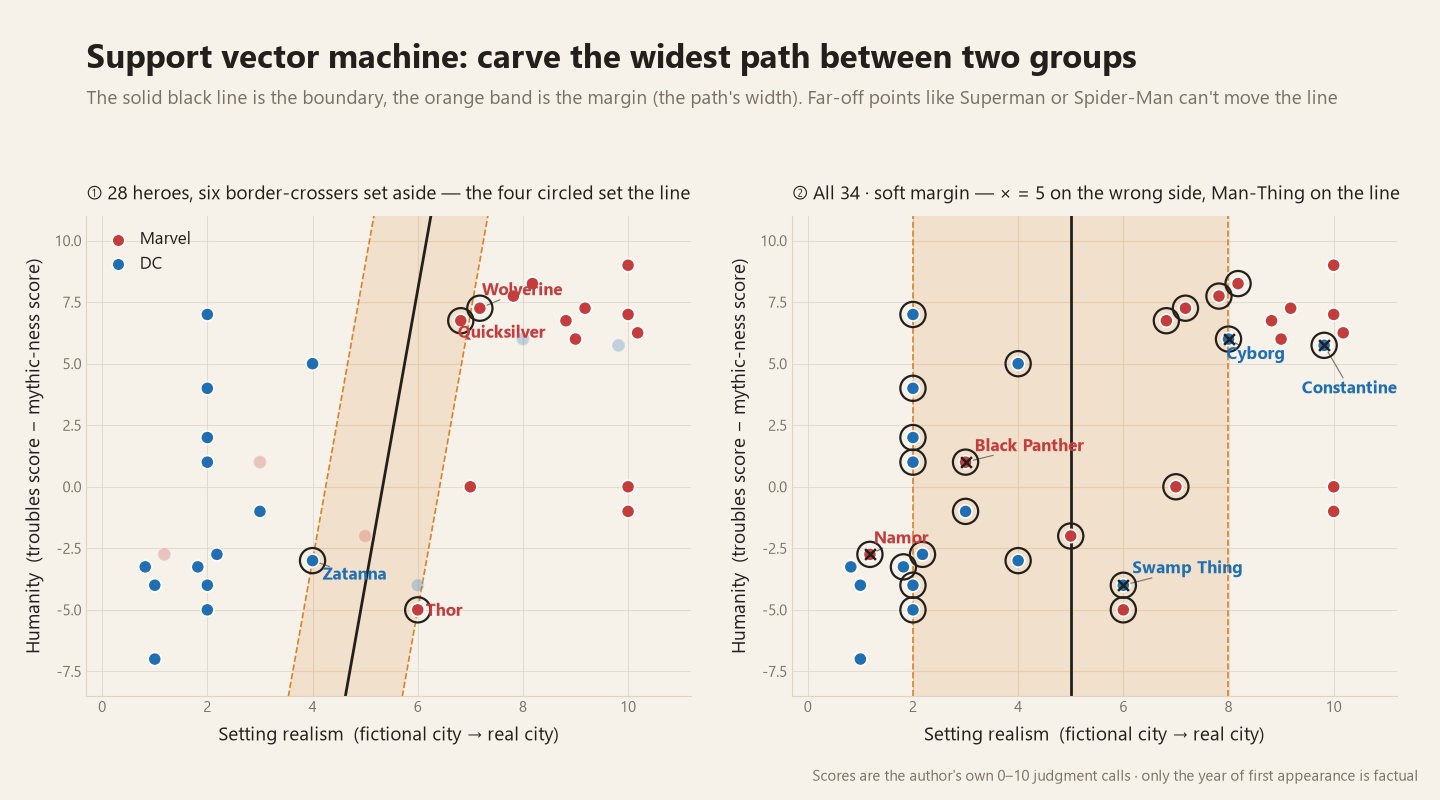
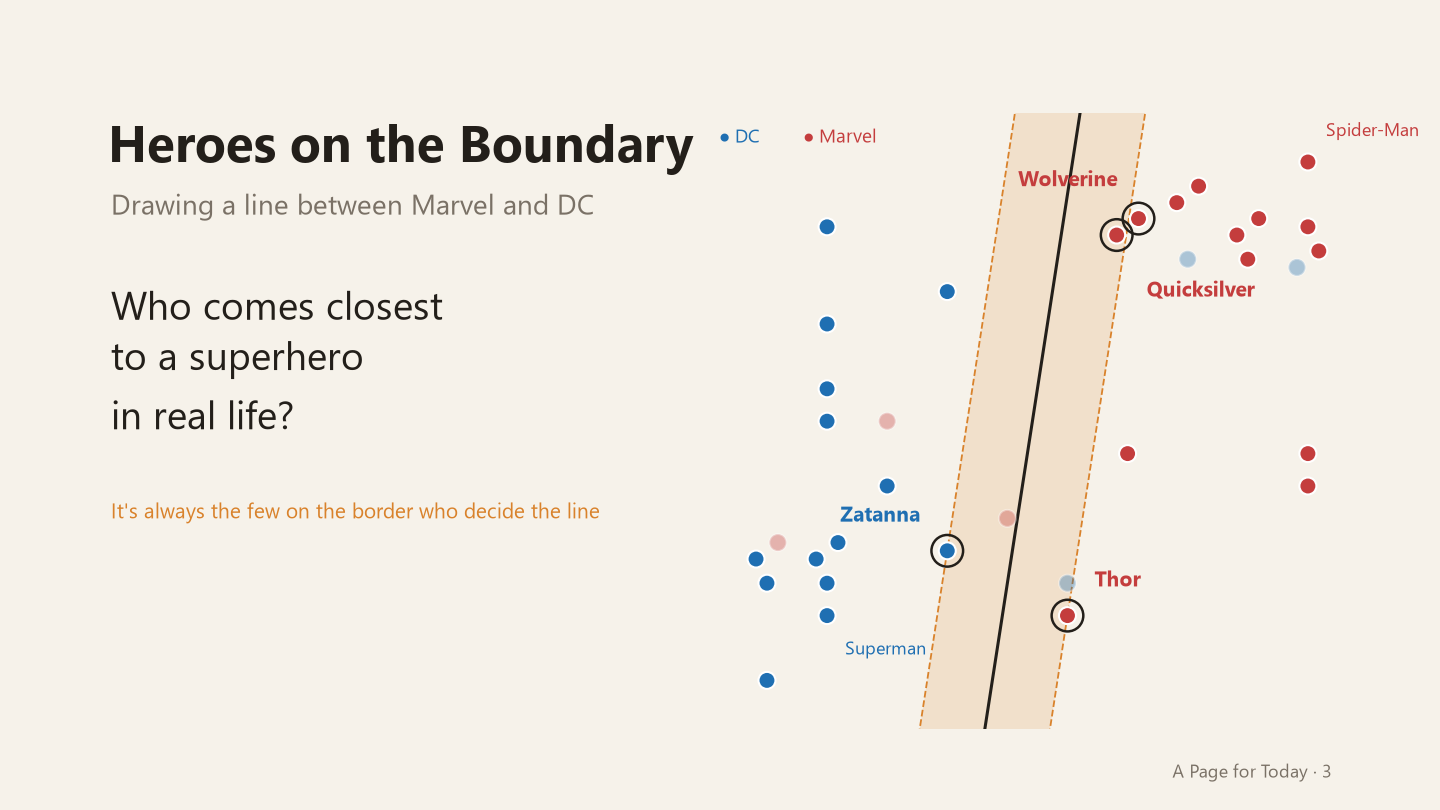
The horizontal axis is setting realism, the vertical axis is humanity (troubles score minus mythic-ness score). The left chart shows the widest possible path drawn using only the 28 heroes left after temporarily setting aside the six border-crossers. Here an interesting property of SVM shows up: only the points perched on the edge of the path decide where the line goes. These are called support vectors. In this chart there are four: Zatanna, Thor, and Quicksilver and Wolverine, who land at the exact same score and overlap at one spot. Send Superman flying even further away, or move Spider-Man to the middle of Manhattan — the line doesn't budge. Not the strongest hero, not the most popular one, but these four standing right on the border are the ones who set the boundary.
Real-world data rarely splits this cleanly. As the right-hand chart shows, once all 34 heroes are included, no straight line can separate the two groups perfectly. In 1995, Corinna Cortes and Vapnik added some leeway. A few heroes are allowed to drift inside the path or even cross to the other side — but they're penalized in proportion to how far they cross. Weight the penalty heavily, and the path narrows, with the line becoming sensitive to every individual point. Weight it lightly, and the path widens, with the line only tracking the big picture. This approach is called a soft margin, and it's the form most SVMs take today.
If a straight line truly won't do, there's also a way to bend the space itself. In 1992, Bernhard Boser, Isabelle Guyon, and Vapnik added the "kernel trick." A boundary that needs a curve in a flat plane often turns out to be separable by a flat plane after all, once you add one more dimension. It's a bit like scattering mixed-up marbles on paper up into the air and separating them by height.
This is hard to picture from words alone, so I built something you can try with your own hands.
A few things are worth trying. First, drag a hero with no circle around it — Superman or Spider-Man, say — far away. The line won't move. Now try nudging the circled Thor one step to the left instead, and the line tilts to follow. Next, turn off "Drop the six": no straight line can separate everyone anymore, and ✕ marks appear on the wrong side of the line. Lower "Leniency C" here and the path widens, and a crowd of heroes suddenly gets circled as support vectors. Finally, hit the "Power×Good" button — nearly thirty heroes become support vectors. When the boundary is unclear, almost everyone gets a say in where the line falls. Turn on both the PCA and LDA arrows together, and you can see with your own eyes that the direction of widest spread and the direction of best separation are not the same thing.
Machines That Draw Lines in Reality
Splitting Marvel from DC is just a game, but the same math draws serious lines every single day.
Companies that will go bankrupt, and companies that will hold on. In 1968, Edward Altman of NYU gathered the financial statements of 66 manufacturing firms — half had gone bankrupt, half were healthy. Using Fisher's discriminant analysis, Altman found the axis that best separated the two groups. What came out of it is still used today: the Altman Z-score.
| Financial ratio | Weight |
|---|---|
| Working capital ÷ total assets | 1.2 |
| Retained earnings ÷ total assets | 1.4 |
| Operating income ÷ total assets | 3.3 |
| Market value of equity ÷ total liabilities | 0.6 |
| Sales ÷ total assets | 1.0 |
Multiply the five ratios by their weights and sum them: above 2.99 is safe, below 1.81 is at risk. The space in between is called the gray zone — Altman's boundary, like an SVM's, had width to it. The score correctly flagged most companies a full year before they went bankrupt.
A map of Europe drawn from genes. In 2008, John Novembre's research team ran PCA on about 200,000 genetic markers from the genomes of 1,387 Europeans. No one told the algorithm which country anyone was from. Yet when people were plotted along the first and second axes, the points arranged themselves into the shape of the map of Europe — Italians clustered where the boot-shaped peninsula would be, Scandinavians gathered up top. A PCA that never saw the answer found the widest directions of spread, and those directions turned out to be north-south and east-west. It's the same thing that happened with today's heroes, where PCA found gods versus humans.
Two ways to recognize a face. In 1991, Matthew Turk and Alex Pentland used PCA on face photographs to create "eigenfaces": thousands of face photos got summarized by a handful of directions of widest spread, and that summary was used to identify who was who. But there was a problem — the same person's photo changes drastically under different lighting, and the direction of widest spread ended up tracking lighting rather than identity. In 1997, Peter Belhumeur's team answered with "fisherfaces," built on LDA. By finding the direction that widens the gap between different people while narrowing the gap between different photos of the same person, the system made far fewer mistakes even as lighting and expression changed. The difference between PCA, which looks at spread, and LDA, which looks at separation, showed up directly in face recognition.
Zip codes and spam mail. When Cortes and Vapnik unveiled the soft-margin SVM in 1995, their testbed was handwritten digits from the U.S. Postal Service — a machine had to read zip codes scrawled every which way on envelopes. A few years later, the same method was applied to filtering spam, drawing a line between ads and letters in your inbox. In both cases, it wasn't the easily-read digit or the obvious ad that decided the line — it was the digit that could be a 1 or a 7, the mail that could be spam or a real letter. In other words, the things standing right on the border.
The People Who Draw Lines
Looking back, heroes and classifiers grew up in the same era.
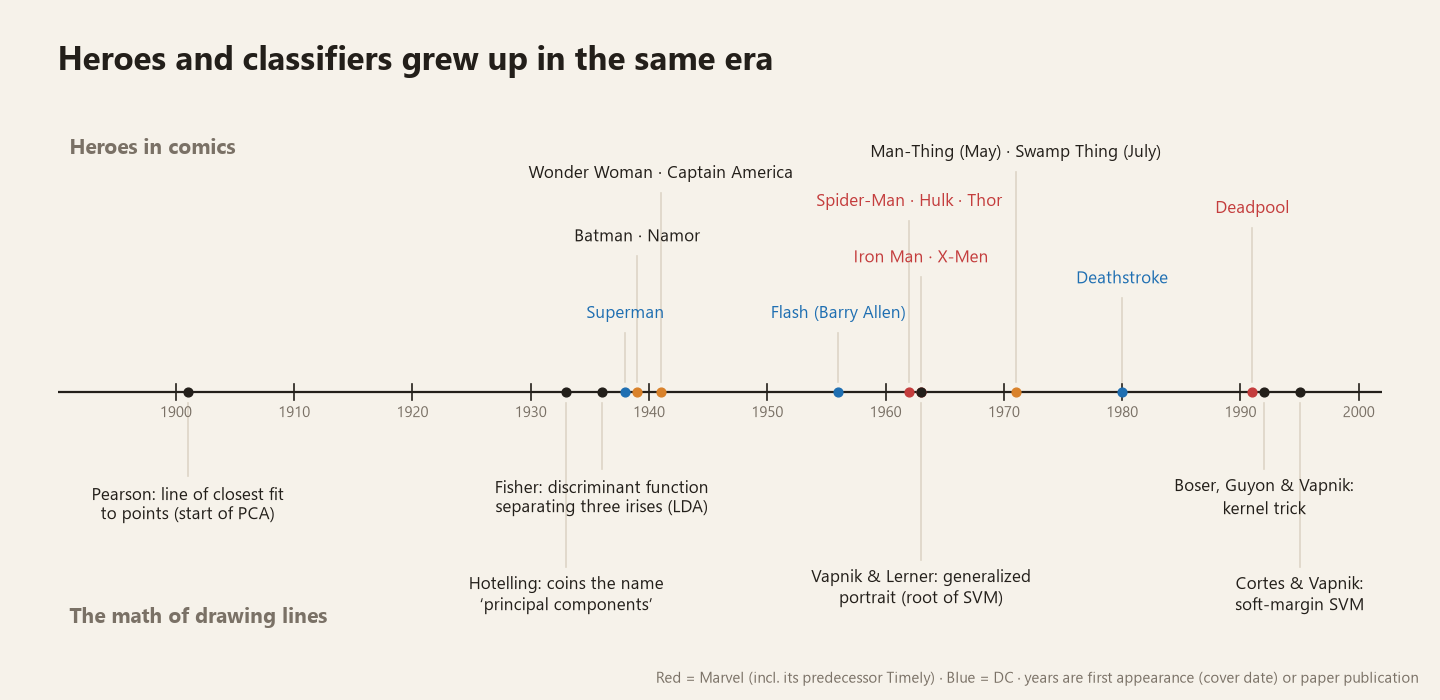
In 1936, the year Fisher was separating irises, two young men in Cleveland named Jerry Siegel and Joe Shuster were making the rounds of publishers with a hero who'd been rejected for years. When that hero debuted as Superman in 1938, the two sold the rights for 130 dollars. In 1963, the year Vapnik was finding the widest path in Moscow, Stan Lee and Jack Kirby introduced the X-Men in New York, and Iron Man debuted that same year. One side was drawing a person the world had never seen; the other was drawing a line the world had never seen.
Of course, none of these people were flawless. Pearson and Fisher were both deeply involved in eugenics — Fisher's iris paper itself appeared in the journal Annals of Eugenics. Siegel and Shuster spent their whole lives fighting over their share of the hero they created. It was Marvel, after all, that taught us heroes have flaws too, so perhaps this isn't so strange.
Back to the question from the notebook: who comes closest to a superhero in real life? Today's answer is this — the people who make something that didn't exist before. The young men who first drew a flying man on paper; the mathematicians who found a line no one else had seen, hidden among a tangle of points. Their power wasn't strength, but imagination. And as SVM shows us, it's always the people standing on the border who decide where the line falls — standing at the edge where art meets science, where two worlds touch, drawing a line no one has drawn before. To my mind, that makes them the real heroes.
That's how A Page for Today keeps going: open the notebook to a random page, and lay that day's thoughts over whatever line is written there. I have no idea what question waits on the next page.
References
- Karl Pearson, "On lines and planes of closest fit to systems of points in space," Philosophical Magazine (1901)
- R. A. Fisher, "The use of multiple measurements in taxonomic problems," Annals of Eugenics (1936)
- Corinna Cortes · Vladimir Vapnik, "Support-vector networks," Machine Learning (1995)
- Edward I. Altman, "Financial Ratios, Discriminant Analysis and the Prediction of Corporate Bankruptcy," Journal of Finance (1968)
- John Novembre et al., "Genes mirror geography within Europe," Nature (2008)
- Peter N. Belhumeur et al., "Eigenfaces vs. Fisherfaces: Recognition Using Class Specific Linear Projection," IEEE TPAMI (1997)
- Photos: Karl Pearson · Ronald Fisher · versicolor iris (U.S. Fish and Wildlife Service), all public domain (Wikimedia Commons)
- All 34 heroes' scores can be seen in the interactive chart above by pointing at a dot. Six of the scores are my own judgment calls; only the year of first appearance is factual data