Fines Are the Size of a Cell
Turn the grinder dial and the large peak of ground coffee follows, but the fines peak near 30–40 µm stays where it is. The cells of a roasted bean are 20–45 µm across, the same size as that peak. In a cell-tissue model that only assumes cells along a crack fall away, the fines peak stayed at the cell size as the gap changed, and vanished when the cells were removed. The amount of fines roughly followed cell size ÷ gap. With a simulation you can grind yourself.
In the last piece I put a single coffee bean between two plates and pressed. It first split at 30–60 N, and it didn't turn to powder all at once; it broke piece by piece. This time I look at where those pieces end up when they keep breaking. If you break them all the way down, what is left?
In Part 1, when I measured particles from photos, fines were always the headache. They are so small they show up as a few pixels, they stick together, and they are almost everything if you count by number but very little if you count by weight. Back then I only worried about how to measure them well. But lay several laser-diffraction distributions of ground coffee on top of each other and you notice something odd. Turn the grinder dial and the peak of the large particles moves with it, but the peak of the fines stays in the same place. That is this piece's question. Why doesn't the fines peak move?
The peak that doesn't move when you turn the dial
The figure below shows laser-diffraction distributions of four ground coffees from Italy's illy (Mo et al. 2023). E is for espresso, H for capsules, M for moka pot and F for filter. The same medium-roast Arabica blend was ground to different coarseness.
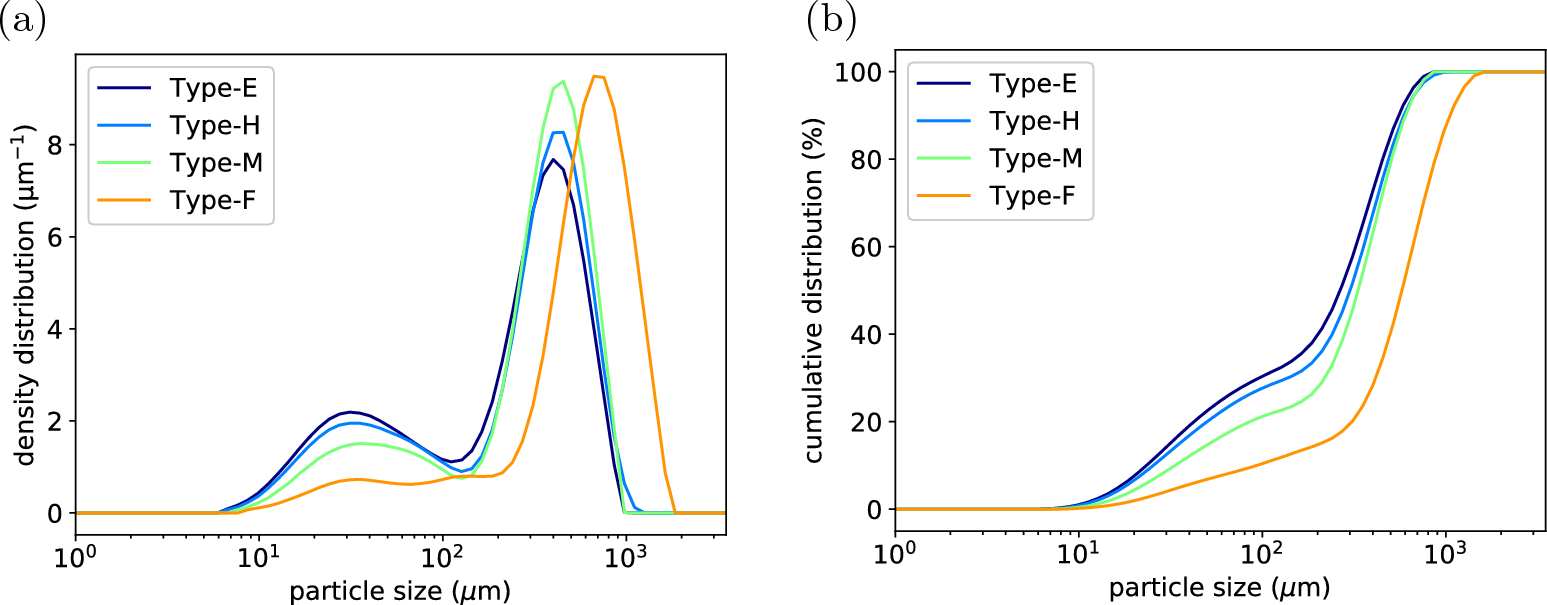
Figure: Mo et al. (2023), Scientific Reports 13:16374, Fig. 3. CC BY 4.0
The large peak moved from about 400 µm for espresso to about 700 µm for filter. The small peak stayed near 30–35 µm in all four, and only its height changed. The volume taken up by particles smaller than 100 µm was 29.2% for espresso, 27.5% for capsules, 20.3% for moka and 9.7% for filter.
Other studies show the same picture.
| Study | What changed | Fines peak | Large peak |
|---|---|---|---|
| Cameron et al. 2020 | Same grinder (EK43), setting 2.5 → 1.0 | About 50 µm at all four settings | About 420 → 270 µm |
| Mo et al. 2023 | Same beans, four grind sizes | About 30–35 µm in all four | About 400 → 700 µm |
| Moroney et al. 2019 | A fine and a coarse grind (different grinders and beans) | About 28 µm in both | About 550 / 950 µm |
| Harper et al. 2024 | Same setting, light vs dark roast | About 50 µm in both | About 310 / 280 µm |
| Eiermann et al. 2020 | 43 commercial capsules | Usually about 50 µm | 250–550 µm |
Peak positions are read from the papers' figures.
Cameron et al. (2020) put it this way: as the grind setting gets finer, "the proportion of fines increases, but their size remains constant." Eiermann et al. (2020), who measured 43 capsules, summed it up as the two peaks staying put and only changing in height.
The peak positions in the table spread from 25 µm to 50 µm because the instruments and the way the curves are drawn differ. What they all share is that within one paper, changing the setting barely moves the peak. How you weight the particles matters too. As we saw in "Count by Number or by Volume," counting the same powder by number pushes the peak much smaller. Uman et al. (2016) measured a number-weighted peak of 13–14 µm and a surface-weighted peak of 27.4 µm in the same EK43 grounds. The "30–40 µm peak" in this piece is the peak of the volume-weighted distribution.
The size of a single cell inside the bean
Look inside a bean and you can guess where the number 30–40 µm comes from.
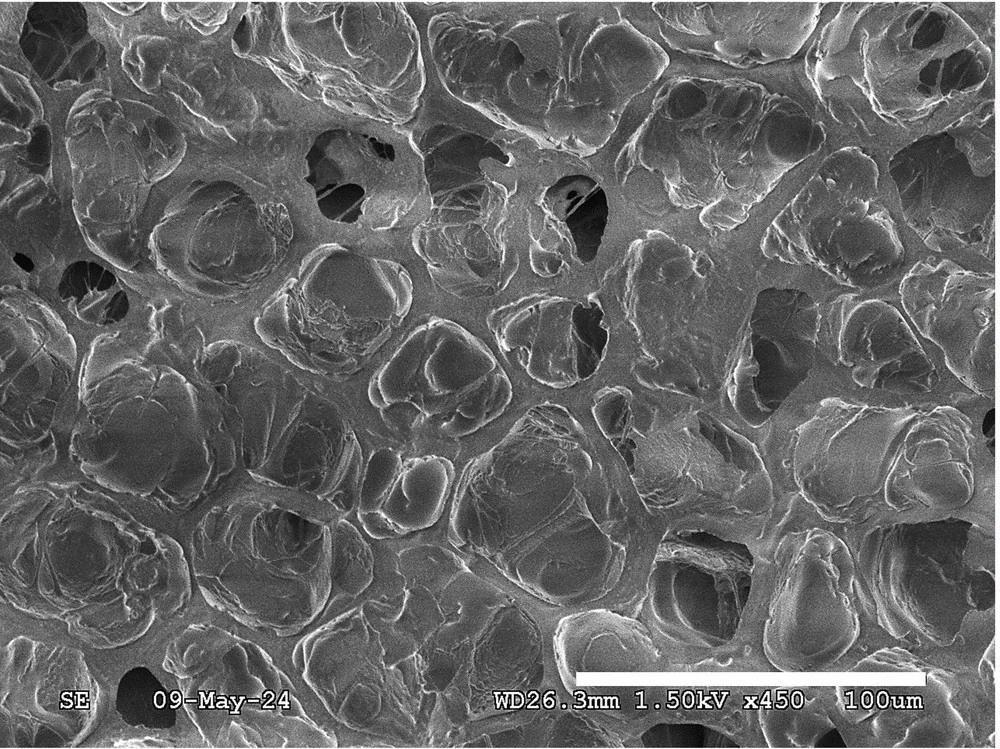
Figure: Lindsey et al. (2024), Scientific Reports 14:28831, left half of Fig. 3. CC BY 4.0
This is a scanning electron micrograph of a roasted bean that was split open (Lindsey et al. 2024), from a paper on how roast degree affects caffeine extraction. Each hole is one cell. During roasting the water and contents inside the cells escape or get pushed toward the walls, so the middle of each cell is empty. Schenker (2000) at ETH Zürich called these "excavated cells" and wrote that the cell-wall skeleton is the structure that holds out longest during roasting.
Each study measures cell size a little differently.
- The empty space inside the cells that Lindsey et al. (2024) measured from their images was about 230–630 µm² in area, larger for darker roasts. As circles of the same area, that is 17–28 µm across
- From the cell density in the same paper, the spacing between cell centres works out to about 33–45 µm. That is the empty space plus the wall thickness
- Mo et al. (2023) give the cell size as 25–50 µm
- Kazi and Clifford (1985), cited by Schenker (2000), reported an average cell size in roasted beans of 21–23 µm for regular roasting and 34–40 µm for high-yield roasting, which puffs the bean up more. I couldn't find the original
In short, the cells of a roasted bean are about 20–45 µm across. That is the same range as the fines peak, 25–50 µm.
In terms of scale: taking a cell to be 35 µm across, about 29 cells line up along 1 mm. A single large particle in espresso grounds (about 300 µm) holds several hundred cells. A whole bean holds roughly a few million. A large particle is a lump of hundreds of cells stuck together; a fine is a single cell or a piece smaller than one.
I never found a number for the cell-wall thickness. Schenker (2000) only describes the walls of coffee endosperm cells as "unusually thick." From the micrograph above, the walls look a few µm thick. In green coffee there are no gaps between cells, and the walls are mostly thick secondary walls (Schenker 2000).
Where do fines come from?
Here is how researchers explain why fines are cell-sized. Moroney et al. (2019) described the fines peak as small flakes made of coffee cell-wall fragments broken during grinding, and wrote that its position is the typical size of a coffee cell. Mo et al. (2023) also wrote that "the fines are cell fragments." Cameron et al. (2020) said fines are "thought to" form at fracture interfaces.
But this is an explanation, not a confirmed fact. I couldn't find a peer-reviewed study that looked at fines one by one under a microscope and showed they are pieces of cell wall. Moroney et al. didn't cite a source for that sentence either.
There is some indirect evidence. Uman et al. (2016) wrote that hitting a cold bean once with a hammer produced only a few small particles. That suggests most fines come not from the first crack but from pieces breaking again and again inside the burrs. In the split-surface micrograph above, the empty insides of the cells are visible, open, in rows. If the crack had run between the cells, we would see their outer surfaces. In a roasted bean split by hand, the crack seems to have cut across the cells, breaking their walls. That is my own reading of the image.
Something similar happens in other plant materials. Wheat flour has a two-peaked size distribution, and the smaller peak comes from the size of the starch granules inside the wheat endosperm (around 10 µm). A unit made by the living plant sets the position of the small peak. Grind dry raw chickpeas and the cells break, but cook them first to weaken the glue between cells and then grind, and you get a "cellular flour" of whole cells that have come apart. Whether a crack cuts across cells or runs between them depends on the state of the material.
A model that breaks a tissue of cells
So I wanted to check: does the mere presence of cells pin the fines peak to the cell size? To test that, there's no need to predict exactly how cracks travel. I started with a very simple model.
- Fill a 2 mm square slice of bean with cells. Scatter seed points evenly, and for every pixel find the nearest seed to build the cells (a Voronoi partition). The mean cell diameter is 35 µm, with about 30% variation
- Any piece larger than the gap is split in two by a single straight crack in a random direction. Pieces near the gap size may, by chance, get split once more
- The single layer of cells along the crack is crushed with a set probability. A crushed cell falls out of the piece and becomes a fine. When a hollow cell breaks it scatters into wall pieces, and I took each such piece to be about the size of one face of the cell
- The remaining cells are divided between the two sides of the crack, and each connected cluster becomes a new piece. Repeat until every piece is smaller than the gap
Volume is counted by area in the slice. The fraction of a slice's area that a component occupies equals its volume fraction (Delesse's principle). The only number I set by hand in this model is the "crushing" probability, and I fitted it to the four powders of Mo et al. (2023). Treating the large-peak position as the gap and comparing the volume below 100 µm, the best fit was 11%. With that, the model gives 25%, 23%, 23% and 13% for the measured 29.2%, 27.5%, 20.3% and 9.7%.
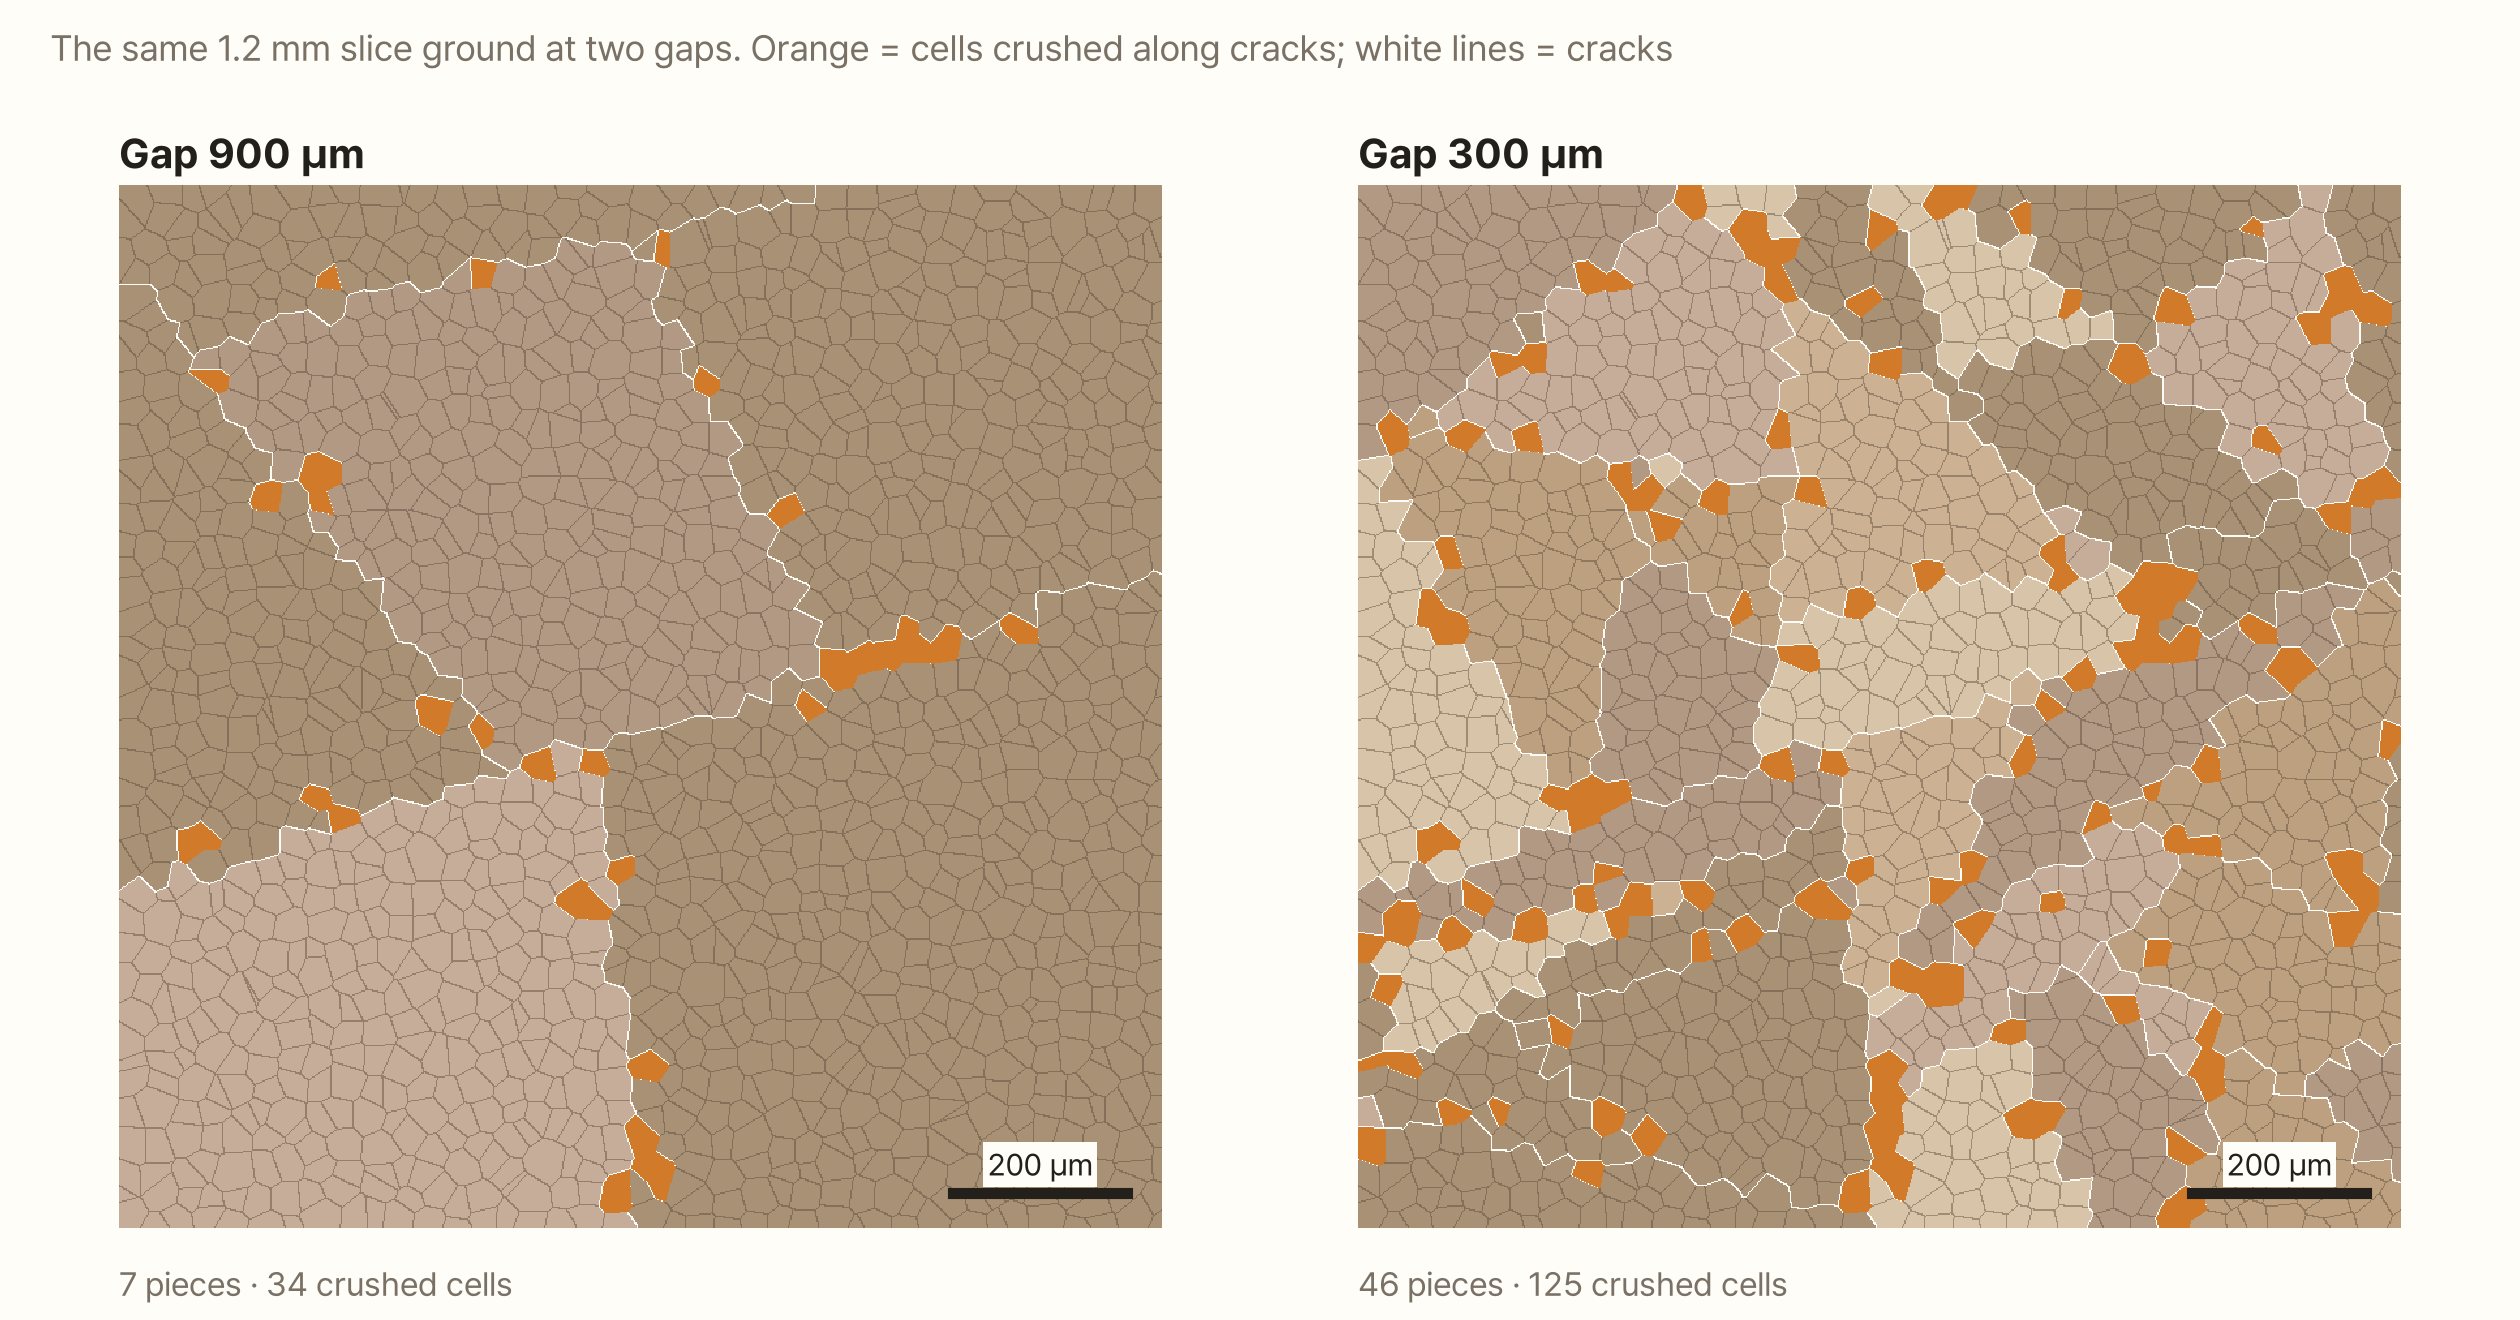
Narrow the gap and there are more cracks; more cracks mean more crushed cells. But the size of each crushed cell is the same whatever the gap.
Gap, cells, and a material without cells
I ran the model under several conditions and drew the distributions, grinding five slices for each condition and adding them up.
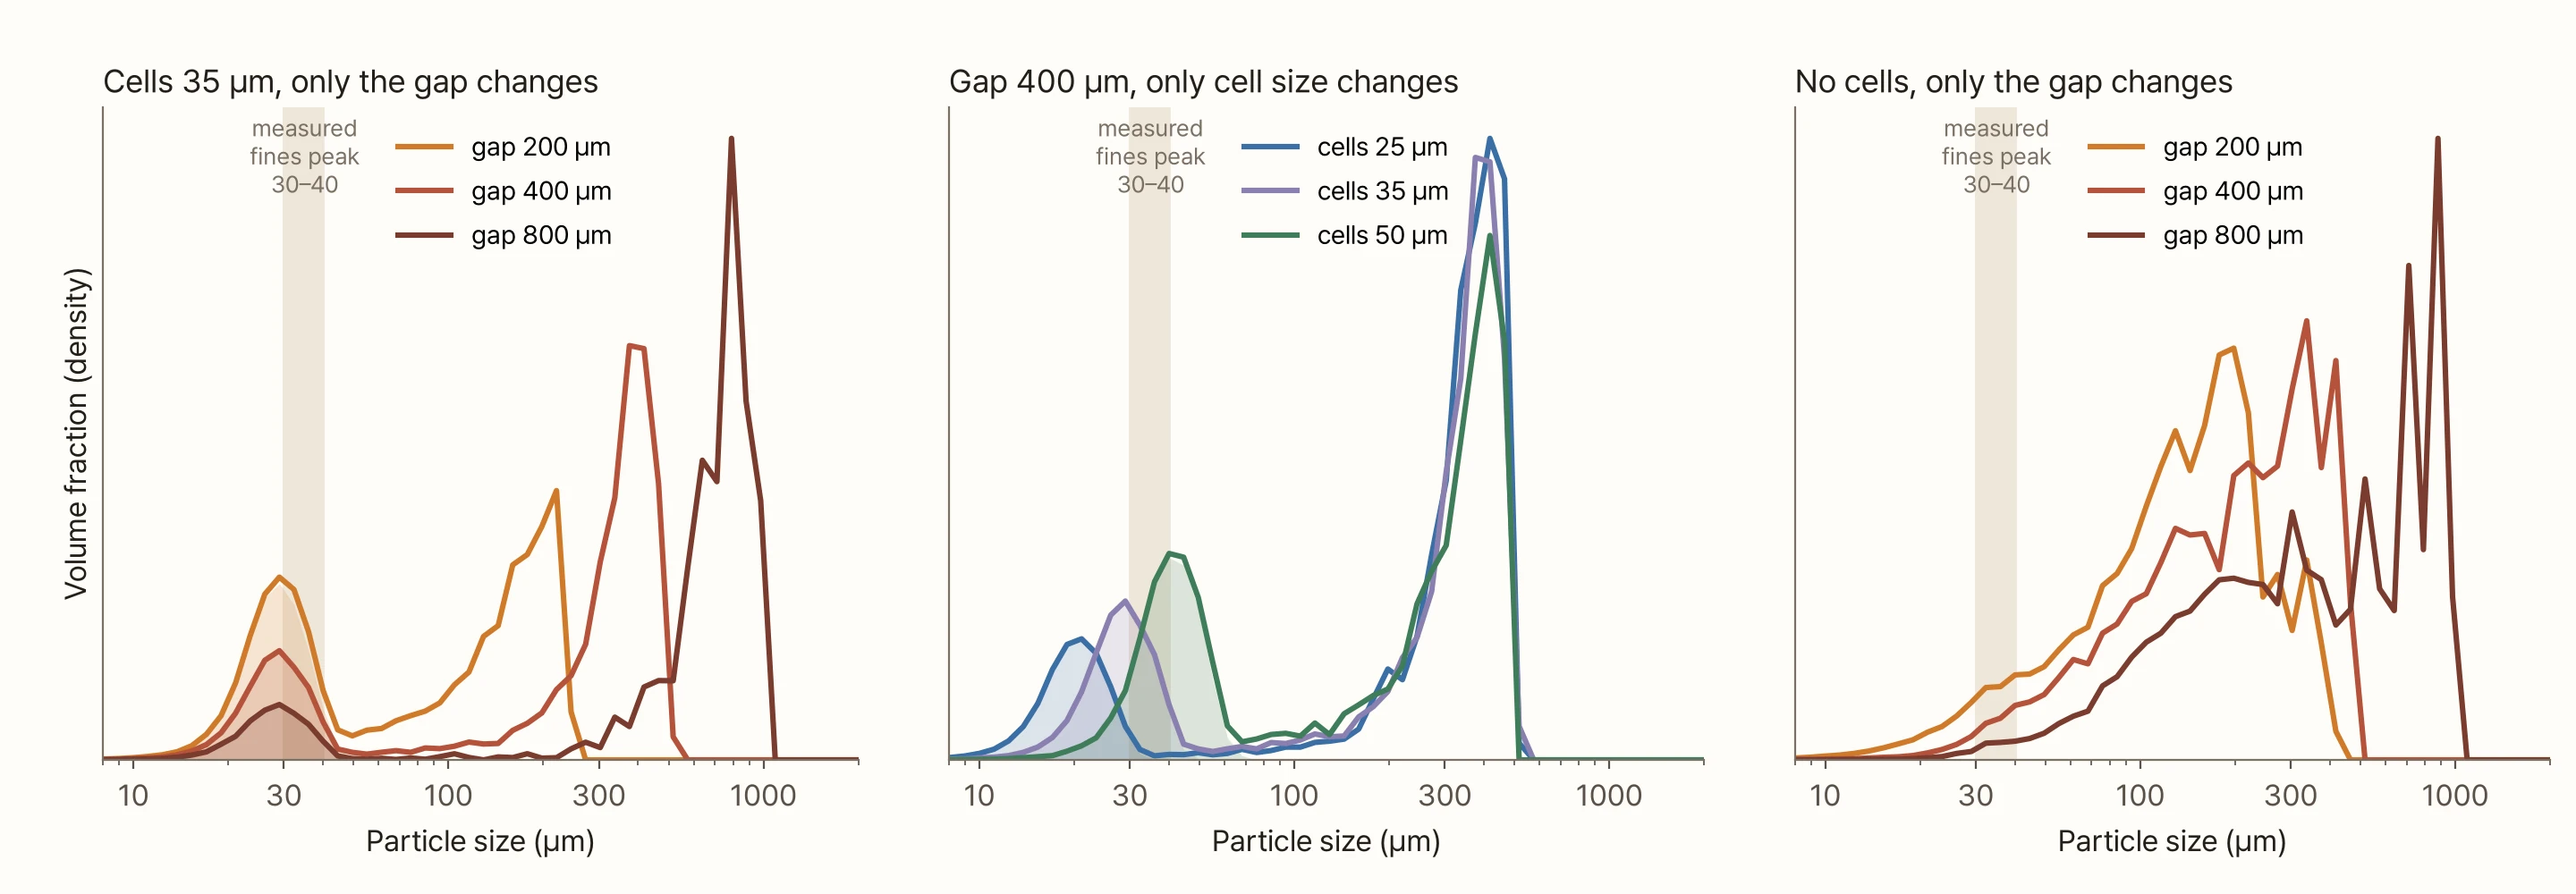
Each graph says one thing.
- Change only the gap (left) and the large peak follows the gap from 220 µm to 800 µm, while the small peak sits at about 29 µm in all three cases. Only its height changes. That is what the measured figure looks like
- Change only the cell size (middle) and the small peak follows the cells to 21, 29 and 40 µm, while the large peak barely moves
- Remove the cells (right) and the small peak disappears
The right-hand graph needs explaining. A material without cells has no length of its own. Then the width of the band crushed along a crack, and the largest size of the debris, can only scale with the size of the piece being broken. So in this case I set the band width and the debris size to 12% of the piece size, and split the debris with the Schuhmann distribution commonly used in mineral grinding. Debris then comes out large when the piece is large and small when it is small, and the result doesn't gather in one place.
For the fines peak to stay in one place, that length has to be built into the material. In coffee, that length is the cell. That's as far as the model goes. Assume there are cells and that cells along a crack fall away whole or as wall pieces, and that alone gives the same shape as the measurements.
The amount of fines follows cell size ÷ gap
The cells set where the peak is. Then what sets its height, that is, how many fines are made?
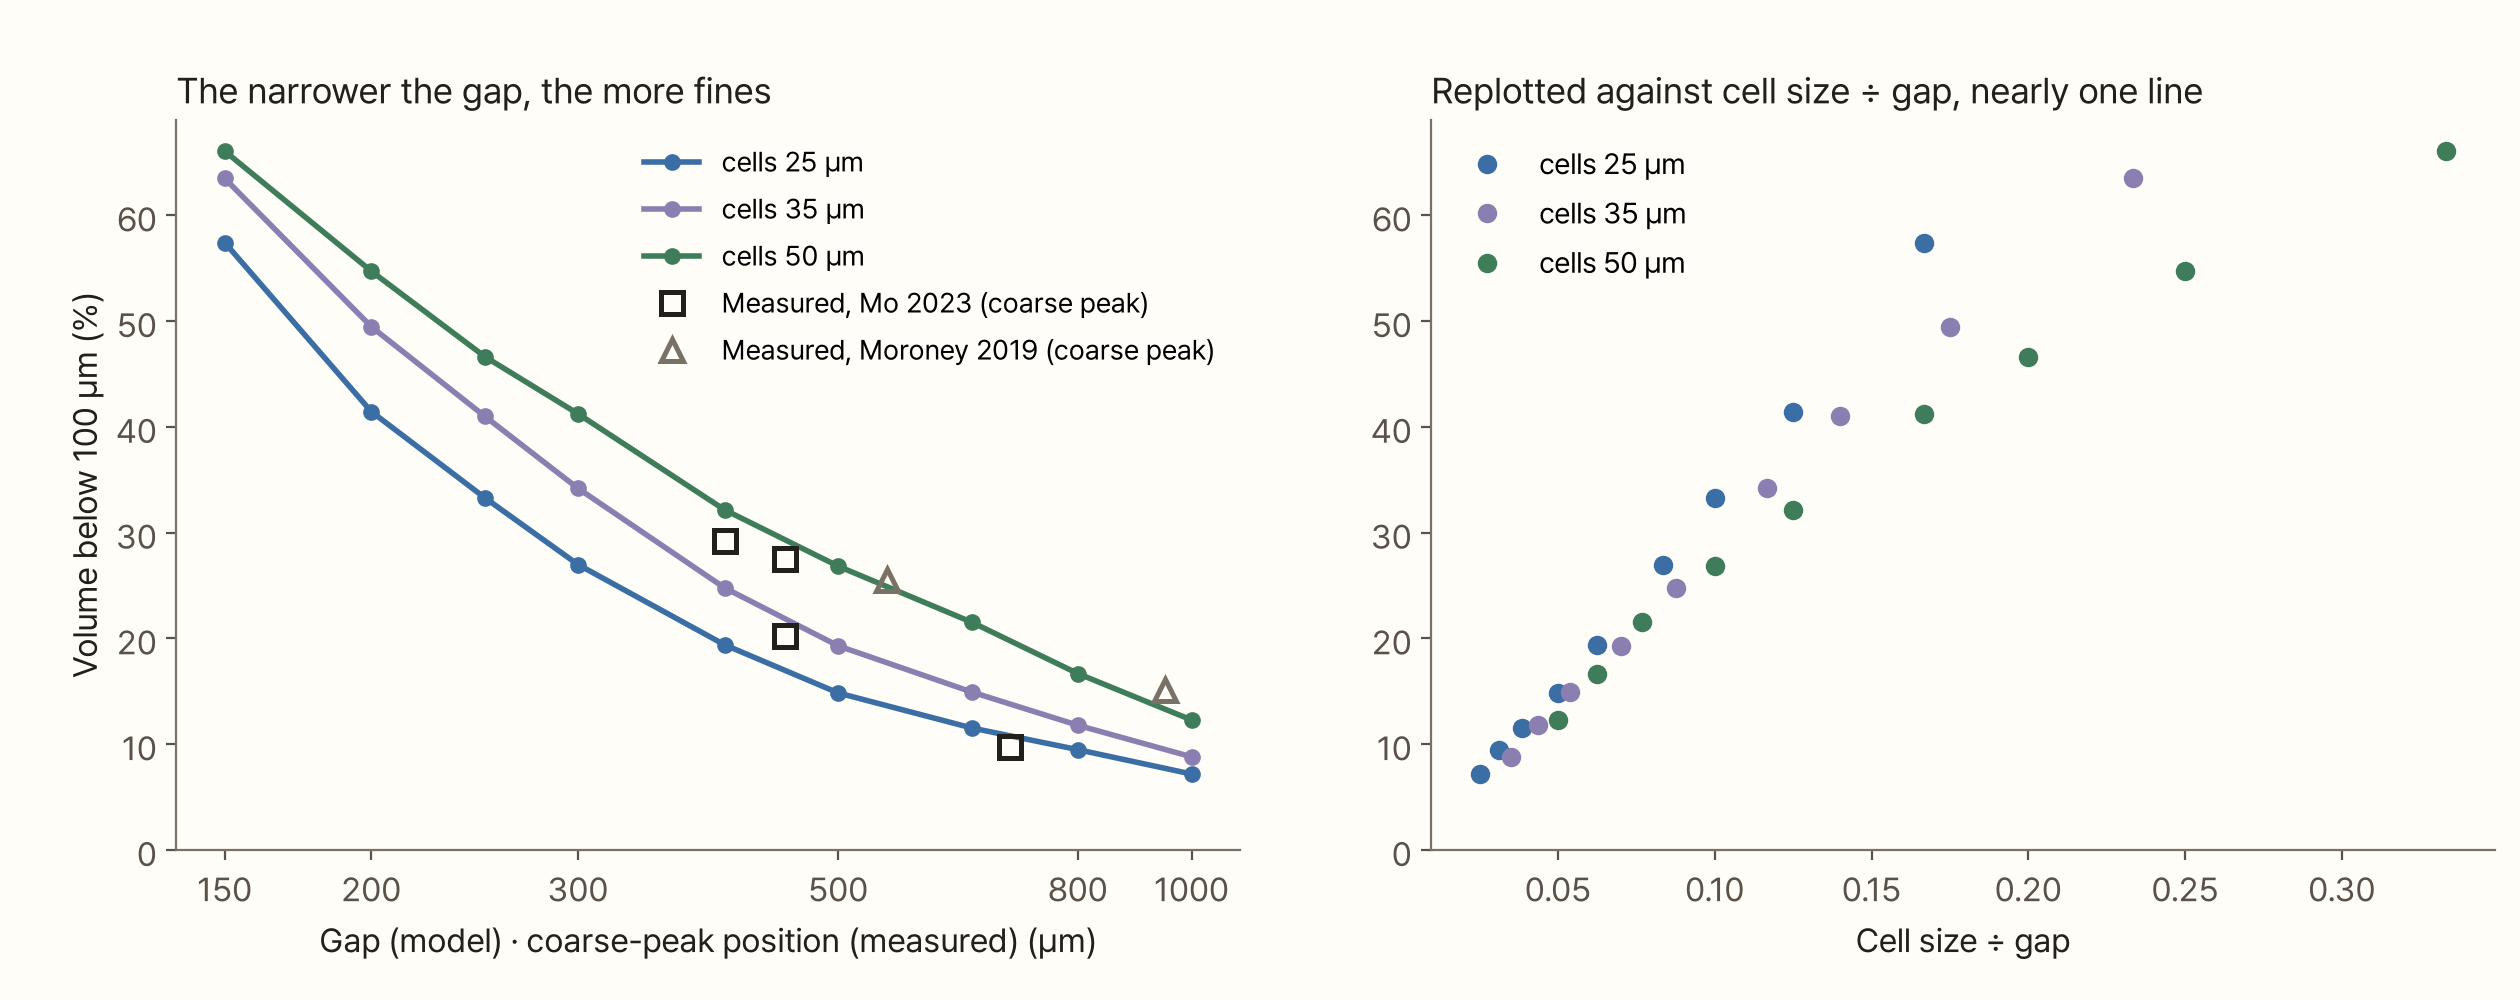
In the model, fines are made along cracks. Each crack that runs through puts one layer of cells at risk. The length of crack needed to cut pieces down to the gap size scales roughly with "area ground ÷ gap," and the volume crushed along that crack is that times the thickness of one cell layer. So the share of fines roughly follows "cell size ÷ gap."
In the left graph, the 35 µm-cell model has 25% of its volume below 100 µm at a 400 µm gap and 12% at 800 µm. Double the gap and the fines nearly halve. Replot against cell size ÷ gap, as on the right, and the three curves nearly collapse onto one line below 0.1. Grind finer than that and the pieces themselves are only a few cells, and the rule of thumb stops working.
As for the measured points: the four powders of Mo et al. (2023) are what the "crushing" value was fitted to, so of course they match. The interesting ones are the two powders of Moroney et al. (2019). They weren't used for fitting, yet they land near the 50 µm-cell curve. Given the different grinder and beans, I take that as the shape being right.
This relationship leads to one prediction. At the same gap, beans with larger cells should make more fines. Lindsey et al. (2024) found that the empty space in the cells grows with darker roasts. Several observations say dark roasts grind finer at the same setting. But Harper et al. (2024) saw the large peak move smaller for the dark roast, and the Royal Coffee experiment (2021) measured mass below 400 µm. Neither compared the amount of 30–40 µm fines directly. I couldn't find a study that measured cell size and the amount of fines on the same beans. For now, this prediction is the model's estimate.
Try it yourself
Grind a tissue of cells yourself below. The top picture is the cell tissue of a 2 mm slice. White lines are cracks and orange cells are crushed cells. "Fines only" hides the pieces and leaves only the fines. The bottom graph is the volume distribution of four slices added together. Orange bars are dust from crushed cells, and grey bars are pieces split by cracks. The pale band is the cell size you've set, and the blue dashed line is the gap.
Change the gap from 150 µm to 1,000 µm and only the grey peak moves; the orange peak stays put. Change the cell size and the orange peak follows. Switch to "No cells" and the orange spreads out and the peak disappears.
What this conclusion leaves out
- That fines are cell fragments is still an explanation. I couldn't find a study that imaged fines directly and showed they are pieces of cell wall. The model in this piece only shows that this explanation can produce the same shape as the measurements
- The model is a 2D slice. Real particles are three-dimensional, and the "size" laser diffraction measures differs from a size counted by slice area. Read the trends rather than the numbers
- Cracks are straight lines, and cells are crushed only along cracks. In reality cracks bend along weak spots, and cells will also break where they rub against the burr surfaces. All of that is lumped into the single "crushing" value
- I treated each crushed cell as one fine. Real fines also include wall shards much smaller than a cell, and oil droplets. The wet-measured distribution of Schmieder et al. (2023) had a small peak at 1–2 µm as well, and the number-weighted peak of Uman et al. (2016) (13–14 µm) shrank by 31% when the beans were frozen to −196 °C before grinding. None of that is in the model
- The exact peak position varies between 25 and 50 µm depending on the instrument. This piece only claims that it stays near the cell size and doesn't move
- The cell-wall thickness and the number of cells in a bean are rough. I found no peer-reviewed measurement of wall thickness
- I couldn't include the distribution figure from Cameron et al. (2020) because of copyright. The numbers in the table are read from the figure
Summary
- The volume distribution of ground coffee has two peaks. Turn the dial and the large peak follows, but within a single paper the fines peak always sits in the same place (25–50 µm, depending on the instrument)
- Roasted coffee cells are 20–45 µm across, the same range as the fines peak. During roasting the cells empty out and a skeleton of walls remains
- Several researchers explain fines as cell-wall fragments, but I couldn't find a study that imaged fines directly to confirm it
- Even in a 2D model that only assumes cells along a crack fall away whole, the fines peak stayed at about 29 µm while the gap went from 200 to 800 µm. Change the cell size and the peak followed; remove the cells and the peak disappeared
- The amount of fines roughly followed cell size ÷ gap. Double the gap and the fines nearly halve. The model fitted to Mo et al. (2023) also came close to the two powders of Moroney et al. (2019), which weren't used for fitting
- The prediction that beans with larger cells make more fines at the same gap is not yet confirmed
The grinder dial sets the size of the large particles. It can't set the size of the fines. The coffee plant settled that when it made the bean. All the dial can change is how many of those fines get made.
References
- Mo C, Johnston R, Navarini L, Suggi Liverani F, Ellero M (2023). Exploring the link between coffee matrix microstructure and flow properties using combined X-ray microtomography and smoothed particle hydrodynamics simulations. Scientific Reports 13, 16374. doi:10.1038/s41598-023-42380-y — distributions of four powders, volume below 100 µm, d[3,2] (Table 1)
- Cameron MI, Morisco D, Hofstetter D, Uman E, Wilkinson J, Kennedy ZC, Fontenot SA, Lee WT, Hendon CH, Foster JM (2020). Systematically improving espresso: insights from mathematical modeling and experiment. Matter 2(3), 631–648. doi:10.1016/j.matt.2019.12.019 — Fig. 2B, distributions by setting
- Moroney KM, O'Connell K, Meikle-Janney P, O'Brien SBG, Walker GM, Lee WT (2019). Analysing extraction uniformity from porous coffee beds using mathematical modelling and computational fluid dynamics approaches. PLOS ONE 14(7), e0219906. doi:10.1371/journal.pone.0219906
- Uman E, Colonna-Dashwood M, Colonna-Dashwood L, Perger M, Klatt C, Leighton S, Miller B, Butler KT, Melot BC, Speirs RW, Hendon CH (2016). The effect of bean origin and temperature on grinding roasted coffee. Scientific Reports 6, 24483. doi:10.1038/srep24483
- Eiermann A, Smrke S, Guélat L-M, Wellinger M, Rahn A, Yeretzian C (2020). Extraction of single serve coffee capsules: linking properties of ground coffee to extraction dynamics and cup quality. Scientific Reports 10, 17079. doi:10.1038/s41598-020-74138-1
- Harper JM, Bumbaugh RE, Hendon CH (2024). Strategies to mitigate electrostatic charging during coffee grinding. iScience 27, 110639. doi:10.1016/j.isci.2024.110639
- Schmieder BKL, Pannusch VB, Vannieuwenhuyse L, Briesen H, Minceva M (2023). Influence of flow rate, particle size, and temperature on espresso extraction kinetics. Foods 12(15), 2871. doi:10.3390/foods12152871 — Appendix Fig. A1
- Lindsey ZR, Williams JR, Burgess JS, Moore NT, Splichal PM (2024). Caffeine content in filter coffee brews as a function of degree of roast and extraction yield. Scientific Reports 14, 28831. doi:10.1038/s41598-024-80385-3 — SEM of roasted bean sections, area of empty cell space and cell density (Figs. 3, 7)
- Schenker S (2000). Investigations on the Hot Air Roasting of Coffee Beans. Doctoral thesis, ETH Zürich, Diss. ETH No. 13620 — cell structure; cites Kazi & Clifford (1985) for cell size
- Kazi T, Clifford MN (1985). Proceedings of the 11th ASIC Colloquium, Paris, 297–308 — cited via Schenker (2000), original not seen
- Smrke S, Eiermann A, Yeretzian C (2024). The role of fines in espresso extraction dynamics. Scientific Reports 14, 5612. doi:10.1038/s41598-024-55831-x
- Kornman C et al. (2021). Grinder alignment: an evaluation of consistency, cupping settings, and the impact of roast degree. Royal Coffee blog. link — industry experiment
- Delesse A (1847). Procédé mécanique pour déterminer la composition des roches. Comptes Rendus de l'Académie des Sciences 25, 544–545 — area fraction in a section = volume fraction
- Schuhmann R (1940). Principles of comminution, I. Size distribution and surface calculations. AIME Technical Publication 1189 — debris distribution for the material without cells
Image credits
- First figure: Mo C, Johnston R, Navarini L, Suggi Liverani F, Ellero M (2023), Scientific Reports 13:16374, Fig. 3. CC BY 4.0. Unchanged
- Second figure: Lindsey ZR, Williams JR, Burgess JS, Moore NT, Splichal PM (2024), Scientific Reports 14:28831, Fig. 3. CC BY 4.0. The right half with overlaid ellipses was cropped off; only the left image is used
- Numbers for Cameron et al. (2020) and Harper et al. (2024) in the table: read from the papers' figures. The original figures are not reproduced
- All other figures, the cover and the simulation: made by me