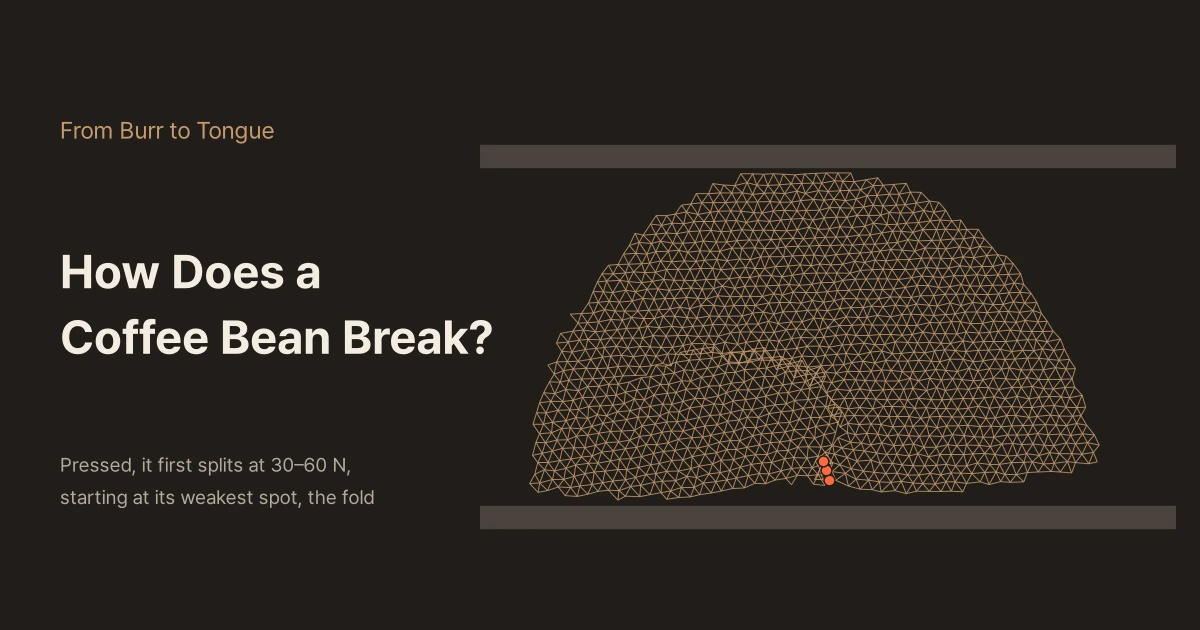
How Does a Coffee Bean Break?
Pressed through its thickness, a coffee bean first splits at 30–60 N after squeezing 6–8% of its thickness, and it breaks in a saw-tooth, piece by piece, not into powder at once. Inside, a roasted bean is a dry foam with a porosity of about 0.5; at 8.8% moisture, the same grinder's main peak moved from 424 µm to 1,949 µm. In a bean-slice model tuned to measurements, most first cracks began at the centre cut. With a simulation you can press yourself, and a look at the weakest-link principle that makes smaller pieces stronger.
For twelve episodes this series looked at coffee that was already ground. We measured particle sizes from a single photo, asked how far those numbers could be trusted, and followed them all the way to differences in taste. From this episode on, the camera turns inside the grinder. The goal is to watch grounds being made.
A grinder dial sets one thing: the gap between two burrs. Yet what comes out of that one gap is an uneven mix, from 30 µm dust to pieces over 1 mm. One gap, many sizes. Why? The answer has to start before burr shape or rotation speed. A burr does not cut a bean like a knife. It presses and strikes it until it breaks, and how it breaks is decided by the material. So the first question of Part 2 is this: how does a single coffee bean break?
Pressing one bean
Nedomová and colleagues at Mendel University in the Czech Republic measured exactly this (2010, 2013). They bought light-roast Arabica from 20 origins, took 20 beans from each, set them between two metal plates and pressed slowly at 20 mm per minute. Each bean was pressed between its flat face (the side with the centre cut) and its rounded back, that is, through its thickness. The beans were 7.6–8.8 mm wide, 4.5–5.1 mm thick and 10.4–11.9 mm long, and weighed 0.12–0.16 g.
Here is what they found.
- The force at the first crack averaged 30–60 N across origins. That is the weight of a 3–6 kg object
- The bean had been squeezed by 0.27–0.38 mm at that point, 6–8% of its thickness
- The work absorbed up to the first crack was 6.4–13.7 mJ
- Within a single lot of 20 beans, the weakest broke at 24 N and the strongest at 73 N. Across five lots, the coefficient of variation was 29–54%
- Strength showed no clear relation to bean size, weight or shape
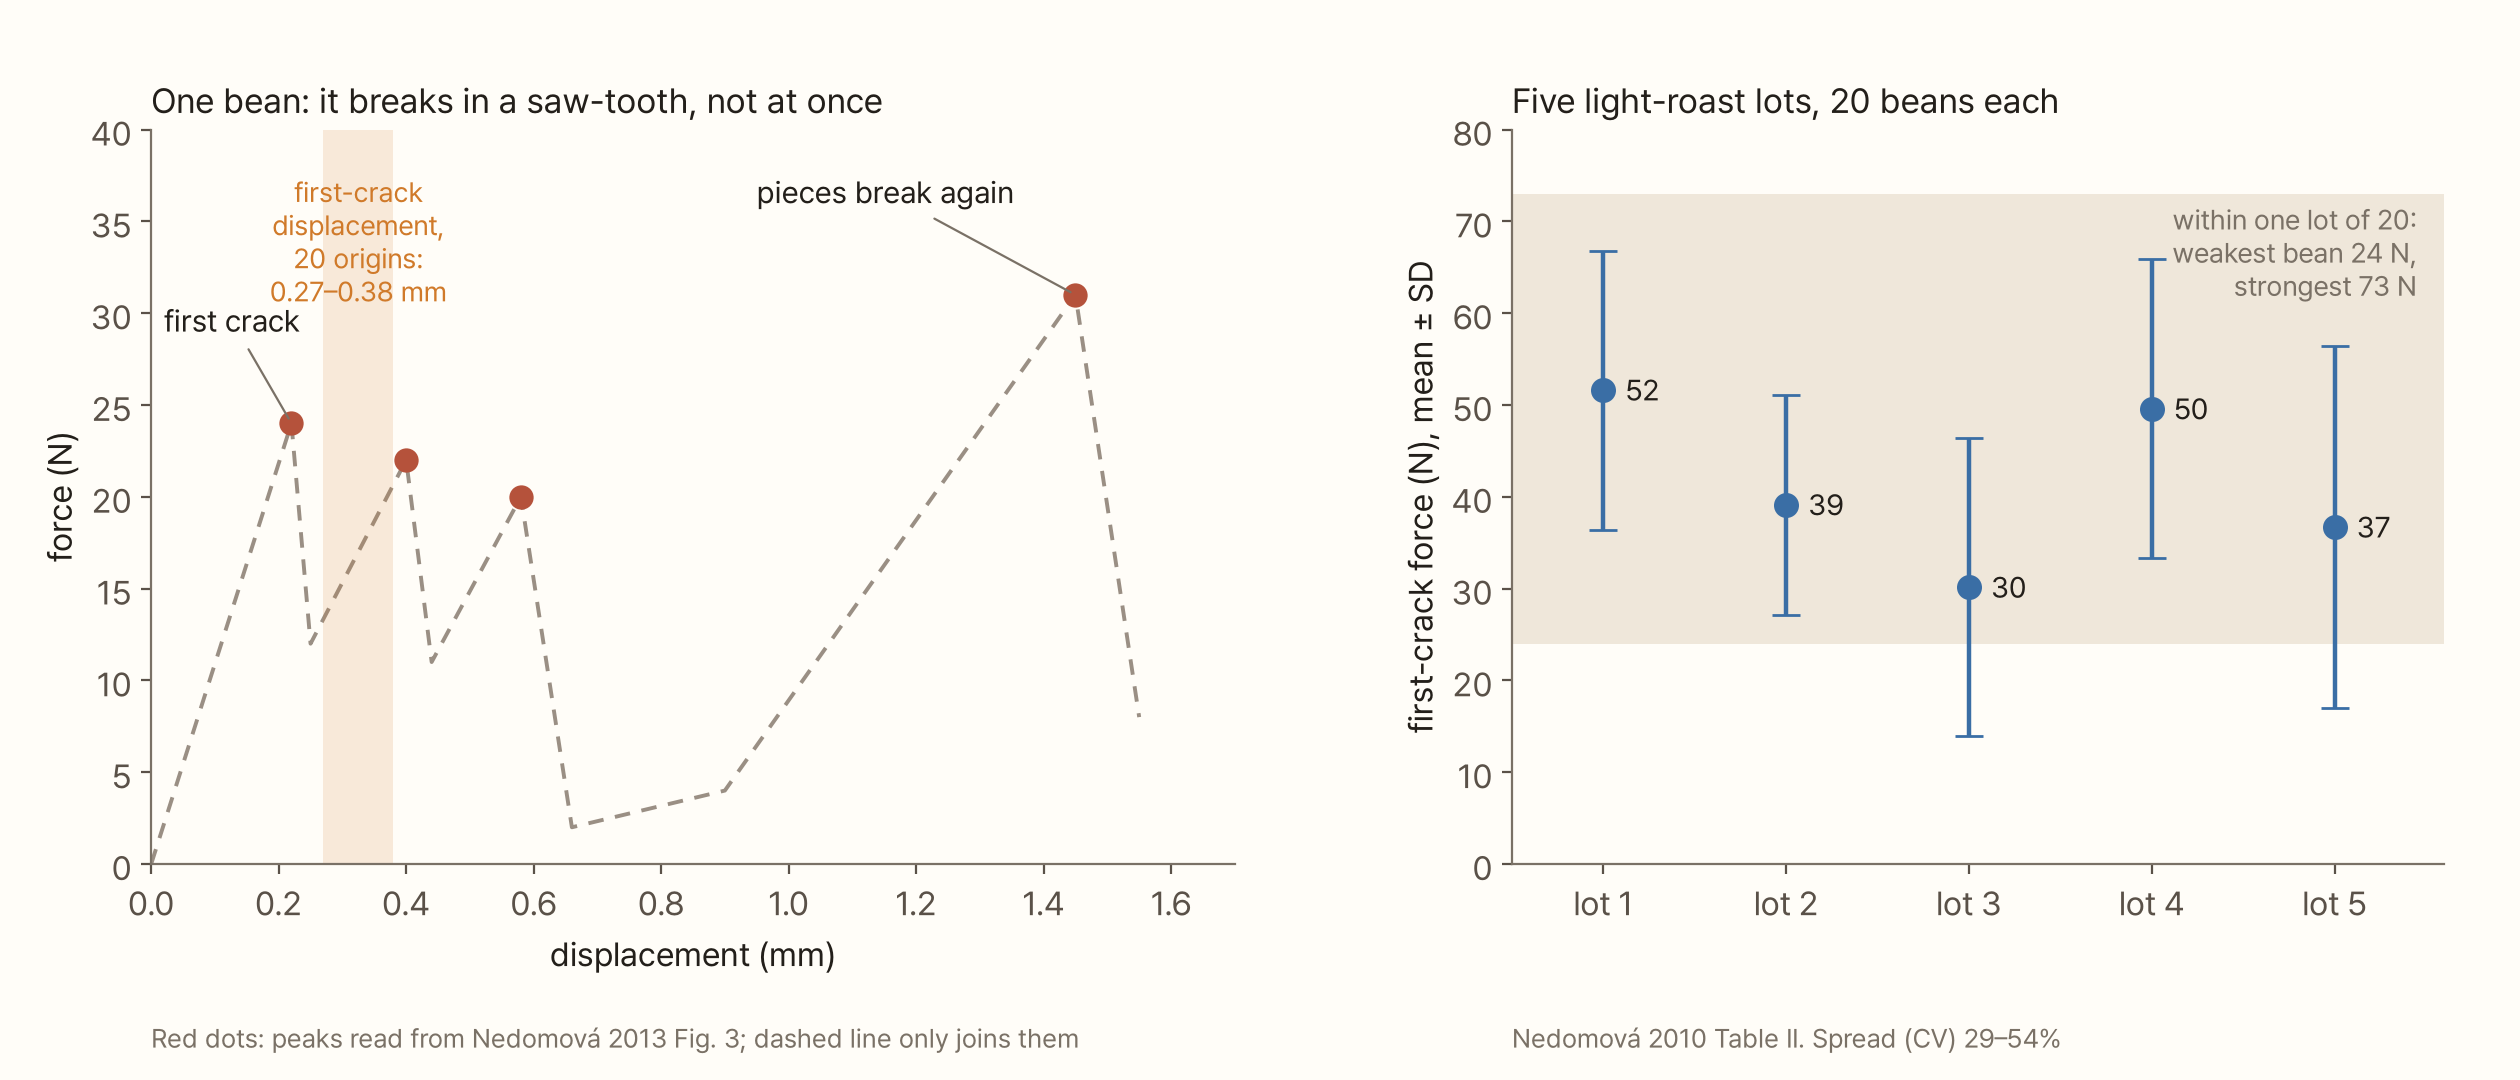
The shape of the force curve is the thing to notice. A bean does not turn to powder in one go. The force climbs, drops sharply at the first crack, climbs again and drops again. The single bean shown in the paper first split at 24 N and 0.22 mm, broke again at 0.4 mm and 0.58 mm, fell almost to zero force, then rose once more to 31 N at 1.45 mm. The authors read the later peaks as "repeated fragmentation of the bean into several pieces". A bean between burrs probably goes down the same way, one split at a time.
The team also ran a drop test, letting a 6 mm × 200 mm aluminium bar fall onto the bean from 3–9 cm. Struck quickly, beans withstood more force. The line fitted across origins was impact strength = 1.30 × static strength − 3.3 N (R² = 0.94), so a bean with a static strength of 45 N would hold about 55 N under impact. Working out the bar's speed at contact gives 0.8–1.3 m/s, thousands of times faster than the static test. Electric grinder burrs are faster still: a 98 mm burr turning at 1,480 rpm (the EK43 setting used by Uman et al. 2016) moves at about 7.6 m/s at its outer edge, by calculation. Why faster loading makes the bean stronger, the paper does not explain.
Inside, a bean is foam
Look inside a roasted bean and the way it breaks starts to make sense. Green coffee is hard and tough; it cannot be ground as it is. In his doctoral thesis at ETH Zürich (2000), Schenker wrote that one aim of roasting is "a dry and brittle texture that makes grinding and extraction possible". During roasting a bean can swell up to twice its volume (Dutra et al. 2001), and its density falls from 1,000–1,200 kg/m³ to 400–600 kg/m³ (Frisullo et al. 2012). We confirmed both numbers as cited in a conference poster by Navarini et al. (2025). Water boiling off inside the cells and gas from pyrolysis inflate the bean from within.
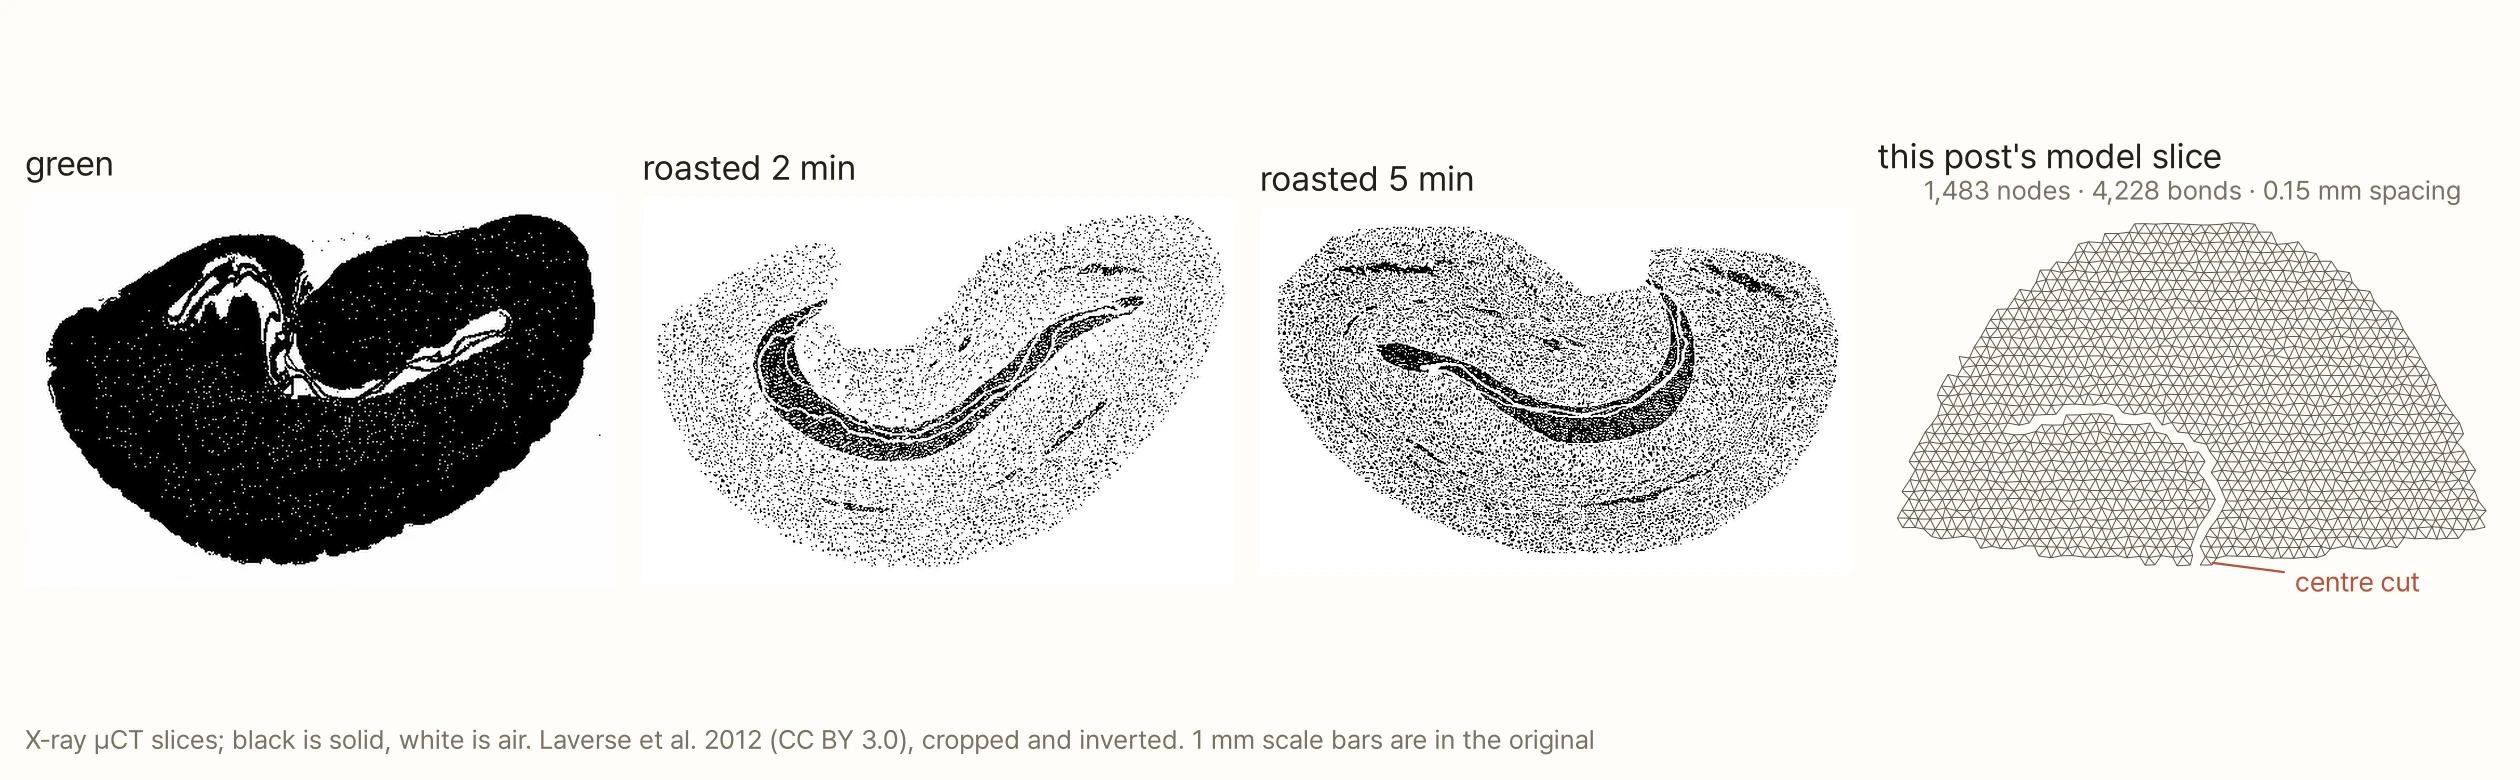
These slices were taken by a group at the University of Foggia in Italy using X-ray micro-CT (Laverse et al. 2012). The green bean is nearly solid; after just two minutes of roasting, air pockets spread across the whole section. In that study the pore volume, not counting the large central slit, grew more than twentyfold, from about 0.06 mm³ in the green bean to about 1.3 mm³ after five minutes.
How porous a bean is depends on how you measure it. Schenker, forcing mercury into the pores, measured a porosity (the share of volume that is empty) of 0.47–0.53. CT gave 23–31% (Cloete et al. 2019). CT cannot see holes smaller than its voxels (20–35 µm), so its numbers come out lower. It is the same story as sieve, laser and camera giving different answers in Part 1.
Even at the same roast degree, the pores differ. Schenker roasted beans two ways so that both lost the same 15% of their weight. Beans roasted fast at 260 °C for about three minutes had a porosity of 0.528 and a density of 622 kg/m³. Beans roasted slowly at 220 °C for 9–12 minutes had 0.474 and 747 kg/m³. The same colour can hide a different foam.
Cell size has been reported at 21–40 µm depending on roast (Kazi and Clifford 1985, as cited by Schenker). Keep that number in mind. The fines peak we kept meeting in Part 1 sits right there.
A dry foam breaks like glass. The cell-wall material of a bean is glassy at room temperature and can shift to a soft, rubbery state with water or heat. Schenker sketched roasting as taking the bean from glass to rubber (swelling) and back to glass. Uman et al. (2016) noted that roasted coffee is so complex a material that "glass or shattering transition points are unlikely to be constant across macroscopic regions of the bean, if present at all".
Longer roasting makes beans weaker. Pittia et al. (2001) reported that beans lose strength and toughness and grow brittle as roasting proceeds, linking this to water loss, pyrolytic changes in structure and falling density. A group in India (Nagaraju and Bhattacharya 2010) likewise found that the maximum force a bean withstands fell with roasting temperature and time. For both papers we could read only the abstract and did not see the force values.
A wet bean grinds coarse
Moisture changes the picture more dramatically. Pittia et al. (2007) equilibrated beans at a range of humidities, setting their water activity (a_w, a 0-to-1 measure of how free the water in the bean is) from 0 to 0.95, and pressed them. A little water actually made the beans stronger and tougher. But once a roasted bean passed a_w of about 0.86, water softened the structure and its characteristic brittleness disappeared. Again, only the abstract was available to us.
In a grinder, the difference is large. Baggenstoss et al. (2008) in Switzerland roasted beans in an industrial roaster to the same colour (L* 22.6–23.5), changing only the amount of quench water sprayed after roasting, to make beans with 2.3–8.8% moisture. They ground them on the same roll grinder at the same setting and measured by laser diffraction.
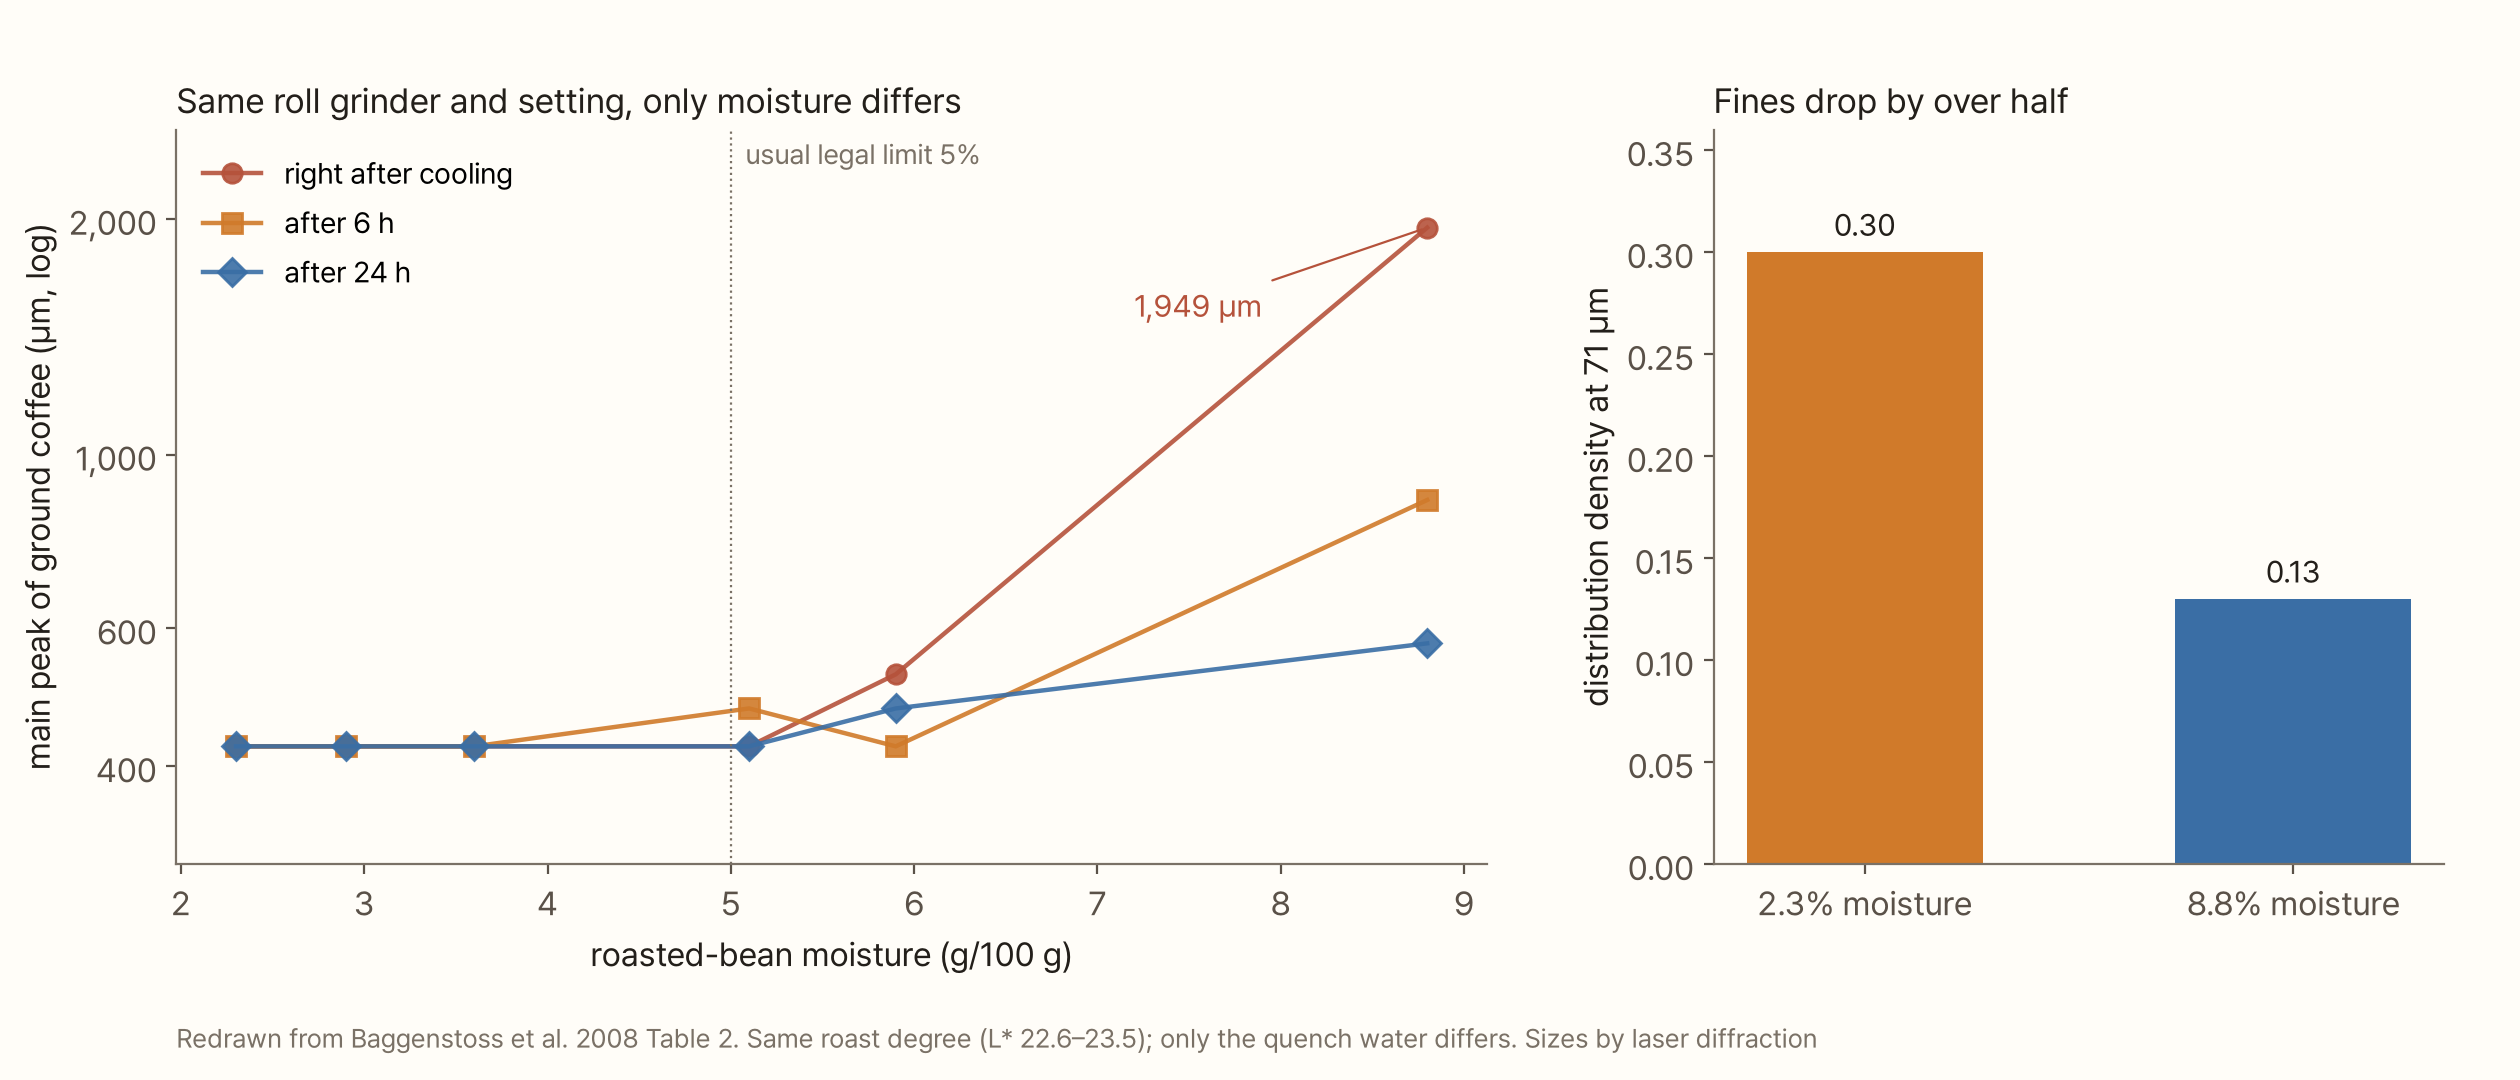
Up to 5% moisture, the main peak of the grounds stayed around 424 µm. Beans at 8.8% moisture, ground right after cooling, put their main peak at 1,949 µm: more than four times coarser from the same grinder at the same setting. Fines at 71 µm fell by over half (distribution density 0.30 → 0.13). The authors wrote that "high water content in roasted coffee leads to less brittleness of coffee beans, and, therefore, more energy is needed to comminute them. The resulting ground coffee is coarser with increasing water content." After 24 hours of rest, letting moisture even out, the peak came down to 574 µm, but beans above 6% moisture still gave unacceptable grounds after 24 hours. Roasted coffee moisture is usually capped by law at 5%.
The beans we buy for home are mostly within that limit. Still, the experiment shows that the grinder dial works together with how hard the bean is. It is one reason the same dial gives different grounds with different beans.
Pressing a model bean
Now let us press one ourselves. With no beans or testing machine at hand, we built a bean cross-section in the computer.
The slice is cut across the length of the bean: 8.2 mm wide and 4.8 mm thick, with a flat face at the bottom and a rounded back on top. Inside it we placed 1,483 nodes 0.15 mm apart and joined neighbours with 4,228 springs. Following the CT slices above, we added a slit that starts at the centre-cut notch on the flat face and curves inward in a C. No spring crosses that slit.
Every spring has a breaking threshold: if it stretches beyond it, it snaps. Thresholds were drawn slightly differently for each spring from a Weibull distribution, the usual way to describe scatter in material strength; the smaller its modulus m, the more uneven the strengths. The default is m = 6. In compression we set the threshold at three times the tensile one, so springs can also be crushed.
We press the way the testing machine does. The flat face rests on the bottom plate and the top plate comes down 0.01 mm at a time. At each step we solve for the equilibrium position of every node; if any spring is past its threshold, we cut the worst one and solve again. When one broken spring passes its load to neighbours and they break too, we repeat until nothing else breaks. This follows a crack as it spreads (a method called sequentially linear analysis).
Only two numbers were tuned. The spring threshold strain (8.8%) was set so that first-crack displacement lands in the measured range. Model force was converted to newtons with a single scale factor, chosen so that the mean first-crack force of 24 default beans is 45 N. Everything else is output, not input.
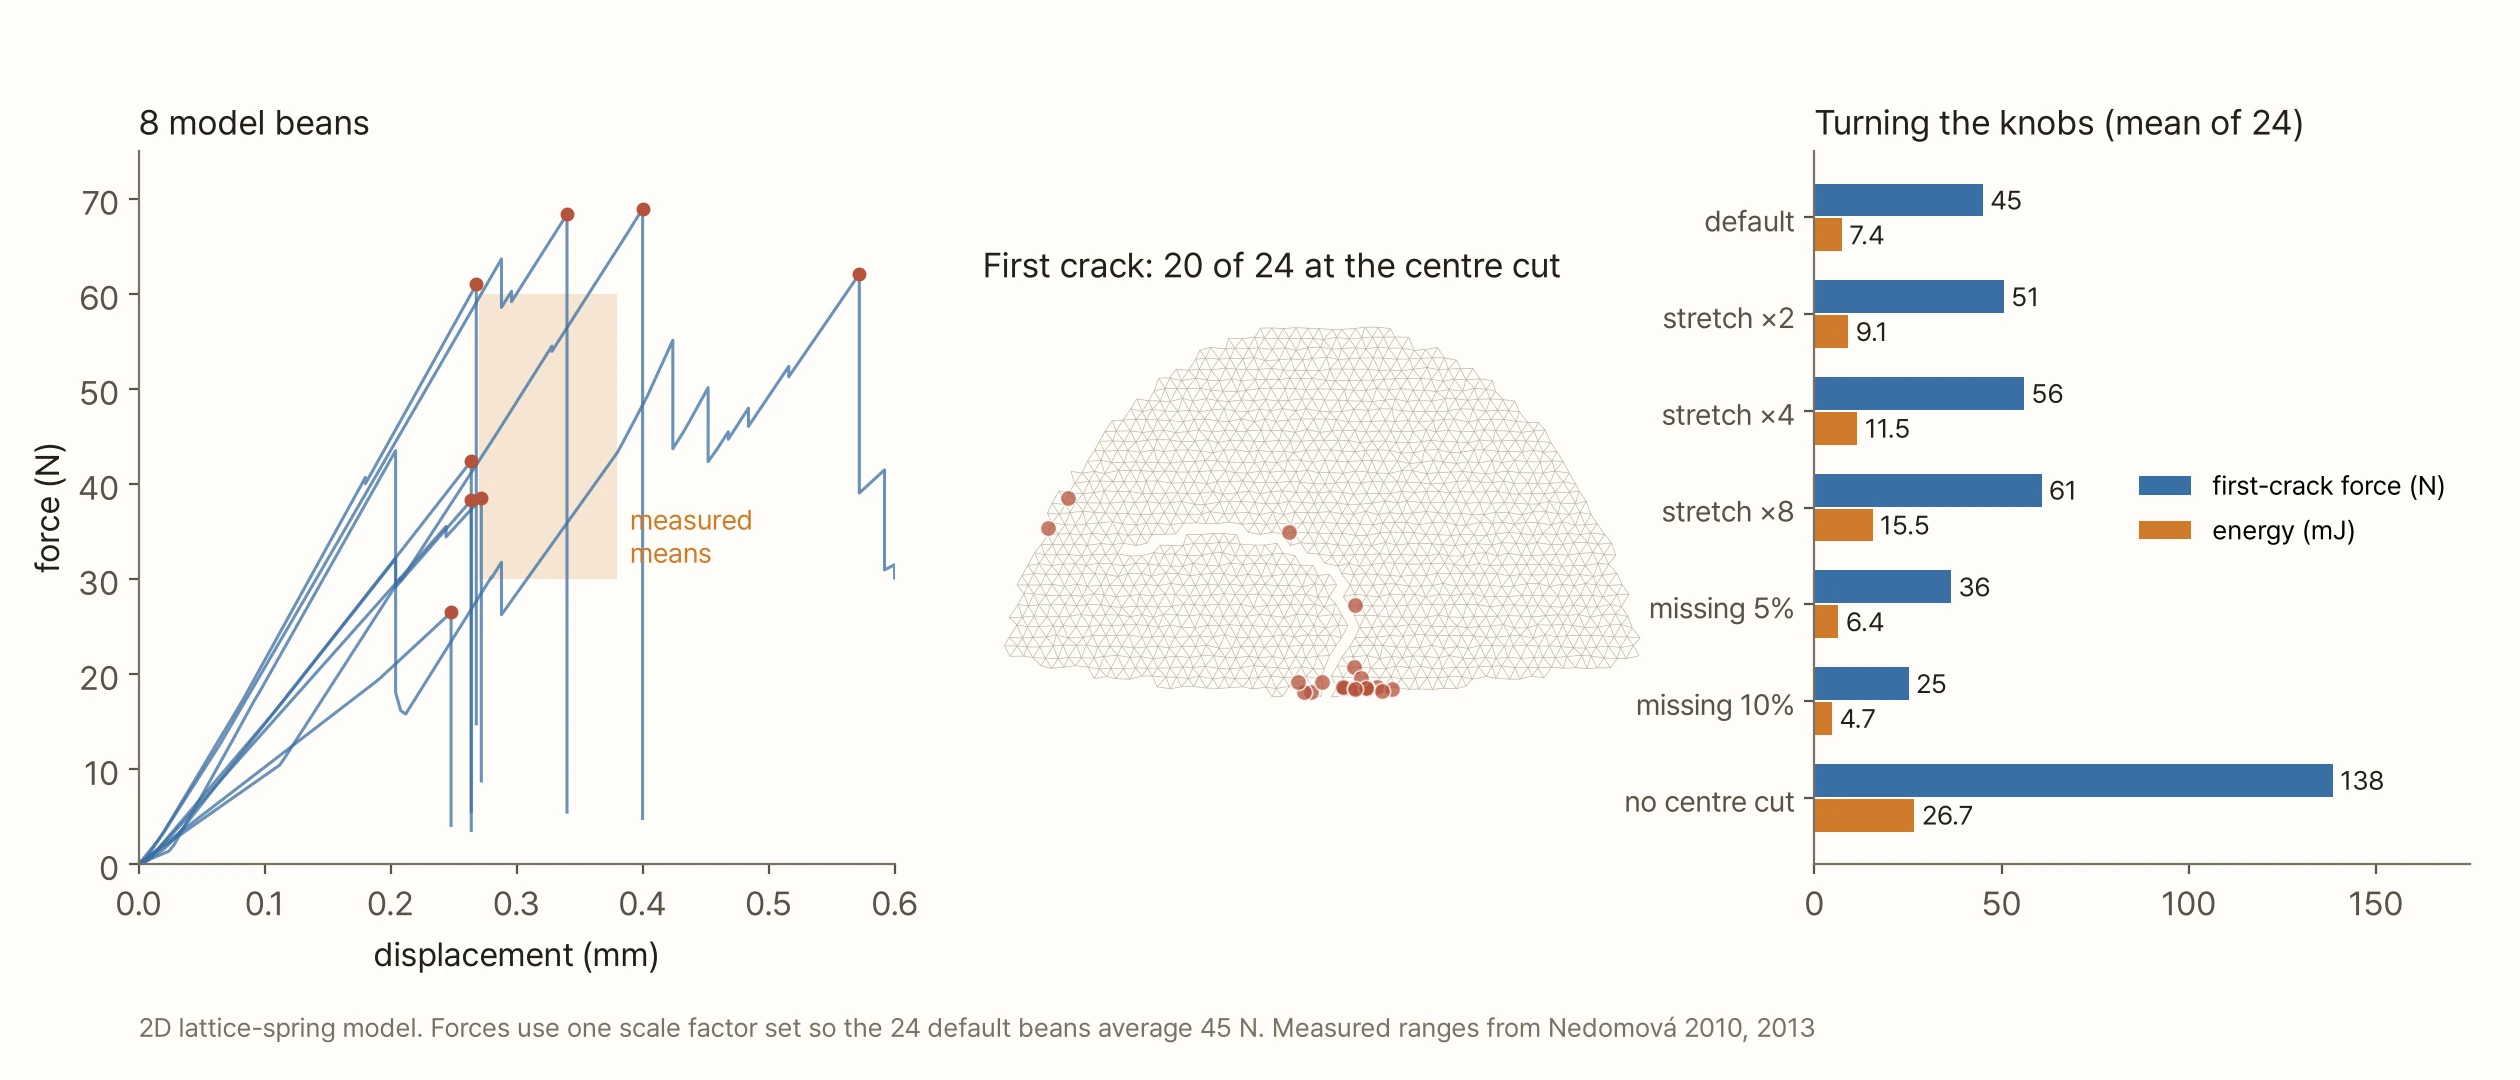
Start with the outputs.
- Energy. Work absorbed up to the first crack averaged 7.4 mJ over 24 beans, inside the measured 6.4–13.7 mJ. We tuned only force and distance, and the work, roughly their product, also came out right
- Scatter. Even with identical model beans, small jitters in node positions and different spring thresholds gave a coefficient of variation of 39% in first-crack force, inside the measured 29–54%
- Where the first crack starts. In 20 of 24 beans the first crack began around the centre cut on the flat side. Pressed from above, the bean bends like a bow lying on the plate; its flat side is pulled apart sideways, and that pull concentrates at the end of the slit
The last result is interesting but has not been checked against measurement. Nedomová's team noted only that the fracture surfaces were highly porous. A synchrotron CT study, however, reported that cracks in roasted beans form mostly near the outside and at the boundary between endosperm tissue and the mucilage layer (Pittia et al. 2011, abstract).
To see how much the slit matters, we pressed beans without it. First-crack force rose threefold, to 138 N on average. In this model, what sets a bean's strength is its shape, above all the slit, more than its material. The real slit curls in a more complex way than drawn here, so the factor of three itself should not be trusted. The direction is clear: a bean splits first at its weakest spot, the folded slit.
We also learned something about where the scatter comes from. Making spring strengths more uniform (m 3 → 6 → 12) raised the mean first-crack force from 34 to 45 to 49 N, but the coefficient of variation barely moved: 38%, 39%, 40%. Bean-to-bean differences came from the fine geometry at the slit's end, not from uneven material. Inferring a material's Weibull modulus backwards from the measured scatter of whole beans (29–54%) could set it too low.
Turning the knobs
Moisture and roast can't be put into the model directly. Instead we added two knobs that mimic their effects.
Stretch. Springs no longer snap the moment they reach their threshold; they yield and stretch first. At ×2 they snap at twice the threshold, at ×8 at eight times. This mimics the observation that wetter beans are tougher and less brittle. Turning stretch from ×1 to ×8 raised first-crack force from 45 to 61 N (+35%). Absorbed work more than doubled, from 7.4 to 15.5 mJ: the work grew much faster than the force. That matches Baggenstoss et al.'s "more energy is needed to comminute them".
Missing bonds. Some springs are removed from the start, standing in for pores and thin cell walls. Removing 5% lowered first-crack force to 36 N (−19%); removing 10% lowered it to 25 N (−44%). That matches the reports that beans withstand less force as roasting proceeds.
Both knobs only mimic a direction. We don't know what moisture percentage equals which stretch, or what share of missing bonds corresponds to a porosity of 0.47 versus 0.53. Building that bridge would take experiments that press beans while measuring their moisture and pores.
Try it yourself
Press the bean slice below. Each press of the button lowers the top plate 0.01 mm. Springs about to break turn orange, broken ones red, and the big red dot is the first crack. Deformation is drawn three times larger so it can be seen. The chart below shows the force curve with the measured mean range (orange box) and dashed lines for the weakest (24 N) and strongest (73 N) bean in a lot.
Switch beans with 'Another bean' and the first-crack force swings from the 20s to the 60s of newtons under identical settings. Turn the centre cut off and the force leaps far past the measured range. More stretch makes the curve climb longer; more missing bonds make it give way early.
Small pieces are stronger
A bean doesn't stop at its first crack. The pieces are dragged back between the burrs and broken again, and their pieces broken again. As pieces get smaller, do they become easier to break, or harder?
Brittle materials obey a weakest-link principle. A chain breaks at its weakest link, and the larger a lump, the more likely it holds at least one weak spot. So a large lump of a material breaks at a lower stress (force per unit area), and a small piece of the same material withstands a higher one. Weibull (1951) put this into a formula: the stress a piece of volume V can withstand scales as V^(−1/m), or, in terms of size L, as L^(−3/m).
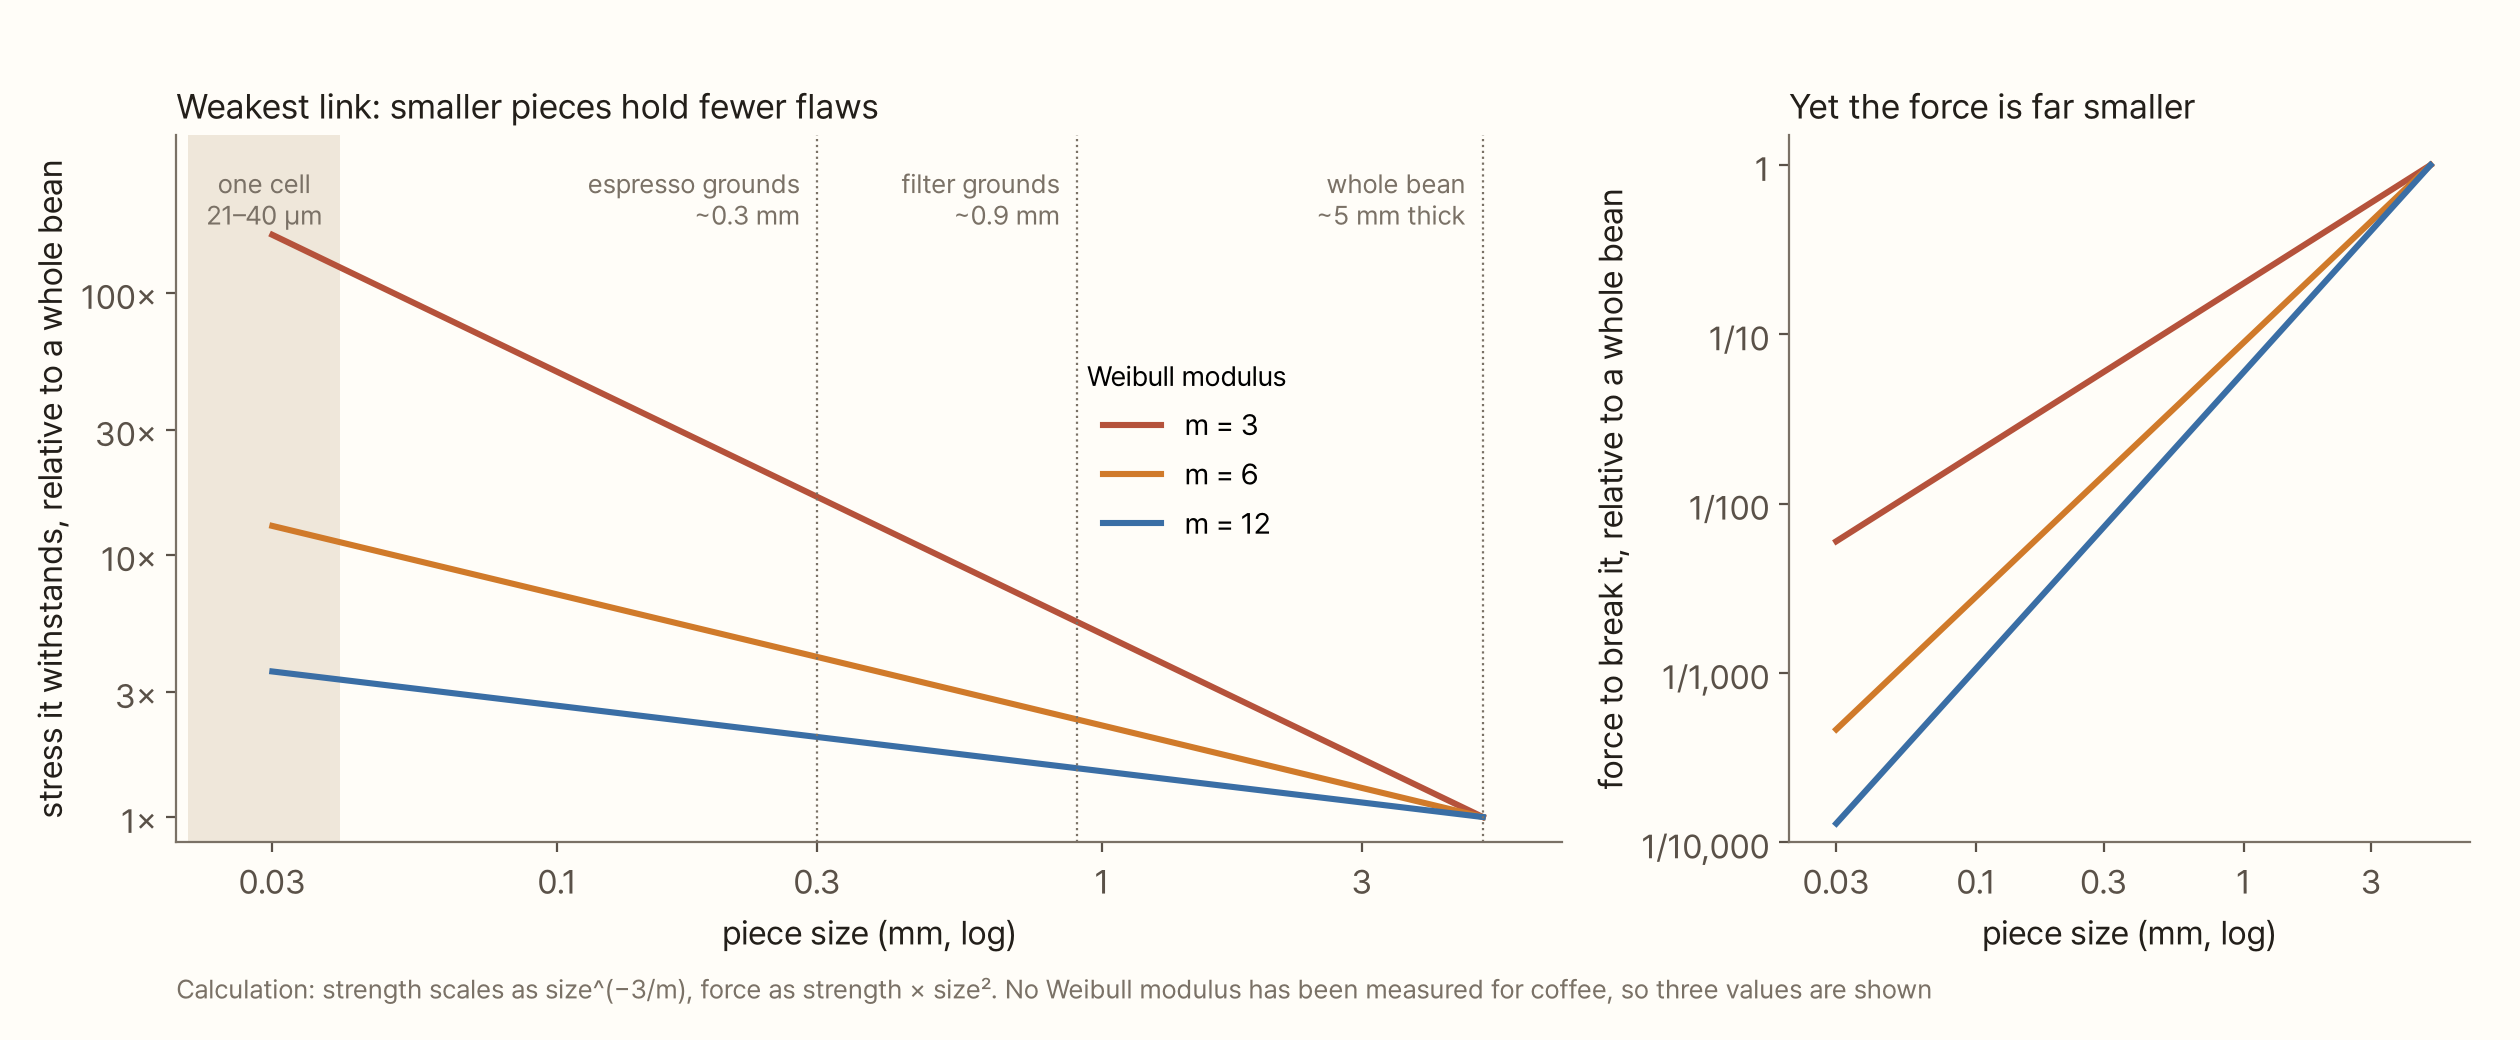
We found no study that has measured the Weibull modulus of coffee beans, so we only calculated, with three values side by side. Comparing a whole 5 mm-thick bean with a 0.3 mm piece, about the size of espresso grounds, the piece withstands about 17 times the stress at m = 3, about 4 times at m = 6 and about 2 times at m = 12. Yet the force needed to break it is far smaller. Force is stress times area (size squared), so breaking a 0.3 mm piece takes 1/17 to 1/140 of the force for a whole bean. In short, small pieces are stronger but break under smaller forces. To put that small force squarely onto a piece, the gap between the burrs has to be about as narrow as the piece.
This principle has a floor. Kendall (1978) showed that when brittle particles are compressed, below a certain critical size a crack cannot spread at all; smaller particles squash flat instead of breaking. The paper's title is its conclusion: "The impossibility of comminuting small particles by compression." We saw only its abstract, and the critical size for coffee is unknown.
Coffee meets another floor first: the cell. A bean is a foam of 21–40 µm rooms. Once a piece is down to a few cells, the weakest link is no longer some flaw somewhere but the cell wall itself. The report that the fines peak sits around 30–40 µm whatever the grinder (Mo et al. 2023) is probably tied to this; Mo et al. took fines to be cell-wall fragments. The model's 0.15 mm mesh can't draw individual cells, so that story gets its own episode.
What this leaves out
- It is a 2D slice. A real bean is over 10 mm long and its slit curls in three dimensions. Model forces are the force on one slice, converted to newtons with one scale factor
- Only the first crack can be trusted. The model assumes small deformations and does not compute contact between pieces once they split. What happens after the first crack, as pieces roll and break again (the second and third peaks of the measured curve), is beyond it. Pieces colliding and breaking between burrs need a different kind of simulation that follows each particle
- Moisture and roast are only mimicked. Stretch and missing bonds are knobs that show a direction, not values matched to a moisture percentage or a porosity. Past 10% missing bonds this mesh becomes unrealistically floppy, so the knob stops there
- We only pressed slowly. Real burrs strike beans at metres per second. Nedomová's team measured about 20% more strength under impact, but this model has no speed
- Temperature is left out. Uman et al. (2016) reported that cooling beans to −196 °C cut the mode of the particle-number distribution by 31% and lowered the fines cutoff from 70 µm to 61 µm. Frozen beans, conflict-of-interest debate included, get a separate episode
- We did not see Pittia et al.'s numbers (2001, 2007). What this post says about how roast and moisture change bean strength rests on those two abstracts
- The size effect is a calculation. Neither a Weibull modulus nor Kendall's critical size has been measured for coffee
Summary
- A light-roast Arabica bean pressed through its thickness first split at 30–60 N, after squeezing 6–8% of its thickness (0.27–0.38 mm). Within one lot, strengths ranged from 24 N to 73 N, unrelated to size or weight
- A bean doesn't turn to powder in one go. The force curve rises and falls like a saw blade as pieces split off one by one. Struck fast, a bean holds about 20% more
- Inside, a roasted bean is a dry foam with a porosity of about 0.5. At the same roast degree, a faster roast leaves more pores
- Beans with 8.8% moisture, on the same grinder at the same setting, ground coarser, with the main peak moving from 424 µm to 1,949 µm, and fines fell by more than half
- A bean-slice model tuned on just force and distance also landed in the measured range for absorbed work (7.4 mJ) and bean-to-bean scatter (39%). The first crack mostly began around the centre cut on the flat side, and removing the slit tripled the strength
- Stretch (mimicking moisture) raised absorbed work much more than force; missing bonds (mimicking pores) cut force sharply
- Small pieces hold fewer weak links and withstand higher stress, but need far less force to break. At the bottom lies the cell
A bean isn't sliced by a blade. It splits, weakest spot first, one piece at a time. This is where it starts to become clear why one grinder dial never gives grounds of one size.
References
- Nedomová Š, Trnka J, Stoklasová P, Buchar J (2013). Strength of coffee beans under static and dynamic loading. Acta Universitatis Agriculturae et Silviculturae Mendelianae Brunensis 61(3), 743–749. doi:10.11118/actaun201361030743 — light roast, 20 origins, static compression and drop tests
- Nedomová Š (2010). Crushing of roasted Arabica coffee beans. Acta Universitatis Agriculturae et Silviculturae Mendelianae Brunensis 58(4), 177–182. doi:10.11118/actaun201058040177 — first-crack force, strain and work for five lots (Table II)
- Baggenstoss J, Perren R, Escher F (2008). Water content of roasted coffee: impact on grinding behaviour, extraction, and aroma retention. European Food Research and Technology 227(5), 1357–1365. doi:10.1007/s00217-008-0852-8
- Pittia P, Nicoli MC, Sacchetti G (2007). Effect of moisture and water activity on textural properties of raw and roasted coffee beans. Journal of Texture Studies 38(1), 116–134. doi:10.1111/j.1745-4603.2007.00089.x — abstract only
- Pittia P, Dalla Rosa M, Lerici CR (2001). Textural changes of coffee beans as affected by roasting conditions. LWT – Food Science and Technology 34(3), 168–175. doi:10.1006/fstl.2000.0749 — abstract only
- Pittia P, Sacchetti G et al. (2011). Evaluation of microstructural properties of coffee beans by synchrotron X-ray microtomography: a methodological approach. Journal of Food Science 76(2), E222–E231. doi:10.1111/j.1750-3841.2010.02009.x — abstract only
- Schenker S (2000). Investigations on the Hot Air Roasting of Coffee Beans. Doctoral thesis, ETH Zürich, Diss. ETH No. 13620 — porosity and density (Table 10), cell size as cited
- Schenker S, Handschin S, Frey B, Perren R, Escher F (2000). Pore structure of coffee beans affected by roasting conditions. Journal of Food Science 65(3), 452–457. doi:10.1111/j.1365-2621.2000.tb16026.x — abstract only
- Laverse J, Frisullo P, Conte A, Del Nobile MA (2012). X-Ray Microtomography for Food Quality Analysis. In: Food Industrial Processes – Methods and Equipment, InTech. doi:10.5772/32264
- Cloete KJ et al. (2019). Physico-elemental analysis of roasted organic coffee beans from Ethiopia, Colombia, Honduras, and Mexico using X-ray micro-computed tomography and external beam particle induced X-ray emission. Food Chemistry: X 2, 100032. doi:10.1016/j.fochx.2019.100032
- Navarini L, Mancini L, Saccomano G, Crisafulli P (2025). Morphological analysis of Coffea arabica beans roasted by different industrial processes using synchrotron radiation microtomography. ASIC 2025 poster. PDF — conference poster
- Nagaraju VD, Bhattacharya S (2010). Roasting green coffee beans using spouted bed roaster: changes in physical characteristics. Journal of Food Science and Technology. doi:10.1007/s13197-010-0088-z — abstract only
- Uman E et al. (2016). The effect of bean origin and temperature on grinding roasted coffee. Scientific Reports 6, 24483. doi:10.1038/srep24483
- Kendall K (1978). The impossibility of comminuting small particles by compression. Nature 272, 710–711. doi:10.1038/272710a0 — abstract only
- Mo C, Johnston R, Navarini L, Liverani F, Ellero M (2023). Exploring the link between coffee matrix microstructure and flow properties using combined X-ray microtomography and smoothed particle hydrodynamics simulations. Scientific Reports 13, 16374. doi:10.1038/s41598-023-42380-y
- Weibull W (1951). A statistical distribution function of wide applicability. Journal of Applied Mechanics 18, 293–297. doi:10.1115/1.4010337
Image credits
- Bean µCT slices (the three left panels of the second figure): Laverse J, Frisullo P, Conte A, Del Nobile MA (2012), Food Industrial Processes – Methods and Equipment, InTech, Fig. 1. CC BY 3.0. Cropped around the bean, inverted, and labelled
- First and third figures: redrawn from numbers read off the tables and figures of Nedomová (2010, 2013) and Baggenstoss et al. (2008). The original figures are not reproduced
- All other figures, the cover and the simulation: made by the author