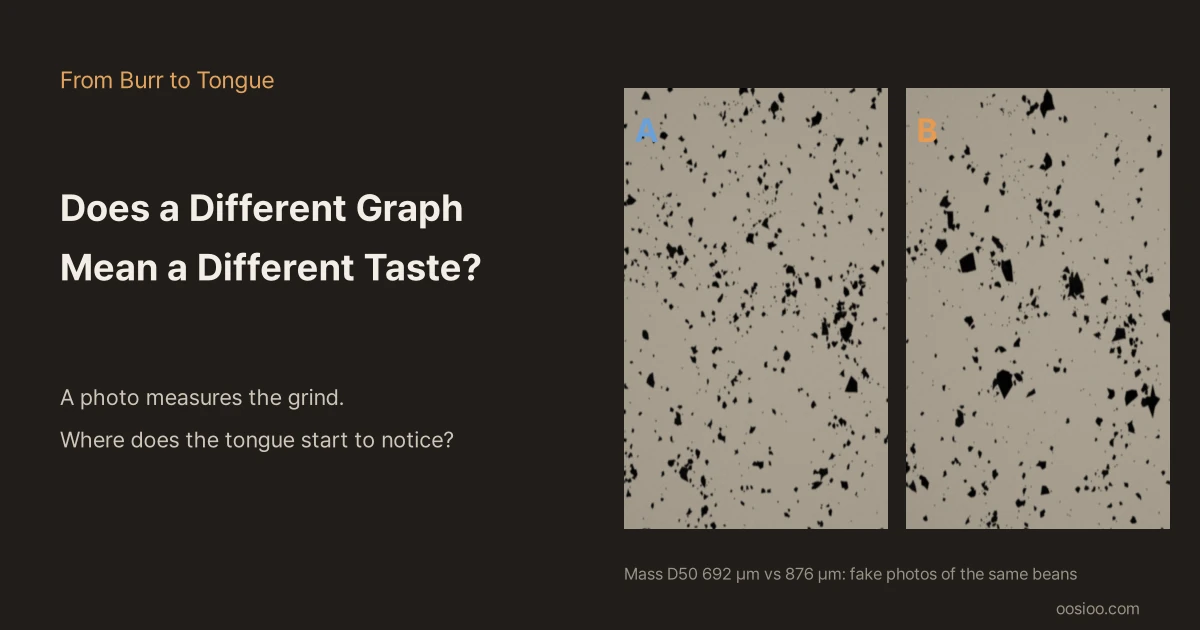
Does a Different Graph Mean a Different Taste?
If two photo-measured grind graphs differ, do the cups taste different? In triangle tests people could not tell apart a 25% difference in median particle size (TDS +0.15 pt), and the threshold for drip TDS was estimated at about 0.24 pt. Immersion barely responds to the grind; in drip one taste step takes a D50 change of 50% or so, while a photo resolves 4%. AI eyeballing got the mass D50 within 7–13% but was pulled towards common sizes. Also: the Part 1 grind meter v1.
For eleven episodes this series has worked on pulling a particle-size distribution out of a single photo of coffee grounds. We corrected the camera scale, worked out how many µm one pixel covers, split touching particles, counted how many photos it takes to trust the answer, and held the result up against sieves. One question is left at the end of all that. If two graphs differ, do the two cups taste different?
The reason to look at a grind graph is, in the end, taste. Say you turn the grinder one notch and the peak of the graph moves sideways. The photo shows that difference clearly. But does the tongue notice it too? This episode puts the photo's scale and the tongue's scale side by side. At the end it also tests something many people now try: showing the photo to an AI and asking about the grind.
What the tongue reads
Plenty of knobs move the taste of coffee: beans, roast, water temperature, ratio, time, grind. Yet when Ristenpart, Guinard and colleagues at UC Davis tasted drip coffee systematically over several years, the picture turned out to be surprisingly simple. Whatever knob you turn, what ends up in the cup is mostly summed up by two numbers.
- TDS (total dissolved solids, strength): the mass share of solids dissolved in the coffee. Drip coffee is usually 1.0–1.5%
- EY (extraction yield, PE in the papers): the share of the coffee's mass that left with the water. Usually 16–24%
Batali et al. (2020) brewed at 87, 90 and 93 °C, adjusting grind and ratio so that TDS and EY came out the same. They brewed 270 cups over a grid of nine points (TDS 1.0, 1.25, 1.5% × EY 16, 20, 24%) times three temperatures, and 12 trained panelists rated 31 attributes. TDS and EY changed the taste clearly, while temperature had "no appreciable impact". On the map that gathers the taste differences, the first axis, explaining 72.2% of the variance, ran along TDS, and the second, explaining 10.5%, ran along EY.
Frost et al. (2020) reported that changing only TDS and EY changed 21 of 30 attributes. Sweetness actually dropped as the coffee got stronger. The same group redrew the 1950s "brewing control chart" from sensory data (Guinard et al. 2023), and the two axes of the new chart are still TDS and EY.
So we can start by assuming that the grind changes taste mostly by way of these two numbers. The grind graph changes → the amount that dissolves (EY) changes → the strength in the cup (TDS) changes → the tongue feels it. The question is how thick each arrow is. Routes by which the grind changes taste without going through TDS and EY (a different composition of what dissolves) are dealt with separately below.
The tongue's scale: triangle tests
The standard way to check whether the tongue can tell two cups apart is the triangle test. Three cups are served; two are the same and one is different. The taster has to pick the odd one. Someone who feels nothing and guesses still gets 1/3 right, so "told apart" is judged by how far above 1/3 people score. With 45 tasters, more than 21 have to be right for p < 0.05.
Frost et al. (2019) varied the basket shape of a drip machine (flat bottom vs half cone) and the grind (median about 800 µm vs about 1,000 µm) in a 2 × 2 design to make four coffees, and had 45 people taste all six pairs in triangle tests. Particle size was measured by laser diffraction, and the two grinds differed in median size by 266 µm, about 25%. For photo measurement, that is a very easy difference to see.
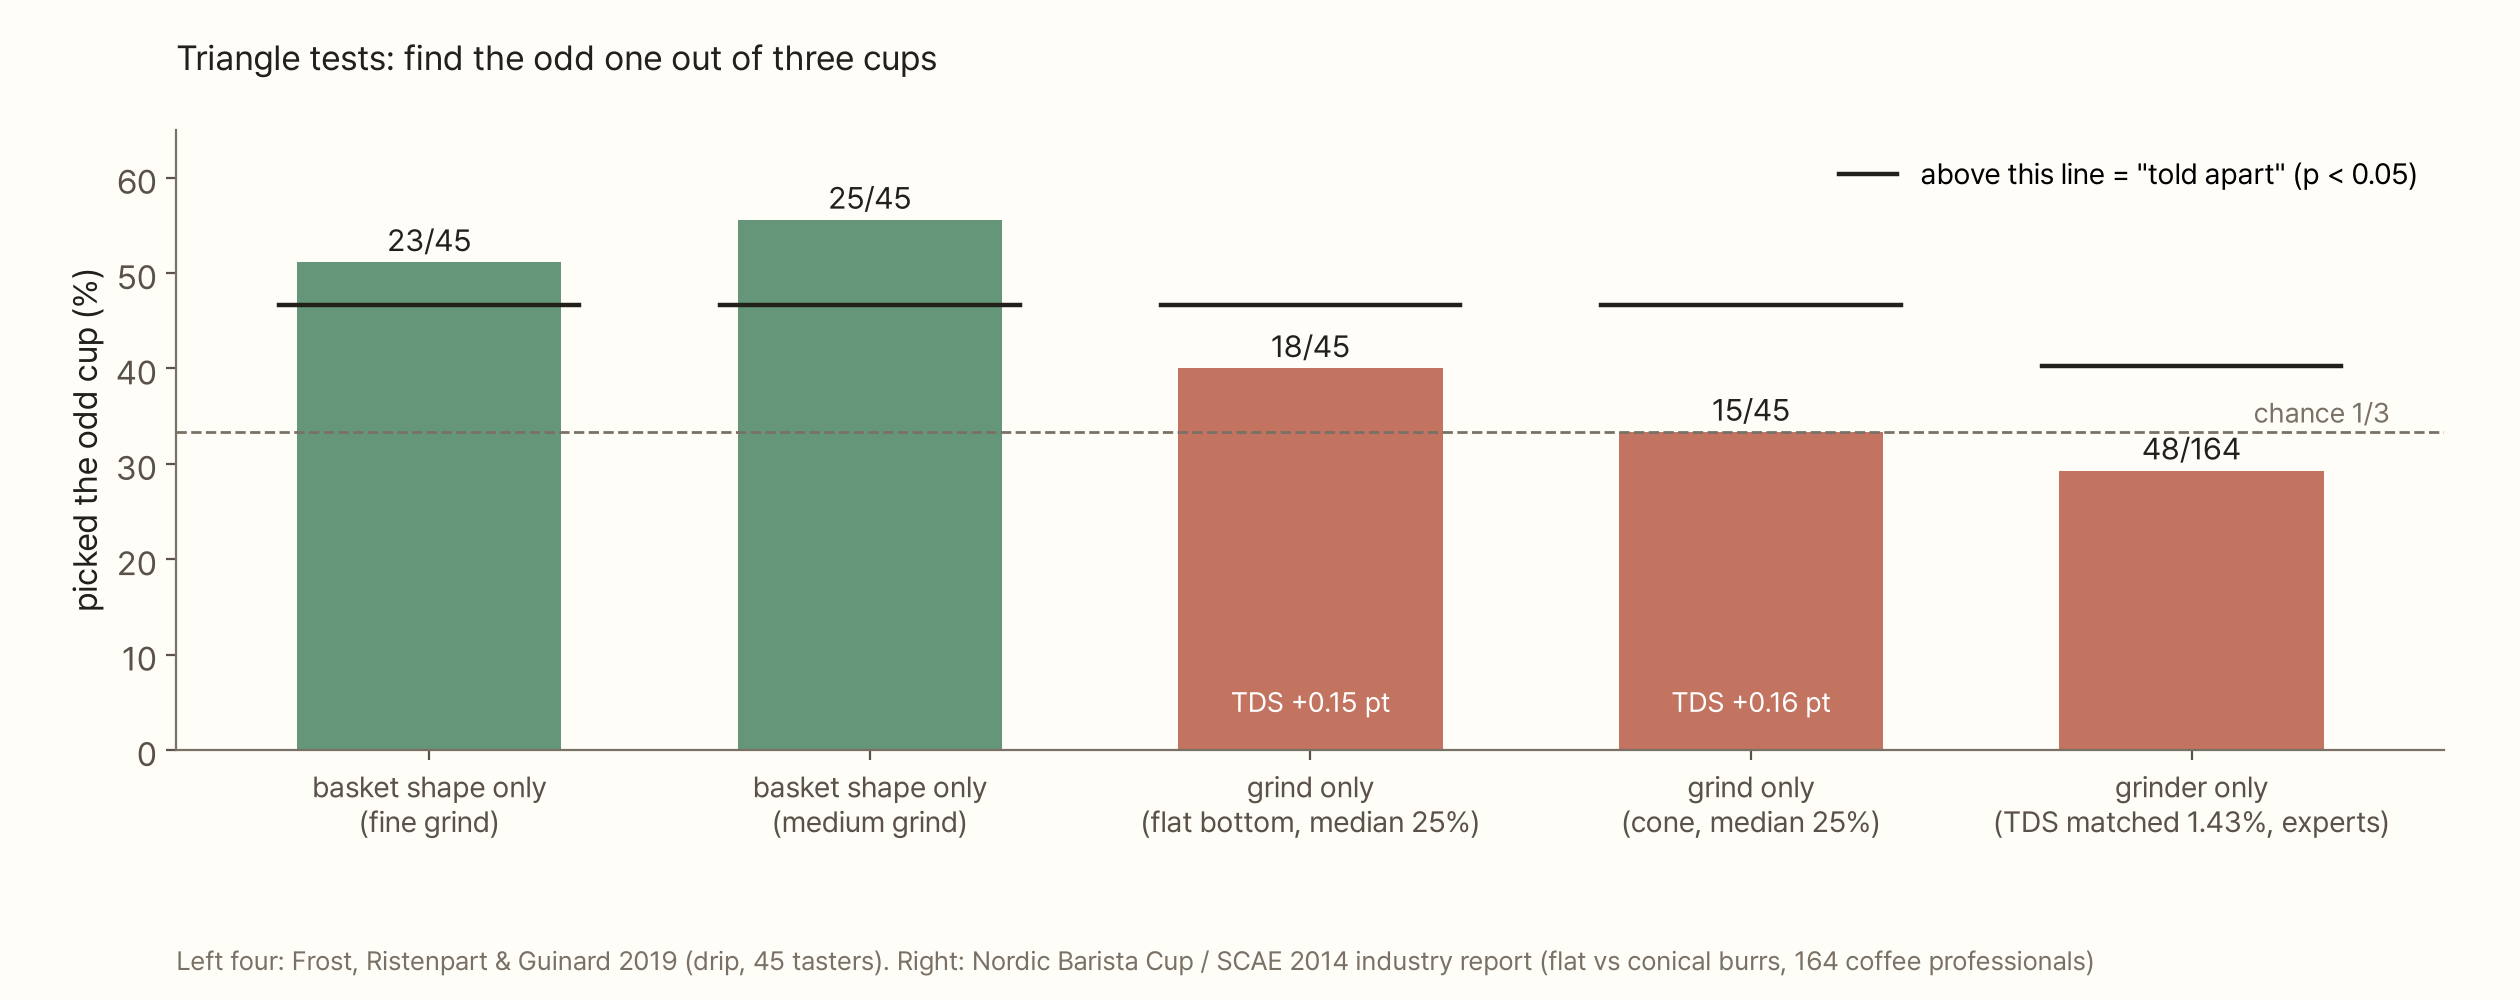
Tasters could tell the basket shapes apart (23/45, p = 0.024 and 25/45, p = 0.004). They could not tell grinds apart when only the grind differed (18/45, p = 0.29 and 15/45, p = 0.39). Grinding 25% finer raised TDS by 0.15–0.16 points, and that was not enough to pass the triangle test. The authors concluded: "A 25% difference in median particle size was not discernable when evaluated within a given brewing geometry."
The paper also gives a scale for the tongue. Among the pairs that were told apart, the one with the smallest TDS difference (flat bottom, fine grind vs half cone, medium grind, p = 0.048) differed by 0.24 points. The authors took this as an estimate of the sensory difference threshold for TDS in drip coffee, a relative difference of 28%. This number was not measured in a formal psychophysics experiment. Nobody tasted a series of strengths step by step; it is a rough value read off as "the smallest difference among the pairs that were told apart" out of six pairs. The authors add that the real threshold may be lower. Still, it is the only peer-reviewed number I could find for the difference threshold of drip coffee TDS. This episode uses 0.24 points as "one step of the tongue".
The same conclusion turns up elsewhere. A 2014 industry report from the Nordic Barista Cup and SCAE matched filter coffees ground on flat and conical burrs at exactly 1.43% TDS (21% EY) and put them through triangle tests. 48 of 164 coffee professionals got it right, fewer than the roughly 55 expected by chance. Among consumers it was 9 of 50. For cold brew, Morresi et al. (2021) changed the grind 2.5-fold, from 0.65 mm to 1.65 mm, and 18 of 19 sensory attributes did not change significantly.
"Can people tell them apart?" and "can a panel pick up a difference?" are different questions, though. In descriptive analysis, Frost et al. (2019)'s trained panel found 6 attributes (brown roast, burnt wood/ash, cocoa and others) that differed significantly with the grind. That comparison was between the fine and coarse grinds, about 800 µm vs about 1,200 µm, a difference of nearly 50%. The university panel in the SCAE report also found burnt and sour notes differing between grinders. When trained panelists score intensities, they pick up smaller differences than ordinary people choosing one cup in three.
How much does the grind change TDS?
If one step of the tongue is 0.24 points, how far does the grind graph have to move for TDS to move that much? The answer depends on the brewing method.
Start with immersion (French press, cupping). Liang et al. (2021) showed that in immersion brewing, where the grounds simply sit in water, TDS reaches equilibrium after about 20 minutes. The equilibrium TDS had almost nothing to do with the grind. Across a 2.3-fold range of median sizes, from 579 µm to 1,311 µm, TDS was 1.36 ± 0.09% (brew ratio 15). Extraction yield at equilibrium settled around 21%. The grind changes how fast you reach equilibrium, but barely changes how much dissolves at equilibrium.
What if you stop before equilibrium, say at 4 minutes? I built a simple model. Following the picture of Moroney et al. (2016), a coffee particle dissolves in two stages. Cells in the outer shell, broken by grinding, dissolve as soon as water touches them. Here the shell thickness is one coffee cell, 30 µm. The unbroken core comes out slowly by diffusion. For the diffusion coefficient I used 6.25 × 10⁻¹⁰ m²/s, which Cameron et al. (2020) fitted to espresso data, and I set the equilibrium extraction yield to Liang et al.'s 21%. The distribution is the bimodal model used since Episode 6.
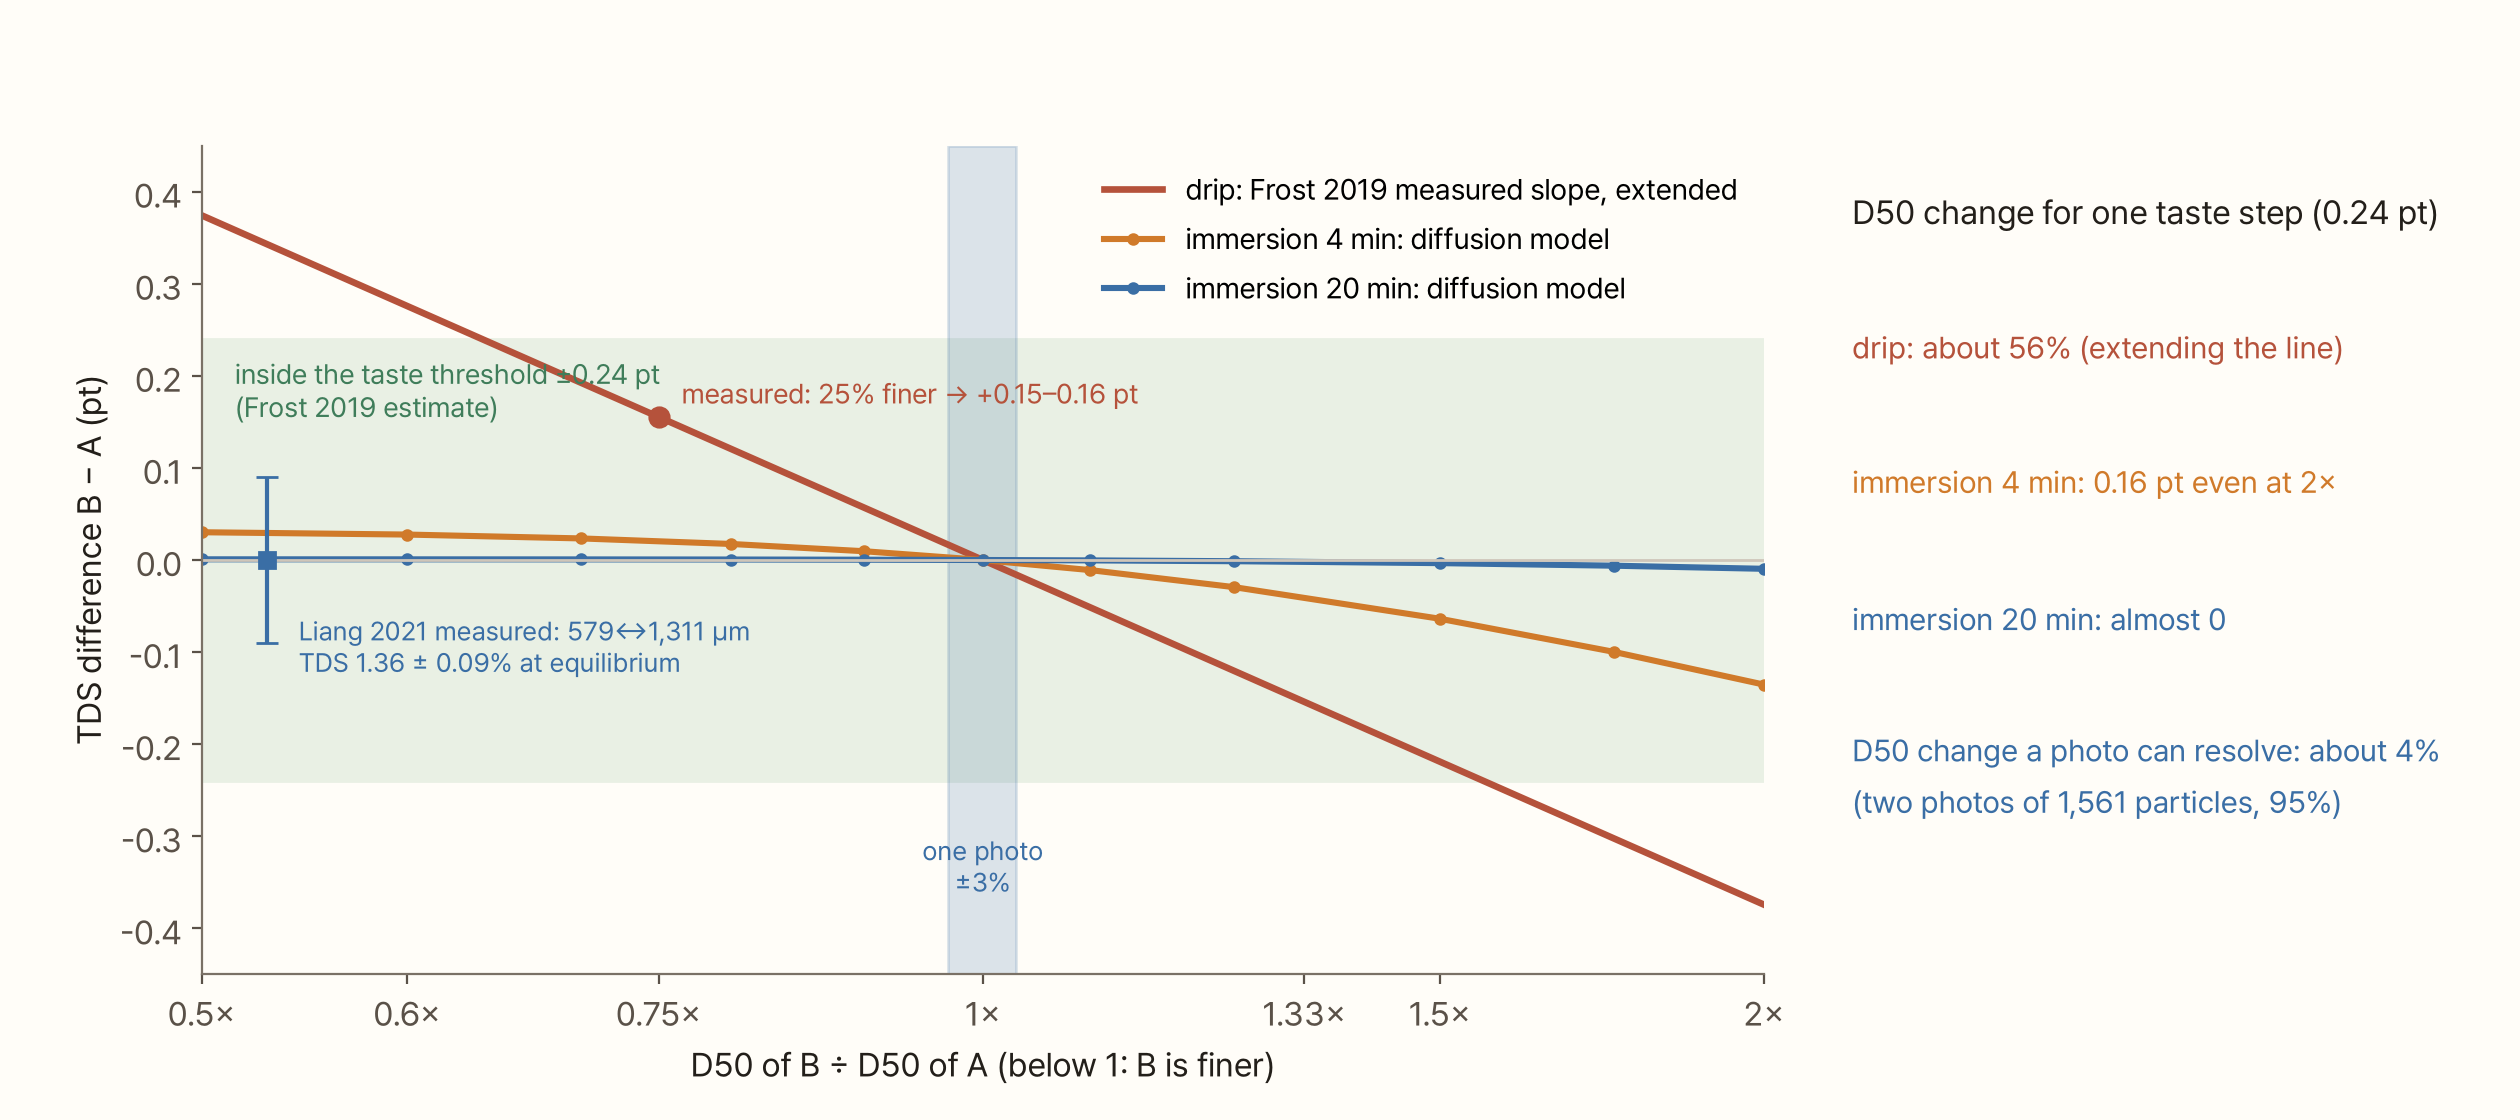
In this model a 4-minute steep was insensitive to the grind. Making D50 25% finer raised TDS by only 0.03 points. It took a 2× coarser grind to lower TDS by 0.16 points, and even that fell short of one step of the tongue. At 20 minutes the difference shrank to about 0.01 points even at 2×. With a diffusion coefficient of 6.25 × 10⁻¹⁰ m²/s, the diffusion time r²/D of a particle with a 400 µm radius is about 4 minutes, so by 4 minutes most particles have already given up much of what they have.
Drip is different. In Frost et al. (2019)'s measurements, a 25% difference in median size changed TDS by 0.15–0.16 points. The same diffusion model does not produce that. To mimic Frost's result with this model I had to make the diffusion coefficient tens of times smaller than the literature value, and then it no longer agrees with Liang's finding that immersion reaches equilibrium within 20 minutes. In drip, the grind most likely changes TDS through the water's path rather than diffusion inside particles. Finer grounds pack more tightly, water drains more slowly, and the water stays with the coffee longer. I did not put that into this model. Instead I extended Frost's measured slope as is. Assuming the TDS difference is proportional to the log of D50, one step of the tongue (0.24 points) takes about a 56% difference in D50. It is a line extended from one measured point, so treat it as a rough value. It does, however, match the size of the comparison (about 50%) in which the trained panel picked up attribute differences.
The photo's scale
Now put the photo's scale on the same chart. In Episode 10, one Gagné photo (1,561 particles) gave a 95% bootstrap interval of ±3% on the volume D50. Comparing two photos taken the same way, you can tell apart D50 differences from about 4%. Compared with the 56% that one step of the tongue takes in drip, that is a scale more than ten times finer. Telling apart the 25% difference in Frost's drip experiment takes fewer than 200 particles per photo.
Throughout Part 1 we met several large biases in photo measurement. The photo D50 came out 27% larger than a round-hole sieve (Ep. 11), and the volume D50 of the same photo ranged from 710 to 1,057 µm depending on how clumps were handled (Ep. 9). But most of these biases cancel when two coffees are compared with the same method. Two photos taken on the same paper, under the same light, with the same threshold and the same definition of diameter keep their difference well, even if both lean the same way. A photo is much better at "how much finer is it than yesterday's coffee?" than at "what exactly is this coffee's D50 in µm?".
The photo's weakness lies on the other side. As we have seen since Episode 3, this series' photo cannot see particles smaller than about 330 µm. So a coffee in which only the fines changed looks like the same coffee in the photo.
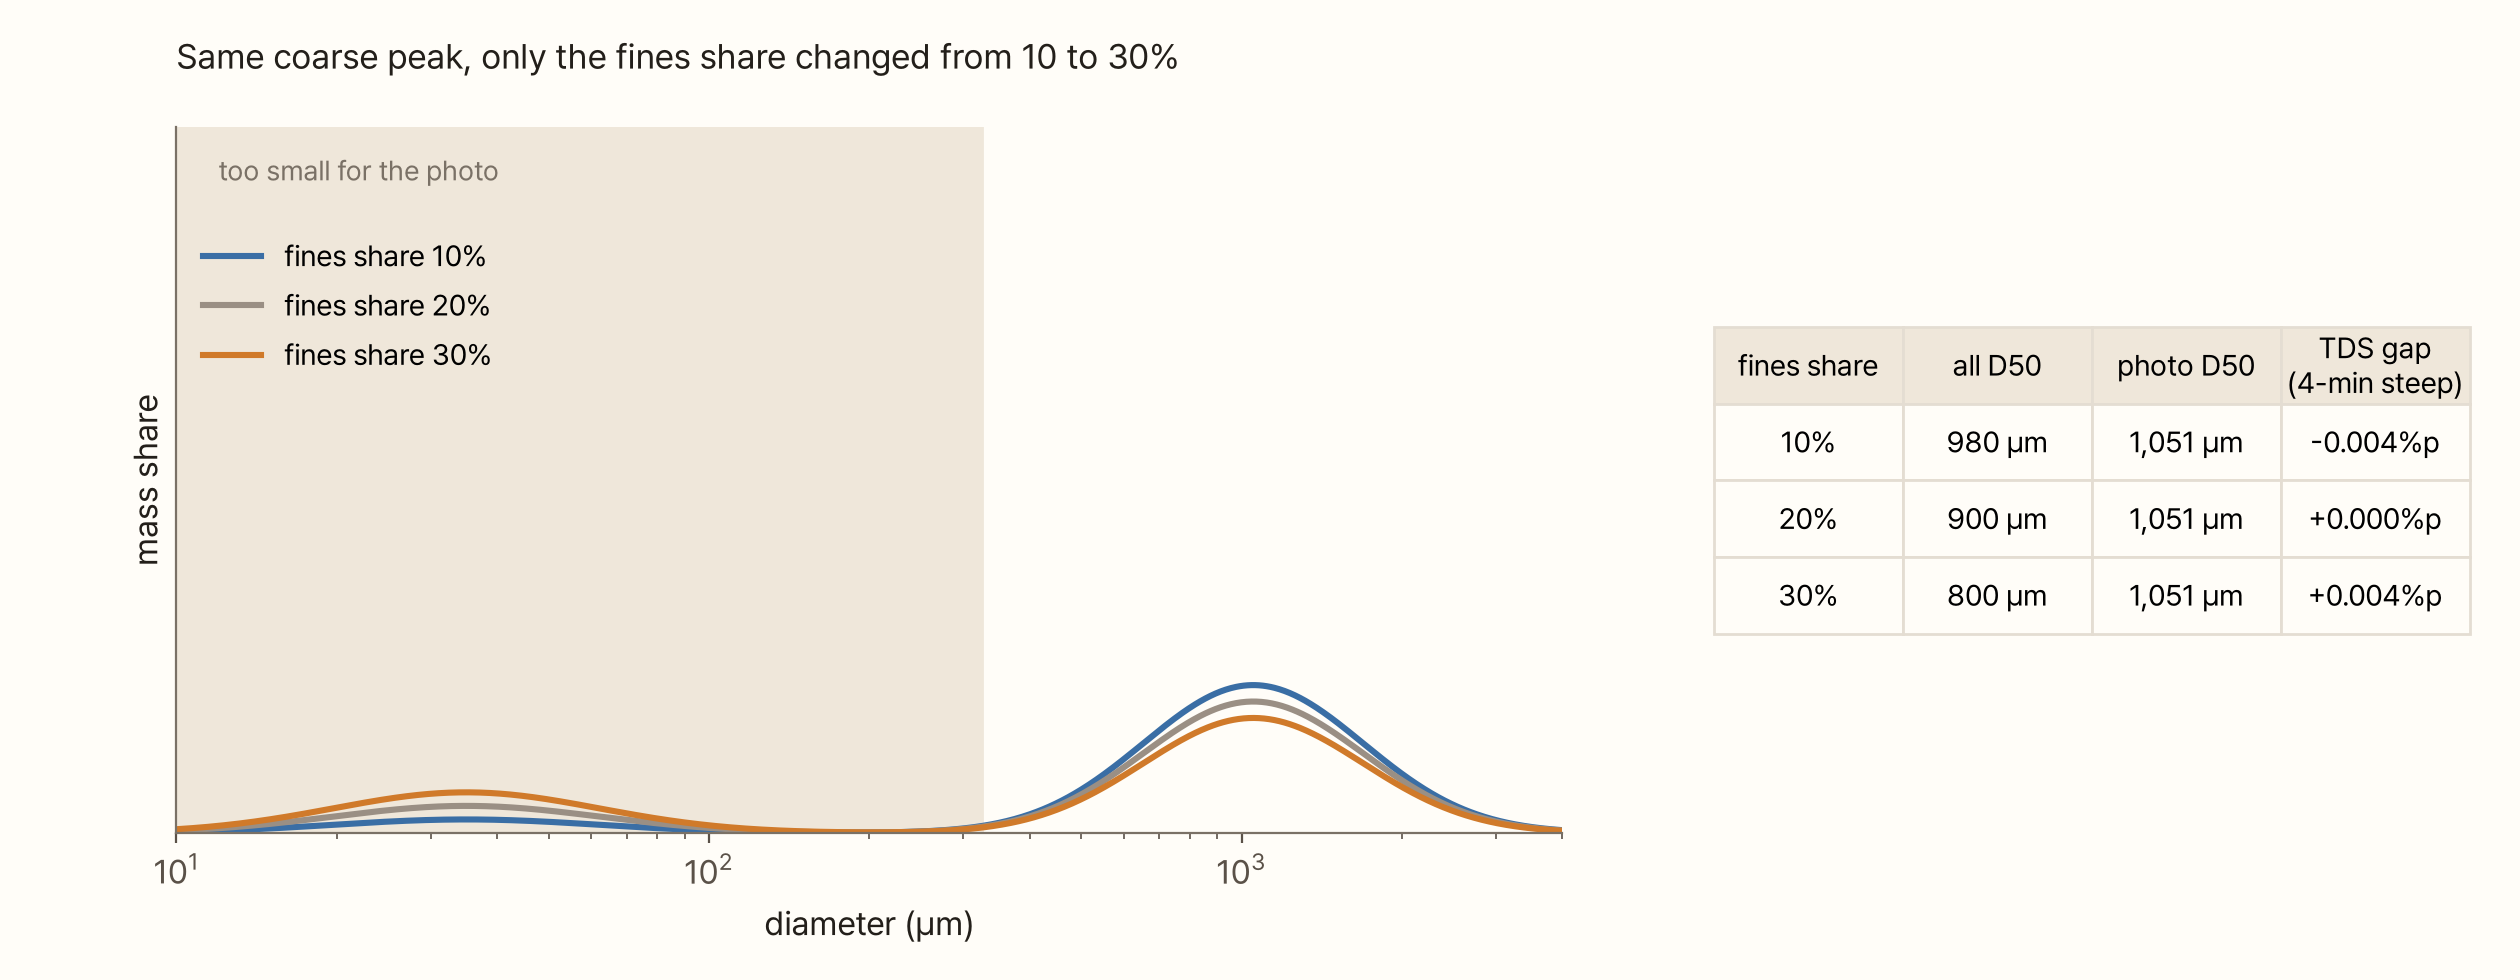
Raising the fines share from 10% to 30% moves the overall mass D50 from 980 µm to 800 µm, by 18%. The photo D50 stays at 1,051 µm. But in the immersion model the tongue does not know either: the TDS difference is 0.004 points. Fines and the outer shells of coarse particles both dissolve quickly anyway, so the shells of the coarse particles fill in for whatever the fines add or lose. A difference that looks big on the graph disappears in an immersion cup.
Fines change the taste through the water's path. In the espresso experiments of Schmieder et al. (2023), changing the grind setting raised the mean particle size from 273 µm to 295 µm, while the Sauter diameter, which stands for surface area, stayed at 27–29 µm. The fines hold the surface area, and in the puck the fines block the gaps water flows through. Cameron et al. (2020) found that grinding espresso very fine actually lowered extraction yield and made shots scatter more, and read this as water failing to flow evenly, with parts of the bed clogged. The share the photo cannot see reaches the tongue not through the inside of the particles but through the spaces between them.
Try it yourself
Below, change the coarse peak and the fines share of grinds A and B. The upper chart shows the two coffees' mass distributions, and the lower chart shows where the two cups land on the TDS–EY plane. The blue band is how far from A the tongue starts to notice (TDS ±0.24 pt). Only when B's dot leaves the band do we count the tongue as telling them apart.
In "Drip (measured slope)", B stays inside the band even when it is 25% coarser than A. You have to drag B towards 1,600 µm before it leaves. Switch to "Immersion 4 min" or "Immersion 20 min" and the dot hardly leaves the band even with the coarse peak pushed all the way. Change the fines share and the results table shows the overall D50 moving while the photo D50 stays put. The last line of the results turns the TDS difference into a number of taste thresholds and tells you how many particles per photo it takes to tell the two D50s apart.
Showing the photo to an AI
These days many people show a photo to an AI and ask, "What brew method does this grind suit?". I could not find any article or paper that measured how well multimodal language models judge coffee grind. General evaluations are not encouraging. On very simple visual tasks, such as whether two circles overlap, four state-of-the-art models averaged 58% (Rahmanzadehgervi et al. 2024), and on real photos crowded with objects even the best model counted correctly only 43% of the time (CountQA, Tamarapalli et al. 2025). Judging the size distribution of thousands of particles by eye looks hard.
So I tested it. With the fake-coffee generator from Episode 8, I made photos at six levels, changing only the coarse peak, two each, twelve in all. The true mass D50 ranges from 348 to 1,379 µm, and a 5 mm bar is drawn in the lower-left corner. I showed the photos one at a time, each in a fresh conversation from the Claude Code command line, to Claude Sonnet 5.5 and Claude Opus 5.5, with the same question: "The black bar is exactly 5 mm. Estimate the median diameter by particle count and the mass-weighted D50 in µm, and say which brew method this grind suits. Don't write code; judge by eye." Three of the photos got the same question three times.
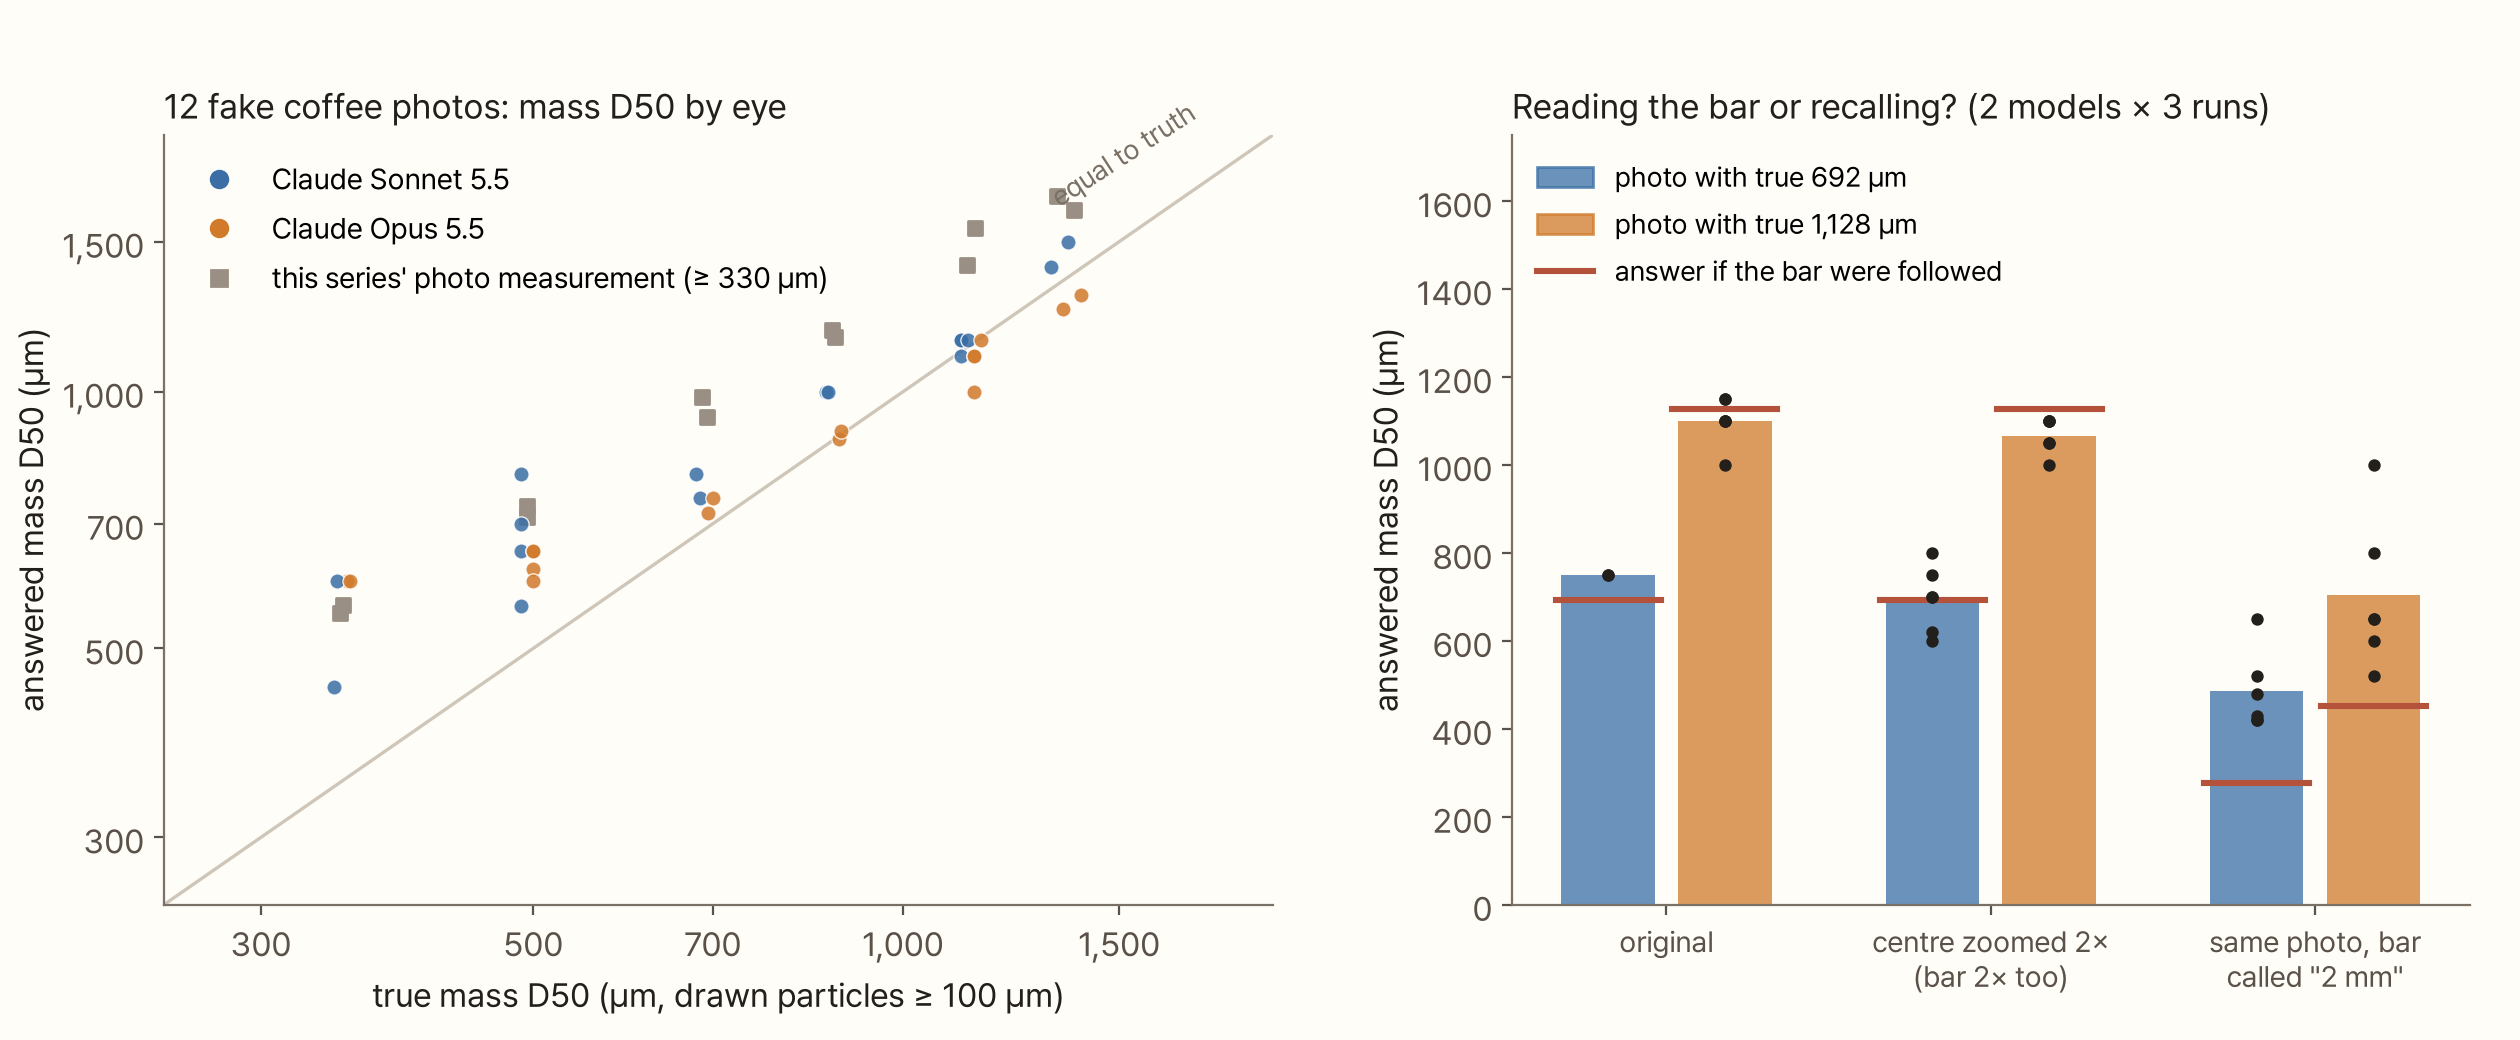
The results were better than I expected. The median absolute error on the mass D50 was 13% for Sonnet and 7% for Opus. For coarse coffee (true value 900 µm and above), both models were mostly within 10%. They also got the order right: the rank correlation between level and answer was 0.96 and 0.98. Asking the same photo three times moved the answer by 3–13% (coefficient of variation). This series' photo measurement (the Ep. 4–5 algorithm) came out 18–61% too large on the same fake photos, a bias from not seeing particles below 330 µm and counting touching particles as one. Looking only at the numbers against the truth, the AI's eyeballing was closer than this series' measurement.
The weaknesses were also clear. For fine coffee (true 348 µm), both models said 450–600 µm, 30–70% too large. They barely got the count median right. The true value shrinks as the coffee gets coarser (fines dominate the count, so it goes from 237 µm down to 114 µm), but the answers grew instead (150 → 350 µm) or stayed around 200–300 µm. For the brew method they mostly said pour-over, with immersion or cold brew mixed in for true values of 900 µm and above.
I also checked whether the models really read the bar, or answer from memory of "what coffee grounds usually look like". I ran two controls on the photos with true values of 692 µm and 1,128 µm. When the centre was cropped and enlarged 2× with the bar redrawn at twice the length, the answers were almost the same as before (averages 657–733 µm and 1,050–1,083 µm). So they did read the change of scale from the bar. Conversely, when told falsely that the bar in the same photo was "2 mm", the answers, which should have shrunk to 0.4× if the bar were followed, stopped at 0.62–0.70×. The models read the bar, but their answers are pulled towards the usual size of coffee grounds. The same pull explains why the fine coffee looked too large.
In short, today's AI eyeballing gets the mass D50 to roughly 10–15%, and is pulled towards common sizes the further you move from them. Given that one step of the tongue in drip is a D50 change of 50% or so, that may be enough for advice like "this grind is for drip". It is not suited to telling yesterday's grind from today's to within 4%, or to asking how many fines there are. The test was small, twelve fake photos and two models, and there was no ground truth for real photos. On Gagné's real photo the two models answered 700–900 µm; this series' measurement gives 867 µm.
Part 1's error budget
Here are the errors Part 1 ran into, in one chart: what moved the mass D50 of the same coffee, and by how much.
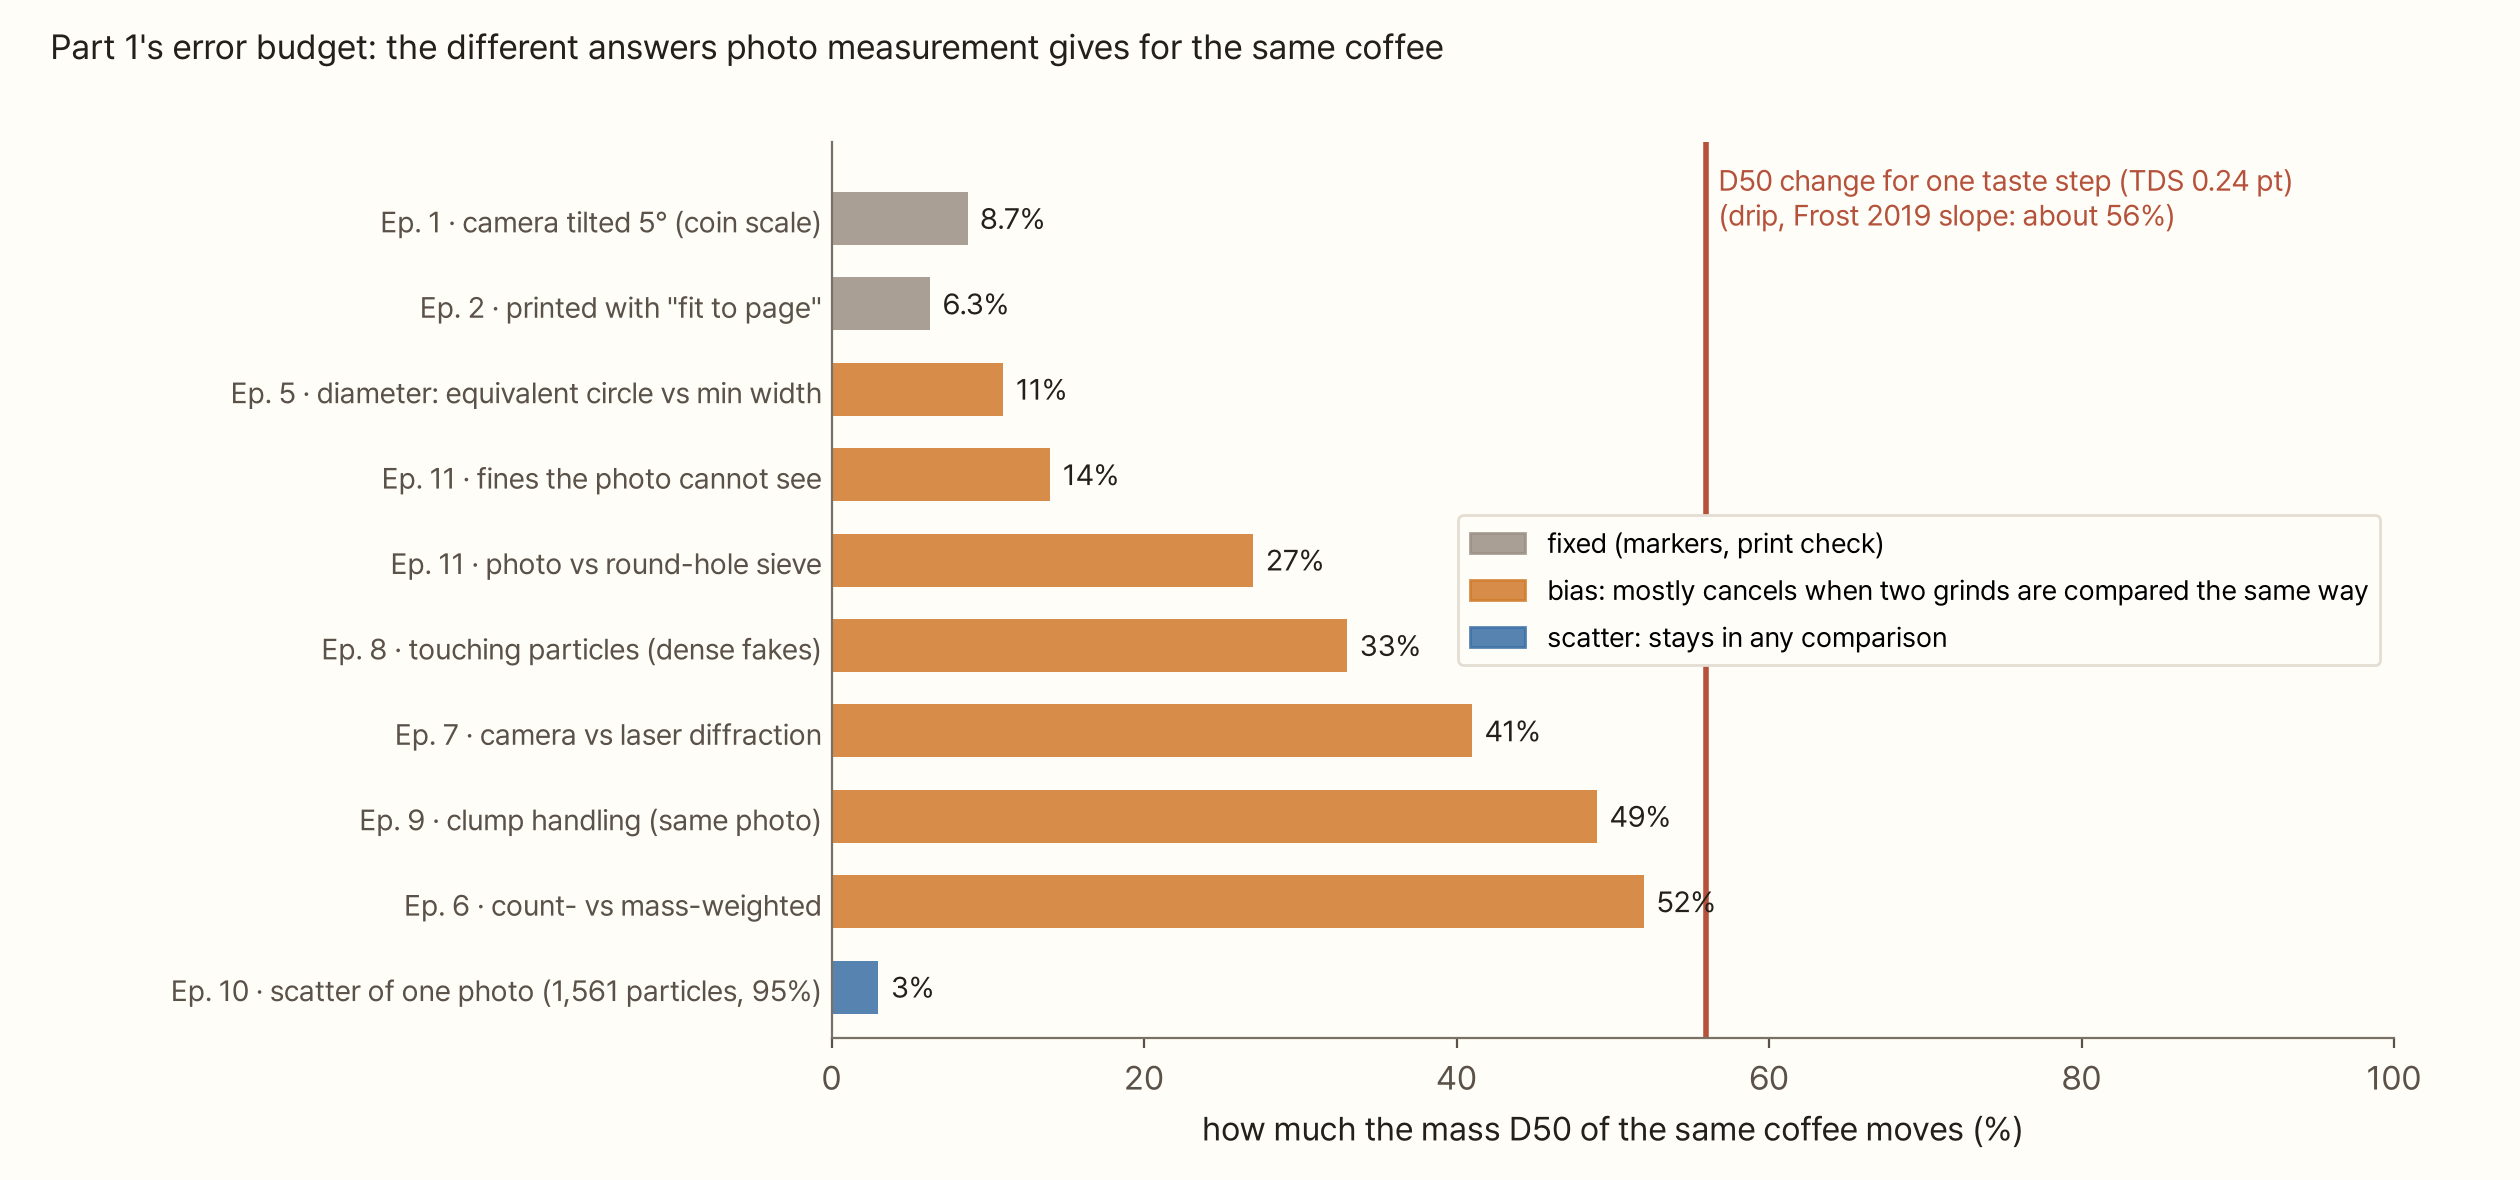
The two grey items were fixed with the marker sheet and the print check. The orange ones are large when you state "the true value in µm", but mostly cancel when you compare two coffees with the same method. What remains in the end, the blue scatter of one photo, is 3%. Set against the red line, the use of photo measurement becomes clear.
- For comparing grinds as you change them, the photo is far more sensitive than the tongue. It sees differences the tongue cannot feel
- For a single true number (what is this coffee's D50 in µm?), you have to state the method. Changing the definition moves it by up to 50%
- The photo cannot see fines. And fines change taste through the water's path, not through the inside of the particles
I am also releasing a tool that puts Part 1's measurement on one page. Coffee Grind Meter v1 measures the particle-size distribution from one photo of coffee grounds spread on paper. The photo is processed only in your browser and is not sent anywhere. If the marker sheet (Ep. 2) is in the photo, it finds the scale and tilt by itself; otherwise you click two points or type in µm/px. It includes background flattening and the threshold (Ep. 4, 8), definitions of diameter (Ep. 5), count, volume and area × width weighting (Ep. 6, 11), flags for likely clumps (Ep. 9), and bootstrap 95% intervals with effective sample size (Ep. 10), and each warning names its episode. On Gagné's example photo and on fake photos it gives the same numbers as this series' Python code. It has not yet been tested enough on marker sheets photographed with a real phone, so please let me know if you get results that look off.
What this conclusion leaves out
- The tongue's scale is coarse. 0.24 points is a rough value read from six triangle-test pairs, and that pair differed in basket shape as well as TDS. Remember too that drip coffees brewed under the same conditions varied in TDS from 0.65% to 1.0% (Frost 2019). The hand that brews each cup can make a bigger difference than a notch on the grinder
- There are routes outside TDS and EY. Cameron et al. (2020) showed that espresso at 22% extraction can be made at grind settings 1.3 and 2.0, and wrote that the two shots cannot have the same composition. On taste, though, they only said differences "were noted but not quantified". The aroma and bitterness differences that trained panels pick up in descriptive analysis lie outside this episode's 0.24 points
- The drip slope is a line extended from one measured point. The 56% rests on the assumption that the TDS difference is proportional to the log of D50. The effect of the grind on the water's path in drip is not in the model
- The immersion model is simple. Shell thickness, diffusion coefficient and equilibrium yield were each taken from a different source. With cold water, as in cold brew, diffusion is several times slower (Spiro and Selwood 1984: heating from 26 °C to 84 °C made extraction from the same particles 8 times faster)
- Espresso is not covered. In espresso the grind changes pressure and flow altogether, and fines blocking the water's path matter most there
- The AI test is small. Twelve fake photos, two models, one question. With messier photos like real phone shots, or with a different question, the results could change
Summary
- The taste of drip coffee mostly follows two numbers, TDS and EY. With those two matched, changing the temperature left the trained panel's taste map almost unchanged
- In triangle tests, people could not tell apart a 25% difference in median particle size (TDS +0.15–0.16 pt). The sensory threshold for drip TDS was estimated at about 0.24 points
- Immersion is insensitive to the grind. At equilibrium (about 20 minutes) TDS was 1.36 ± 0.09% even with a 2.3-fold difference in median size, and in the model a 4-minute steep stayed below one step of the tongue even when D50 doubled
- In drip, one step of the tongue takes a D50 difference of 50% or so (a rough value from extending Frost's measured slope). Photos taken the same way tell apart differences from 4%
- Fines the photo cannot see barely changed TDS in an immersion cup. Fines change taste through the water's path
- AI eyeballing got the mass D50 of the fake photos with median errors of 7–13%, but was pulled towards common sizes and could not get the count median or the fines
A difference in the graph is not always a difference on the tongue. A photo is a ruler more than ten times finer than the tongue. That fineness is less useful for pinning down taste like a true answer than for recording what changed when you brew the same coffee by the same hand and change only the grind.
References
- Frost SC, Ristenpart WD, Guinard J-X (2019). Effect of basket geometry on the sensory quality and consumer acceptance of drip brewed coffee. Journal of Food Science 84(8), 2297–2312. doi:10.1111/1750-3841.14696 — triangle tests of basket shape × grind; TDS difference threshold estimated at 0.24 pt
- Batali ME, Ristenpart WD, Guinard J-X (2020). Brew temperature, at fixed brew strength and extraction, has little impact on the sensory profile of drip brew coffee. Scientific Reports 10, 16450. doi:10.1038/s41598-020-73341-4
- Frost SC, Ristenpart WD, Guinard J-X (2020). Effects of brew strength, brew yield, and roast on the sensory quality of drip brewed coffee. Journal of Food Science 85(8), 2530–2543. doi:10.1111/1750-3841.15326 — abstract only
- Guinard J-X, Frost SC, Batali ME, Cotter AR, Lim LX, Ristenpart WD (2023). A new Coffee Brewing Control Chart relating sensory properties and consumer liking to brew strength, extraction yield, and brew ratio. Journal of Food Science 88(5), 2168–2177. doi:10.1111/1750-3841.16531 — abstract only
- Liang J, Chan KC, Ristenpart WD (2021). An equilibrium desorption model for the strength and extraction yield of full immersion brewed coffee. Scientific Reports 11, 6904. doi:10.1038/s41598-021-85787-1
- Listov-Saabye F (2014). Grinding Research Report. Nordic Barista Cup / SCAE. — non-peer-reviewed industry report; triangle tests of flat vs conical burrs matched at 1.43% TDS
- Morresi AM, Truglio K, Specchio J, Kerrihard AL (2021). Effects of grind size and brew time upon sensory traits, consumer likability and antioxidant activity of Arabica cold brew. International Journal of Food Science & Technology 56, 1929–1936. doi:10.1111/ijfs.14824 — abstract only
- Moroney KM, Lee WT, O'Brien SBG, Suijver F, Marra J (2016). Coffee extraction kinetics in a well mixed system. Journal of Mathematics in Industry 7, 3. doi:10.1186/s13362-016-0024-6
- Moroney KM, Lee WT, O'Brien SBG, Suijver F, Marra J (2016). Asymptotic analysis of the dominant mechanisms in the coffee extraction process. SIAM Journal on Applied Mathematics 76(6), 2196–2217. doi:10.1137/15M1036658 — coffee cell diameter 30 µm
- Cameron MI et al. (2020). Systematically improving espresso: insights from mathematical modeling and experiment. Matter 2(3), 631–648. doi:10.1016/j.matt.2019.12.019 — diffusion coefficient 6.25 × 10⁻¹⁰ m²/s
- Schmieder BKL, Pannusch VB, Vannieuwenhuyse L, Briesen H, Minceva M (2023). Influence of flow rate, particle size, and temperature on espresso extraction kinetics. Foods 12(15), 2871. doi:10.3390/foods12152871
- Spiro M, Selwood RM (1984). The kinetics and mechanism of caffeine infusion from coffee: the effect of particle size. Journal of the Science of Food and Agriculture 35(8). doi:10.1002/jsfa.2740350817 — abstract only
- Rahmanzadehgervi P et al. (2024). Vision language models are blind. arXiv:2407.06581
- Tamarapalli JS et al. (2025). CountQA: How well do MLLMs count in the wild? arXiv:2508.06585
- Gagné J. coffeegrindsize. GitHub. link — example photo
Image credits
- All figures, the simulation and the grind meter: made by me. The photos used in the AI test were made with the fake-coffee generator from Episode 8. The real photo is the example photo from Jonathan Gagné's coffeegrindsize (MIT licence)