Checking Photos Against Sieves
When you calibrate coffee-grounds photos against a sieve such as Kruve, what exactly are you calibrating? I ran round-hole sieves, square-mesh sieves and a photo on the same virtual coffee. The photo D50 came out 27% above the round-hole sieve (11% from the definition of diameter, 14% from unseen fines). A single factor missed by 7–10% when the fines share changed, but adding the weight from one 300 µm sieve to the photo's width matched within 1%.
In the last episode I measured how much the answer from one photo wobbles. Counting more particles shrinks the scatter, but if the measurement leans one way, no number of photos moves it toward the truth. So how do you catch the lean? Only by holding the photo up against another measurement whose answer you trust. The most common "other measurement" a home barista can get hold of is a sieve.
Unspecialty's column "Developing a Grind-Size Guide" also calibrated its photo measurement against Kruve sieves. This episode asks what exactly that calibration calibrates: how differently a sieve and a photo answer for the same coffee, where the difference comes from, and on which coffees a single conversion factor goes wrong.
What does a sieve measure?
Episode 7 lined up the sieve, the laser and the camera. There I assumed the sieve had square openings like a standard test sieve. Kruve is different. It does not weave wire into a mesh; it cuts holes in thin stainless-steel sheet by photo-etching. Zoom into a retailer's product photo and the holes are circles packed in a staggered, honeycomb-like pattern. Kruve's official page gives neither the hole shape nor a numerical tolerance on hole size. The current model takes up to fifteen sieves, which retailers list as 200 µm to 1,600 µm in 100 µm steps. The virtual sieves in this episode use the same fifteen sizes.
Why does hole shape matter? A sieve asks whether a particle's smallest cross-section can get through. Call a coffee fragment's length seen from above a, its width b and its thickness c (a ≥ b ≥ c). The fragment can go in end-first along its length, so what the sieve sees is the cross-section made of width b and thickness c.
- A round hole (diameter D) lets the cross-section through if b ≤ D. Treating the cross-section as an ellipse, its long side b just has to be smaller than the hole diameter
- A square opening (side w) lets you tilt the cross-section diagonally. An elliptical cross-section fits inside the square if √((b² + c²)/2) ≤ w. A very flat fragment gets through with b up to 1.41 (√2) times w, while one with a round cross-section stops at b = w
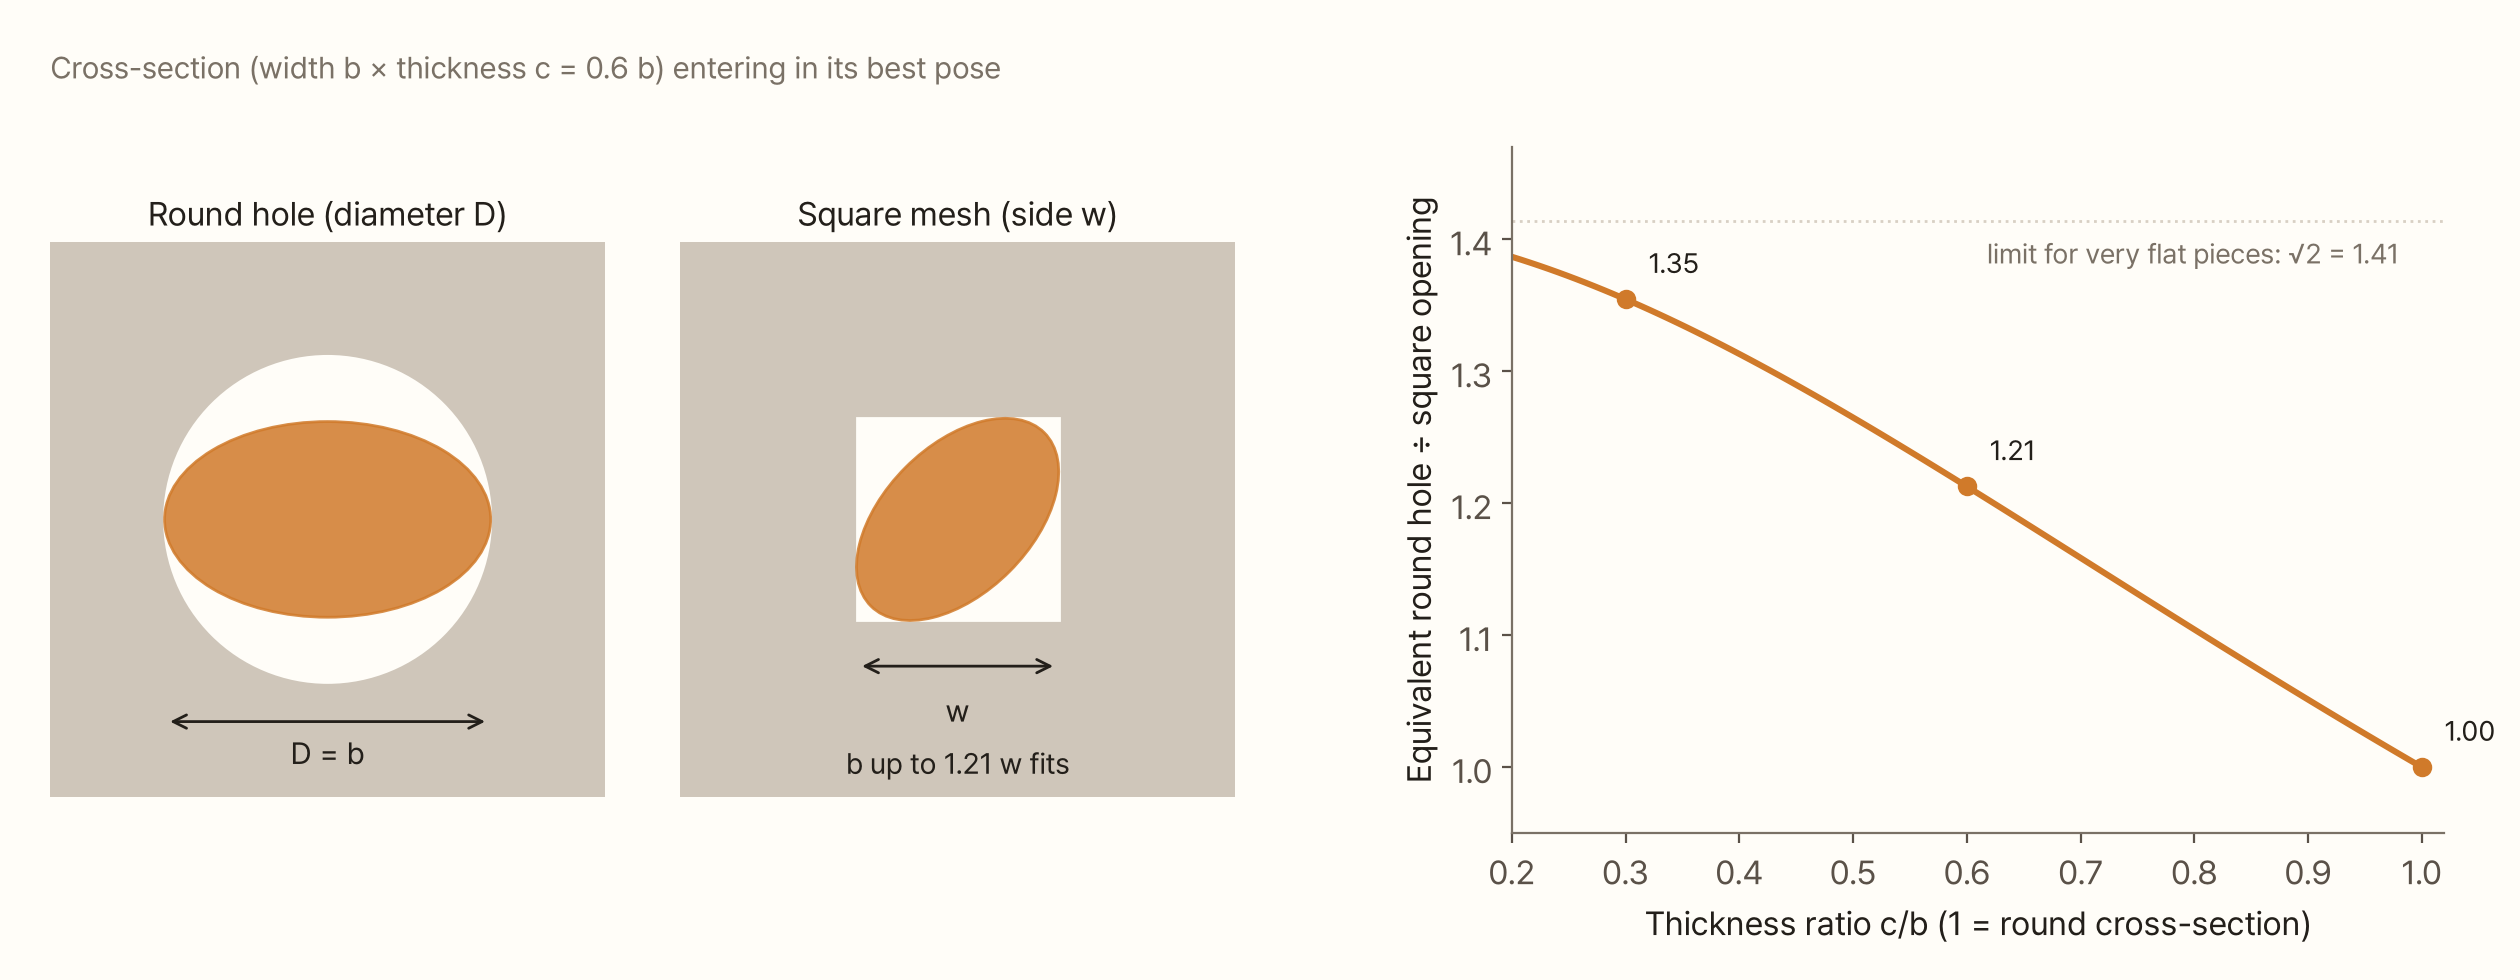
So to hold back the same particle, a round hole has to be bigger than a square opening: 1.21 times bigger for a fragment whose thickness is 0.6 of its width. The standards I looked at gave no fixed factor for reading round-hole and square-mesh sieves against each other. The conversion moves from 1.0 to 1.4 with the thickness ratio. Nobody has properly measured how flat coffee fragments are, so you should not read Kruve's "800 µm" and a standard sieve's "800 µm" on the same scale.
I ran this series' virtual coffee (the bimodal model from episode 6, thickness ratio 0.6) through both kinds of sieve. The round-hole sieve gave a mass median (D50) of 770 µm, the square-mesh sieve 662 µm. Same coffee, same nominal numbers, 16% apart.
Round holes have one advantage. Passage depends on width b alone, so the cut is the same whatever the thickness. Moving the thickness ratio from 0.3 to 1 left the round-hole D50 at 768–772 µm, hardly moving. The square-mesh D50 moved 29%, from 574 µm to 741 µm. If thickness is uniform regardless of size, the round-hole sieve's answer is simply "the mass distribution counted by width", a quantity a photo can measure.
Photographing the sieved fractions
The most direct way to link a sieve and a photo is to photograph each sieved fraction. Photograph the particles in the 600–700 µm fraction and measure their photo diameter, and you see at once what size that fraction looks like in a photo.
I could not do this with real sieves. Instead I used the 1,578 particles in Gagné's example photo. For each particle I took the minimum caliper width (Fmin) as the round-hole passage width b, sorted particles into virtual sieve fractions, and collected the photo diameter (ECD, the diameter of the circle with the same area) in each. The assumption is that a fragment lying on paper shows its width b as its Fmin.
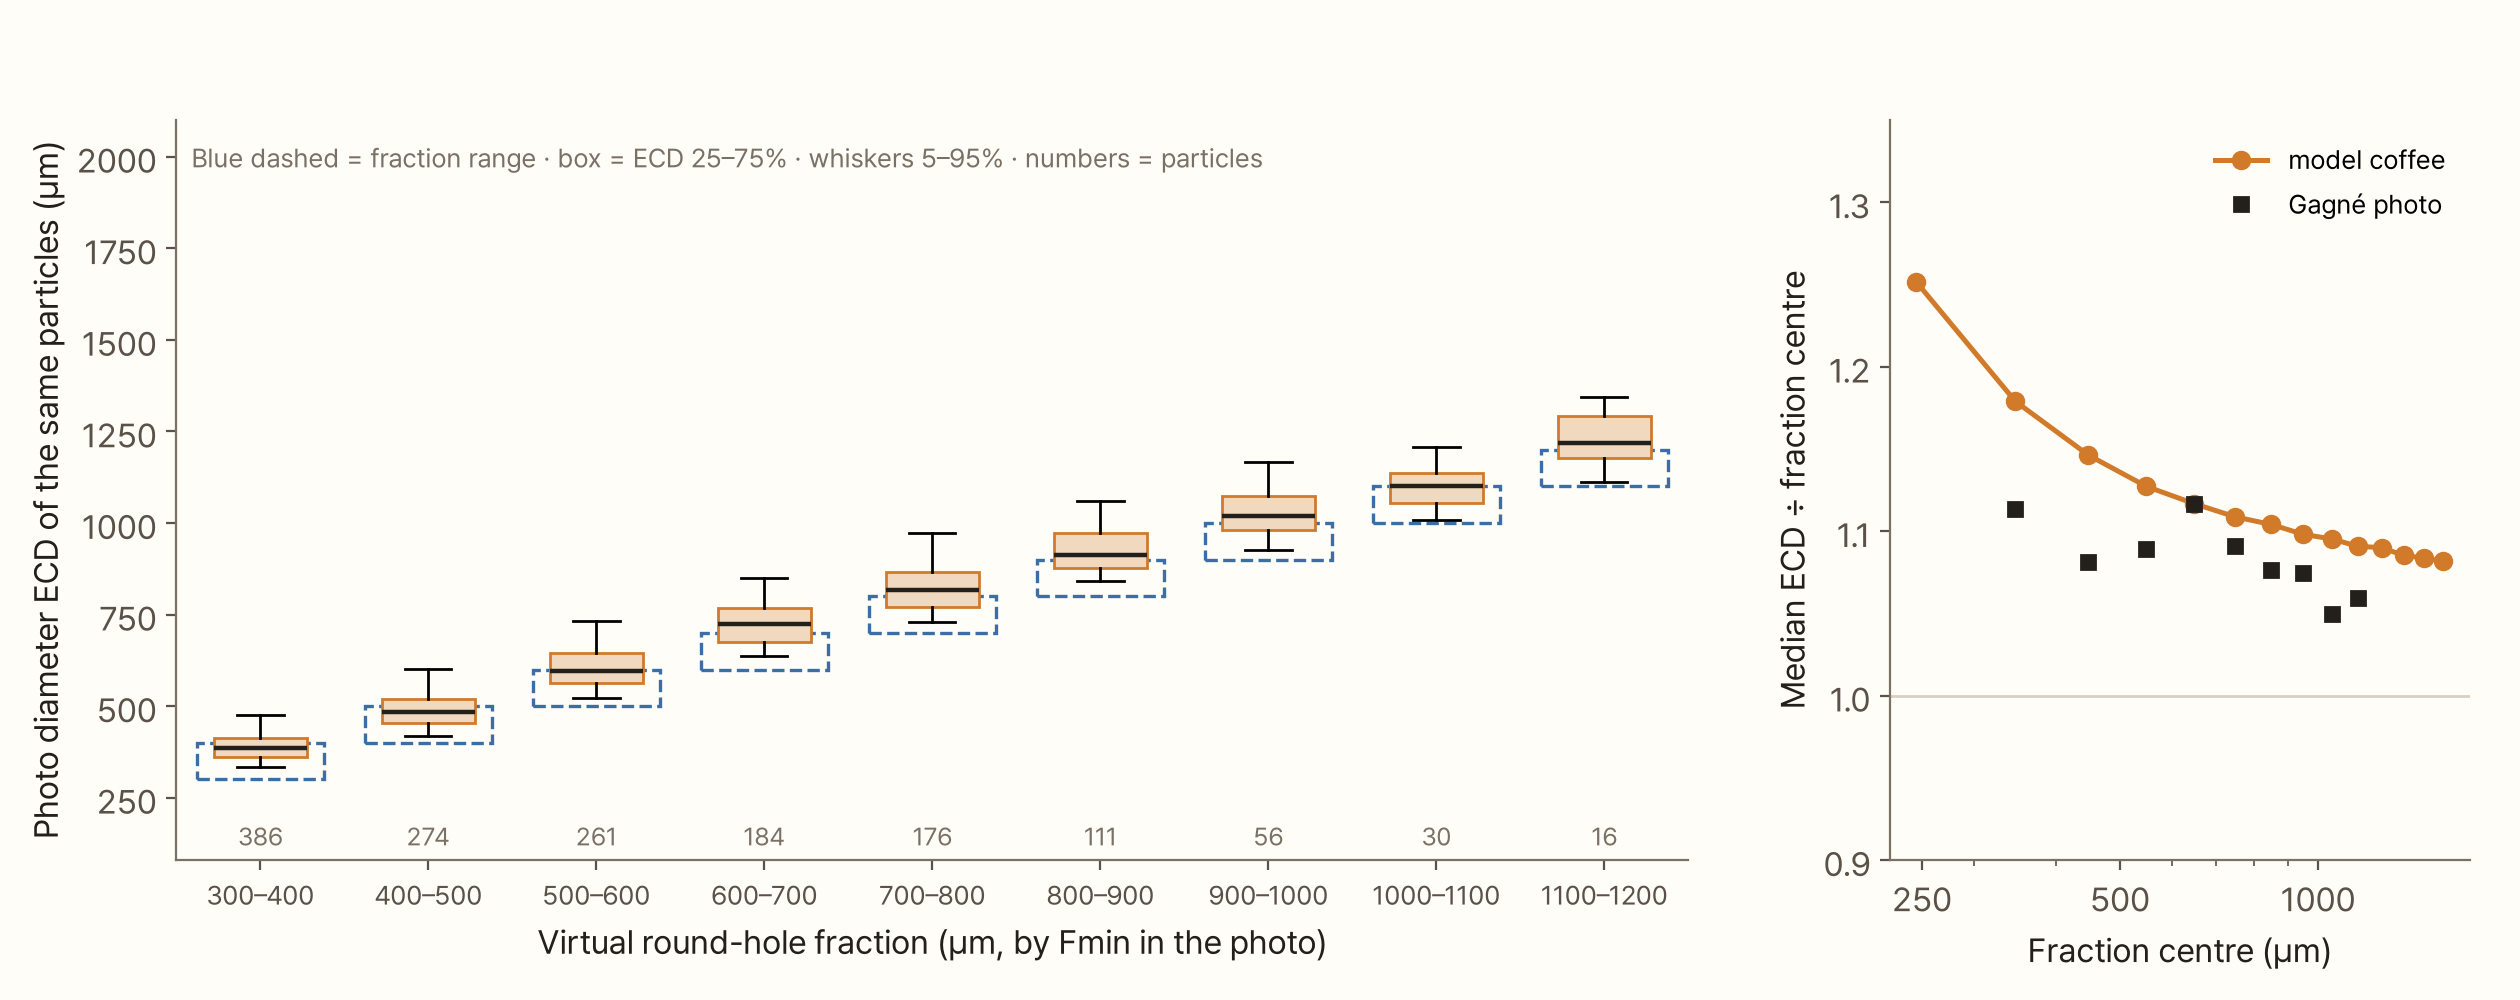
Particles from the same fraction came out at quite different sizes in the photo. Of the 1,494 particles of Gagné's photo in the 300–1,200 µm fractions, 49% fell outside their own fraction when measured by photo diameter, and almost all of those (48%) toward the fraction above. In every fraction the median photo diameter was 5–12% larger than the fraction centre. Photo diameter folds the length of an elongated fragment into its area, while a round hole sees only the width. Across Gagné's whole photo, the median Fmin ÷ ECD was 0.91.
In the model coffee the ratio grew in smaller fractions (1.25 in the 250 µm fraction). Many particles sit near fraction edges, and within a fraction the distribution leans toward the small side. The factor that turns photo diameter into sieve size has to be set fraction by fraction.
Same coffee, different answers
Now compare the whole coffee. This series' photo measurement uses ECD, drops everything below 330 µm (an area of 40 pixels) and weights volume by ECD³. Measuring the same virtual coffee with a round-hole sieve and with the photo gives this.
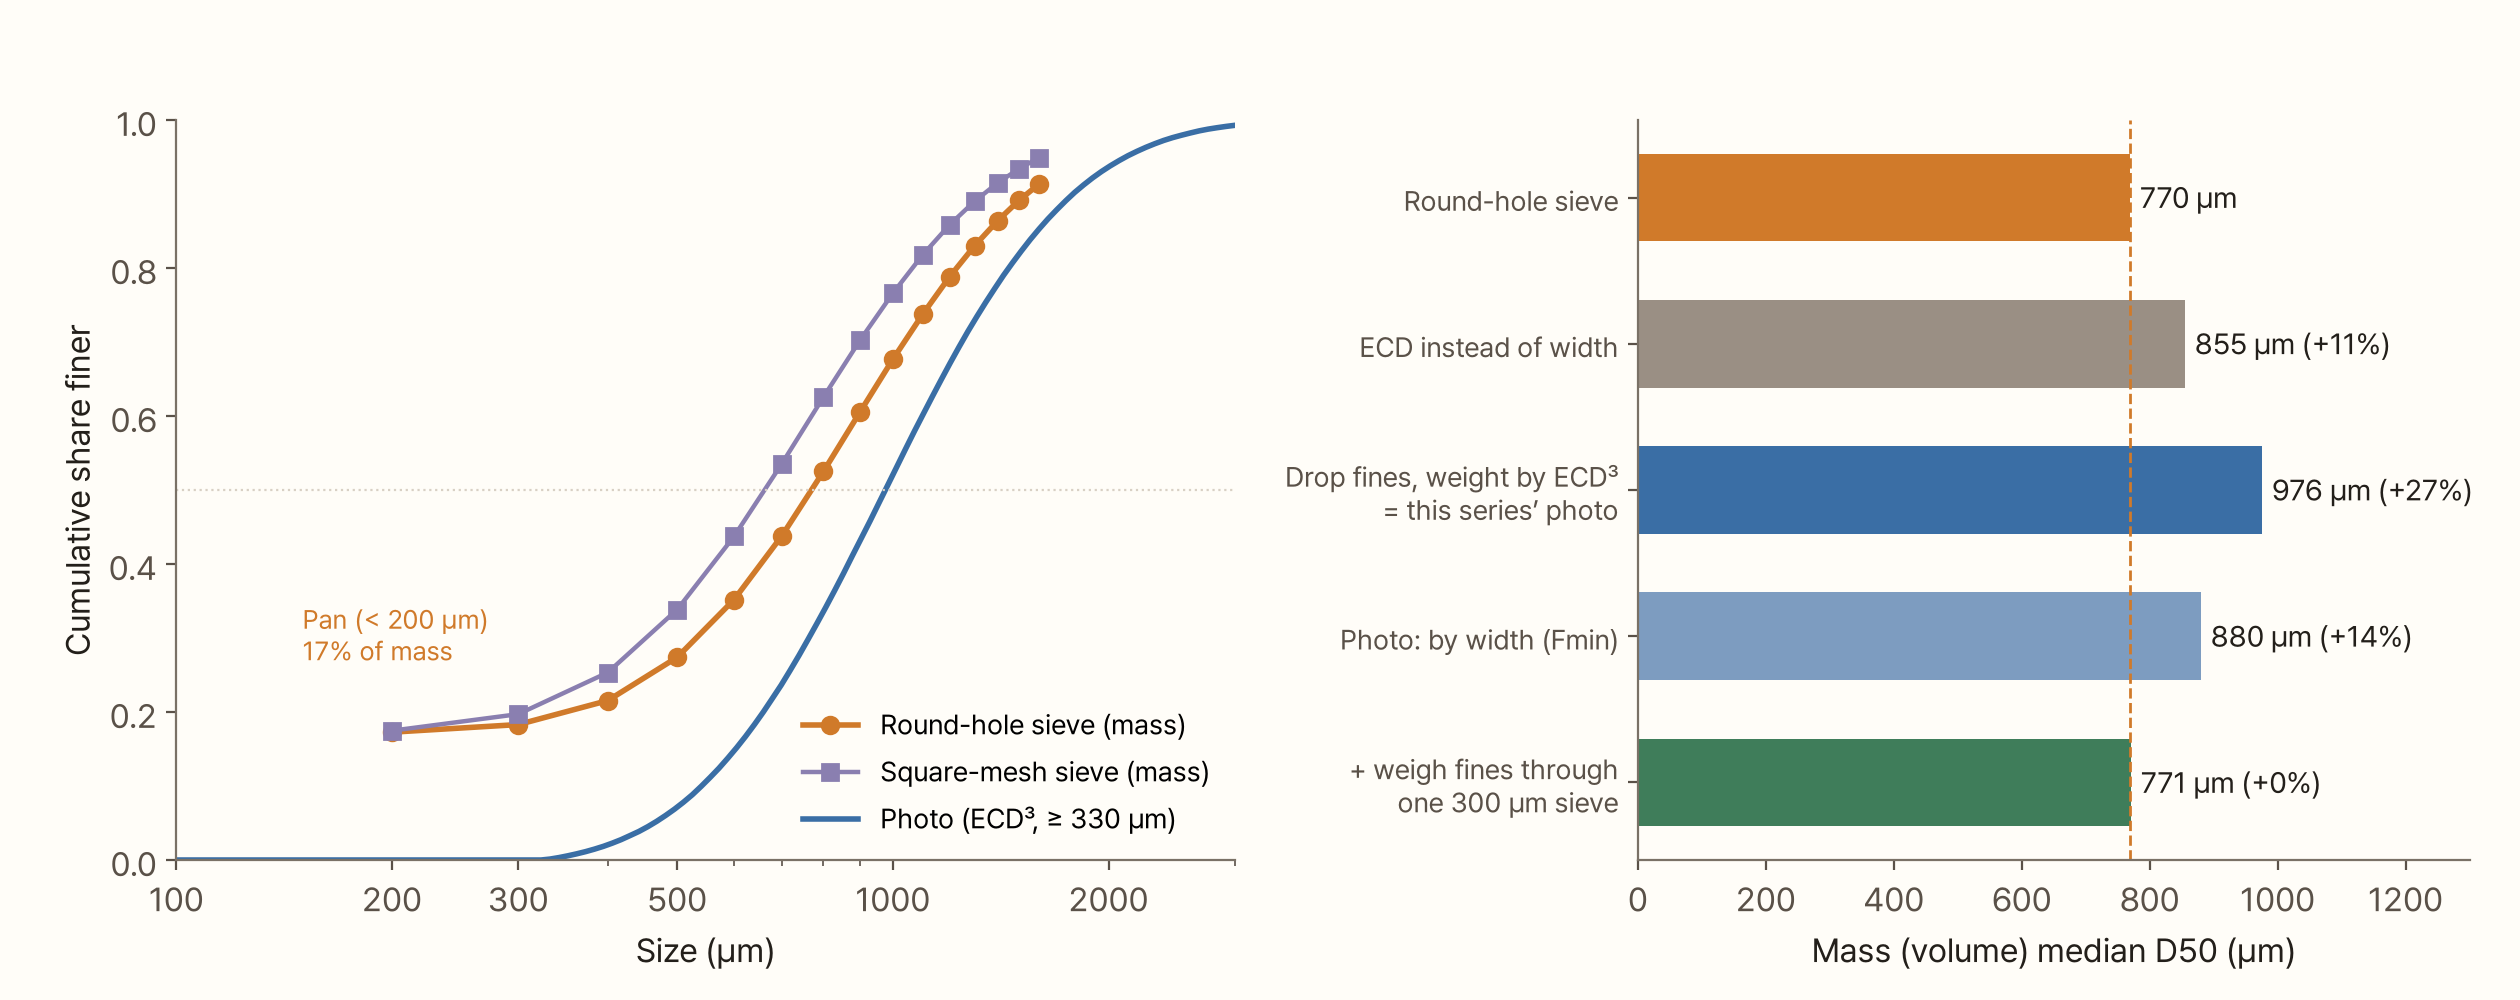
The photo D50 was 976 µm, 27% above the sieve. The gap splits into two parts.
- Definition of diameter (+11%). The sieve measures width, the photo measures area. Even counting every particle by its true mass, ECD gives 855 µm and width gives 770 µm
- Fines the photo cannot see (+14%). 17% of the mass falls into the sieve's pan (below 200 µm). The photo cannot see below 330 µm, so it leaves that mass out and takes the median of what remains
Neither is really the photo's fault. The photo answered a different question. So you can make the photo answer the sieve's question. Measure diameter by Fmin instead of ECD, and count mass as area × width (assuming thickness proportional to width). That brings the photo to 880 µm and the gap down to 14%. What remains is the fines, which a photo cannot solve, so a scale solves it. Sieve the grounds through a single 300 µm sieve, weigh what passes, and attach that share to the bottom of the photo distribution. That gives 771 µm, within 0.2% of the sieve.
Linking them with one factor
The easiest calibration is a single factor. Work out sieve D50 ÷ photo D50 once, and from then on multiply the photo D50 by it. For this virtual coffee it is 0.789. The question is whether the factor holds for other coffees.
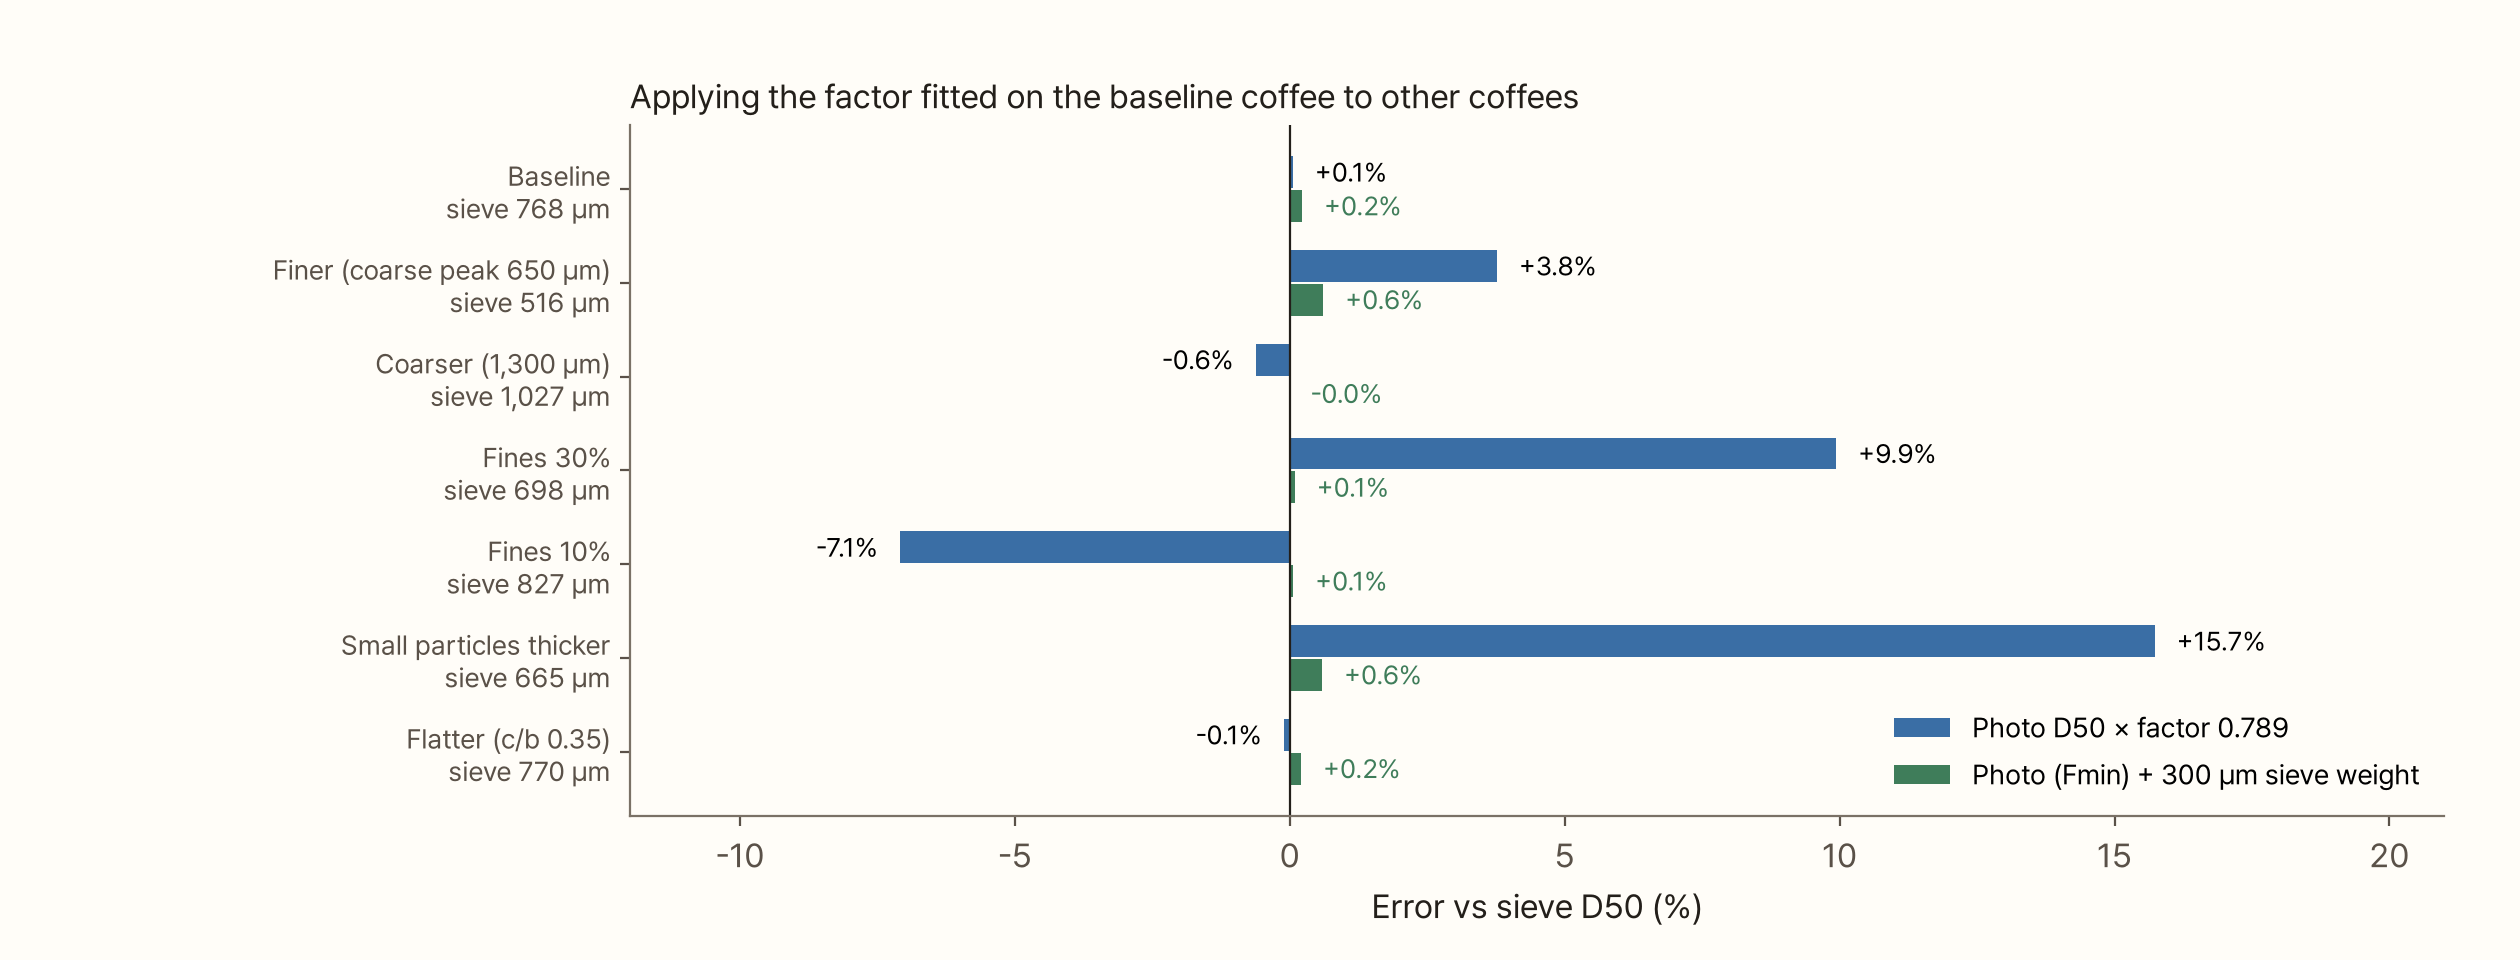
Changing the grind setting alone barely shook the factor. Moving the coarse peak from 970 µm to 650 µm or 1,300 µm kept the error within 4%. Making the coffee uniformly flatter left the factor untouched on round-hole sieves.
What shook the factor was the amount of fines. A factor fitted on a coffee with 20% fines by mass missed by +10% on a coffee with 30% fines and by −7% on one with 10%. The photo cannot see fines, so when they increase or decrease the photo D50 stays put and only the sieve D50 moves. Changing grinder or burrs changes the fines share; conical against flat, new burrs against seasoned ones, these are exactly such differences. A photo calibrated with a single factor cannot see them.
On a coffee where small particles are thicker (assuming the thickness ratio approaches 1 as fragments get smaller), the miss reached +16%. At the same width, thick fines weigh more, so the sieve's mass distribution shifts down.
Adding the 300 µm sieve weight to the photo's width matched within 1% in all seven cases. The scale measures the amount of fines directly, and most of the size-dependent thickness happens below 300 µm. But this result stands on two assumptions of the model: round holes filter by width, and the photo's Fmin is that width. How far real coffee fragments stray from these assumptions only a real sieve can tell.
A sieve has to be shaken to answer
To use a sieve as the truth, you need to know its errors too. Episode 7 only split "shaken enough" from "shaken briefly". This time I followed how the answer changes over time.
Sieving does not happen all at once. Particles much smaller than the holes drop quickly, but a particle nearly the size of a hole has to wait until it lands on a hole in just the right pose. Sieving theory commonly writes the chance of a sphere passing a square opening as proportional to (1 − particle size/opening size)², credited to Gaudin (1939). Including wire thickness w it reads ((a − d)/(a + w))² (a the opening, d the particle diameter): the fraction of area where a sphere dropped at random falls into the opening without touching wire. Real sieving has been reported to differ considerably from such formulas, so I borrow only the shape. With it, each shake lets a particle through with probability p₀ × (1 − b/D)². No one has measured p₀ for coffee, so I tried two values (0.5 per second and a third of that).
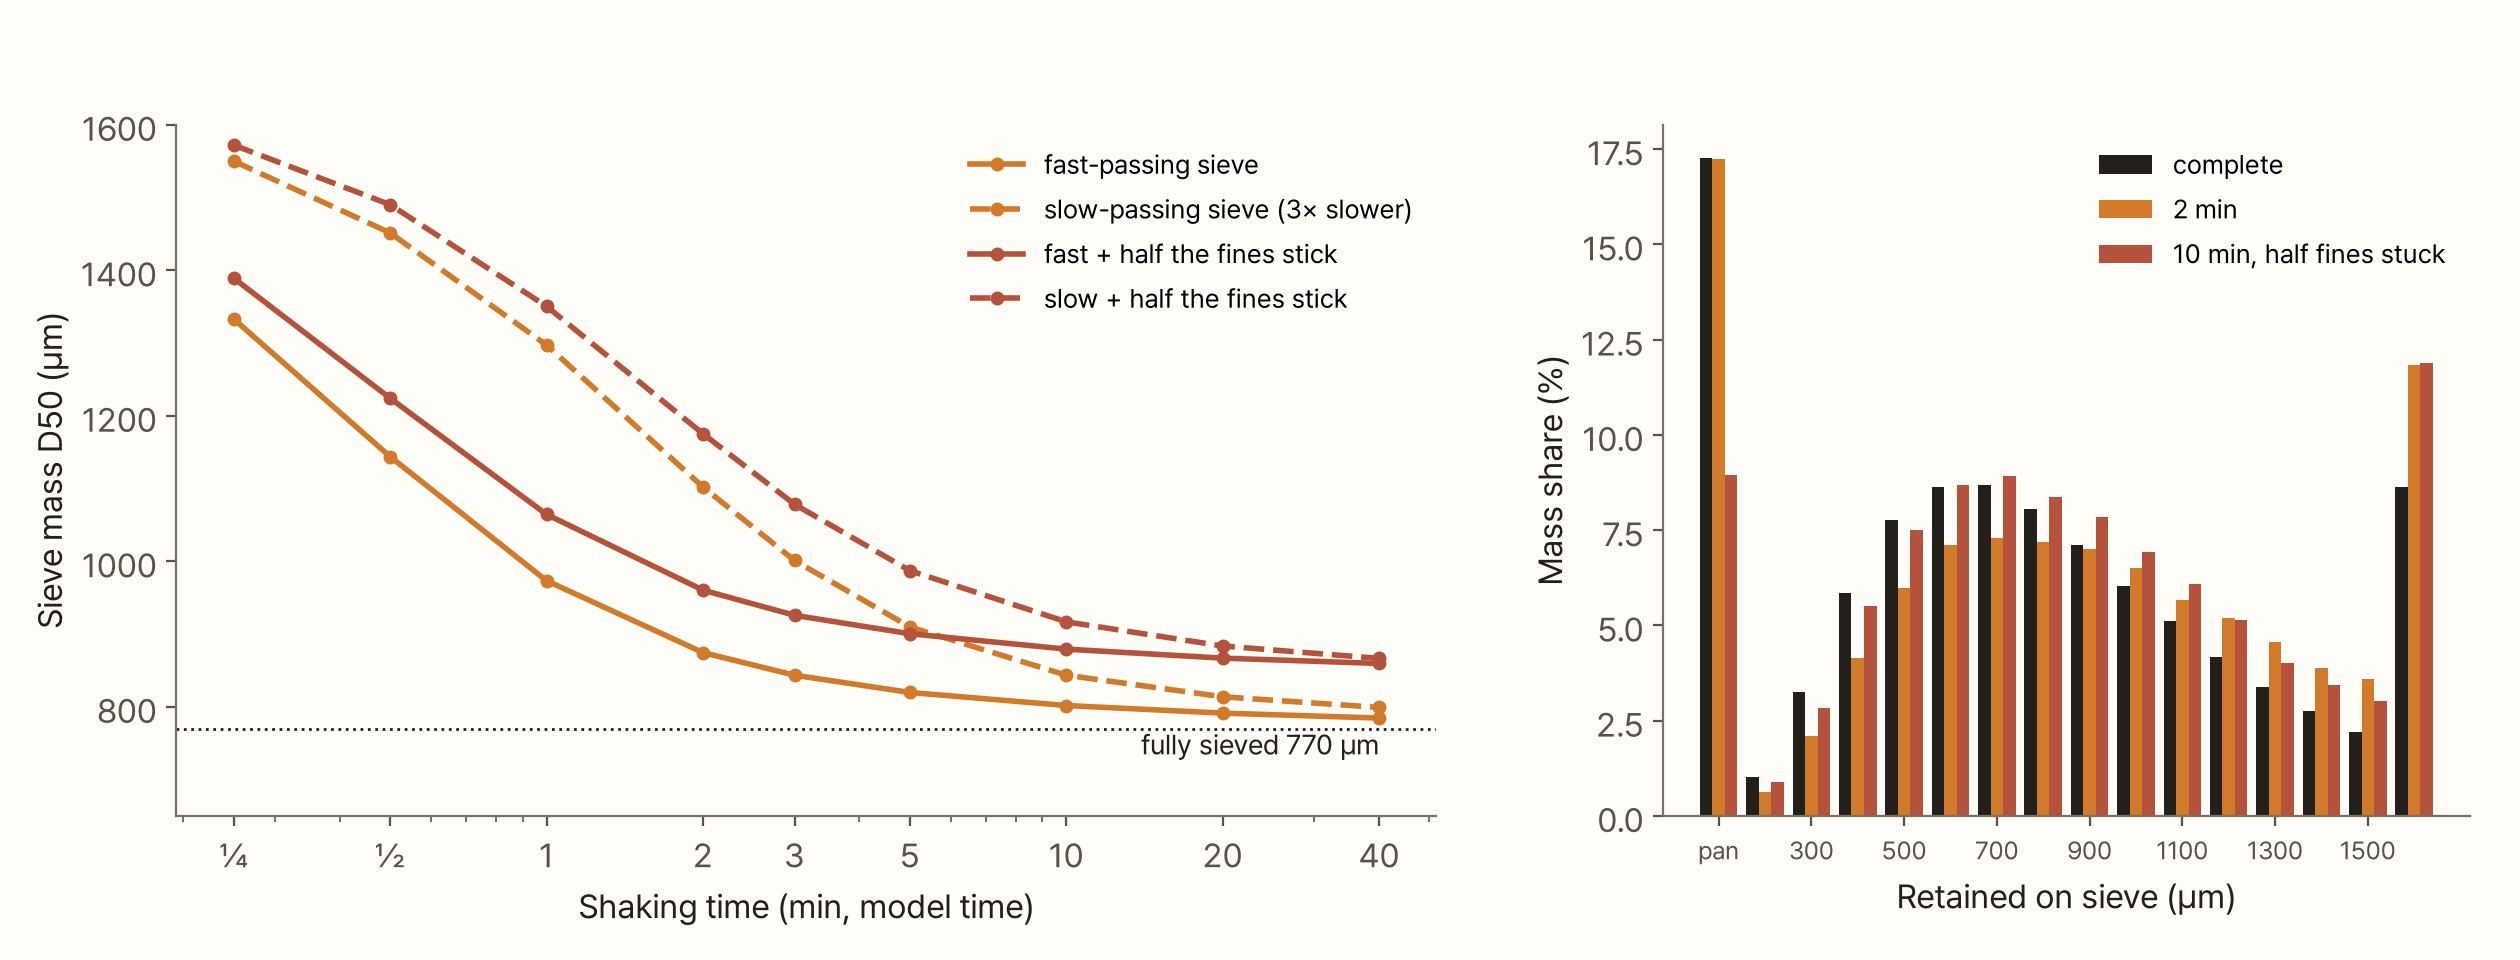
Two results. First, the fines reach the pan quickly but D50 takes a long time. Even on the fast sieve it was +14% at 2 minutes, +7% at 5 and +4% at 10. Particles close to the hole size keep sitting on the upper sieves, tilting the distribution coarse. These are model minutes, so the absolute times cannot be trusted. But with a passage probability of this shape, it is unavoidable that the sieve's answer moves by several percent depending on how many minutes count as "enough". Kruve describes sifting as taking less than a minute. One minute in this model was D50 +26%, but the model's clock has never been matched to a real one, so do not read that as Kruve's error. Whether the job is "done" after a minute is something to check on a scale.
Second, if fines stick to coarse particles, their mass stays on the coarse sieves however long you shake. If half of the fines below 100 µm stick, the pan drops from 17% to 9% and D50 stalls at +12%. Time cannot fix that bias. As episode 7 showed, freshly ground coffee carries static charge (Méndez Harper et al., 2024), and its oils make grounds cling together. I again found no data on how much fines actually stay stuck.
Calibrate a photo against a sieve and this bias moves straight into the photo. A single factor is a factor fitted to "that sieve, shaken for that long, on that day".
Try it yourself
In the virtual sieve below, press "Shake" and 24,000 particles fall through fifteen sieves. Orange bars are the mass left on each sieve so far, black lines what is left when fully sieved, and blue bars the volume the photo sees. The table on the right shows how the sieve D50 comes down over time and how far it is from the photo D50.
Switch between round holes and square mesh and move the thickness ratio. With round holes the black lines barely move; with square mesh they slide down as the ratio drops. Change the fines share and the photo D50 stays put while only the sieve D50 moves. Switch to "Photo: width + 300 µm sieve weight" and the photo D50 lands on the fully sieved value.
If you calibrate for real
Every calculation in this episode used sieves inside a computer. To do the same with a real Kruve, this order follows from what the calculations showed.
- Weigh the fines with one sieve first. The mass share passing a 300 µm sieve (or the nearest Kruve size) is a number the photo can never know. This one number fixes more than any single factor
- Shake longer and longer until the weights stop changing. If another minute barely changes any fraction's weight, call it done. If the end point differs between coffees, that difference goes straight into the sieve's answer
- Photograph each fraction. Sprinkle one fraction on paper and photograph it, and you see which Fmin and ECD that fraction shows in a photo. This is the direct test of the assumption that round holes filter by width
- Weigh each fraction and measure its area. Dividing a fraction's mass by the total area in its photo gives mean thickness × density. In the virtual experiment this recovered each fraction's thickness ratio exactly, which is no surprise since the model was built that way; with real coffee it becomes a first measurement. Thickness, which neither the sieve nor the photo sees alone, becomes visible when you use both. But if the particle density is 20% off, so is the thickness
What this experiment left out
- No real sieves. With neither a Kruve nor a standard sieve, I imitated round holes and square mesh with geometric conditions. Whether real coffee fragments pass the way these conditions say needs experiment 3 above
- The cross-section was treated as an ellipse. A fragment with corners fits a round hole less easily at the same width, which makes the sieve's answer larger
- The thickness ratio is assumed. I used 0.6 as the baseline and tried 0.3 to 1. I again found no direct measurement of coffee fragment thickness
- The passing speed p₀ and the share of sticking fines are not pinned down. Both are scenarios. Trust the shape of the time curves, not their absolute values
- Manufacturing error in hole size was not included. Kruve does not publish a numerical tolerance. If every hole on a sieve is a few percent too large or too small, that sieve's fraction boundary moves by as much
- Fmin in Gagné's photo is measured in pixels. As episode 3 showed, pixel edges inflate or shrink the width of small particles
Summary
- A sieve with round holes, like Kruve's, filters particles by width, while a square-mesh sieve lets flat fragments through diagonally. At the same nominal size they differ by 1.21× at a thickness ratio of 0.6, and this virtual coffee's D50 came out at 770 µm and 662 µm, 16% apart
- If thickness does not depend on size, the round-hole sieve's answer does not depend on thickness. It is "the mass distribution counted by width", so a photo can imitate it
- This series' photo D50 (976 µm) was 27% above the round-hole sieve: 11% from the definition of diameter (ECD against width), 14% from the fines the photo cannot see
- A single factor holds within 4% when the grind setting changes, but misses by 7–10% when the fines share moves by 10 percentage points, and by 16% when small particles are thicker
- Measuring the photo by width (Fmin) and area × width, then adding the weight from one 300 µm sieve, matched the sieve within 1% for all seven virtual coffees
- Sieves take time too. In the model it was +14% at 2 minutes and +4% at 10, and the +12% from stuck fines did not shrink with time
A sieve can be the photo's answer key. But an answer key carries its setter's habits. You need to know the hole shape, how long it was shaken and even that day's humidity before you can read the sieve's answer as the truth.
References
- Unspecialty (2023). "Developing a Grind-Size Guide" (분쇄도 가이드 개발기, in Korean). Link — earlier work that calibrated photo measurement against Kruve sieves
- Kruve. Kruve Sifter. Link — photo-etched stainless-steel sieves, up to fifteen sieves, "less than a minute to sift". Hole shape and tolerance are not stated. Hole shape checked by zooming into a retailer's product photo (Espresso Gear, 1400 µm sieve)
- Gaudin AM (1939). Principles of Mineral Dressing. McGraw-Hill. — probability of passing an opening, ((a − d)/(a + w))². Original not checked; the form is as textbooks and lecture notes attribute it to Gaudin
- ASTM E323. Standard Specification for Perforated-Plate Sieves for Testing Purposes. Link — perforated-plate test sieves with round or square holes
- ISO 3310-1. Test sieves — Technical requirements and testing — Part 1: Test sieves of metal wire cloth. — square-mesh test sieves
- Méndez Harper J et al. (2024). Moisture-controlled triboelectrification during coffee grinding. Matter 7(1), 266–283. doi:10.1016/j.matt.2023.11.005
- Gagné J. coffeegrindsize. GitHub. Link — example photo and particle measurement
Image credits
- All figures and the simulation: made by the author. The real photo is the example image from Jonathan Gagné's coffeegrindsize (MIT licence)