Four Points Are Enough
A single coin can't straighten a tilted photo. Stick four ArUco markers on the paper, and a perspective transform (homography) can flatten the shot — in synthetic-photo tests, the tilt error dropped from 7.7 percentage points to 0.08. But some error still remains, especially a print-scale problem that no photo alone can reveal, and that's what the marker sheet v1 introduced here is designed to catch.
In the last piece, we worked out where the one-coin method for fixing magnification goes wrong. Tilt the phone just 5° off parallel to the paper, and particles of identical size get measured almost 9 percentage points differently depending on where they land in the frame. But at that tilt, a coin looks only 0.4% out of round, so you can't even spot the tilt by looking at the coin. That's because a coin really only gives you one number: magnification.
Unspecialty's column "Developing a Grind-Size Guide" (2023) solved this by sticking four markers on the paper. This piece retraces that method from the ground up. Why does it have to be four points, how do markers tell you where those points are, and how much does the error actually shrink once you flatten a photo using four points? We'll also look at the errors a perspective transform ultimately can't fix. At the end, you'll find a marker sheet I designed myself, ready to download and print.
What the Floor Tiles Showed First
At the Galleria Nazionale delle Marche in Urbino, Italy, hangs a painting called The Ideal City. It's estimated to date from the 1480s and was once attributed to Piero della Francesca, though the artist is now unknown.
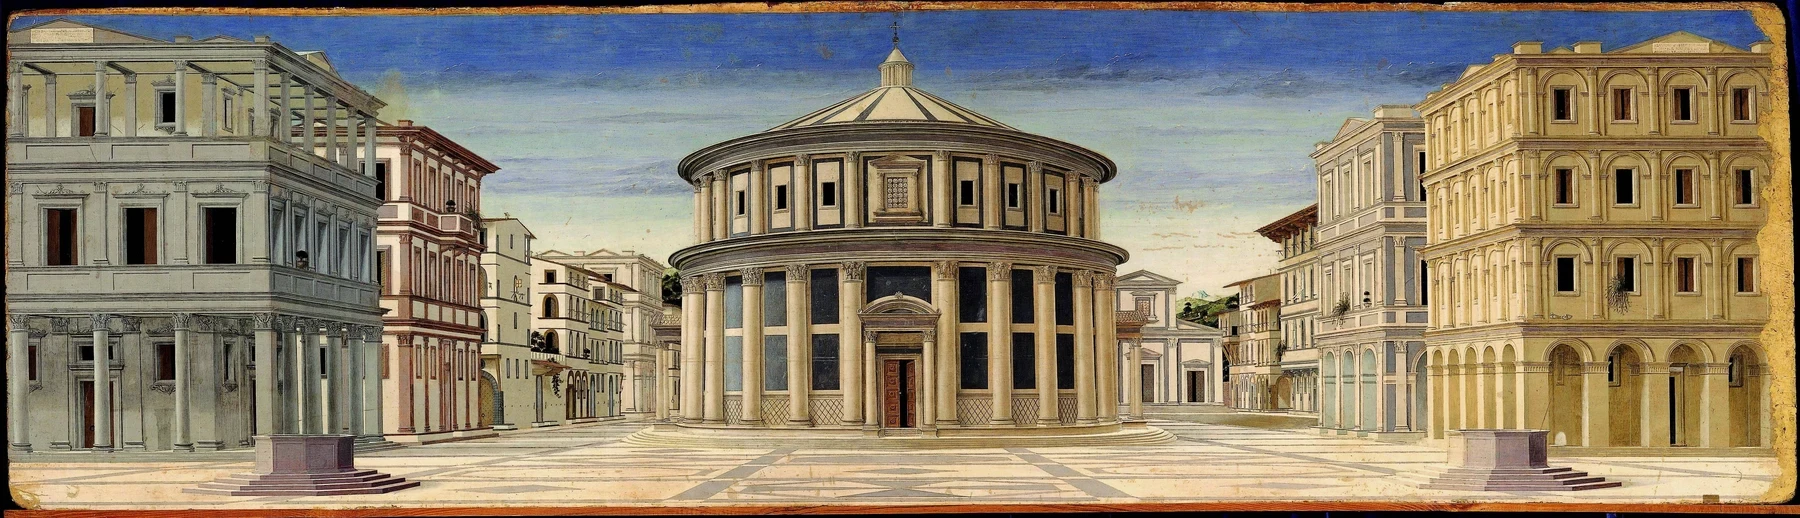
The Ideal City (probably 1480s, Galleria Nazionale delle Marche). The plaza floor's tile pattern is actually made of squares and diagonals, but in the painting it becomes a flattened trapezoid the farther back it goes. Painting: Unknown artist / Wikimedia Commons (public domain)
The plaza floor is a single flat plane. The painter moved that plane onto another plane — the canvas. The tiles in front are large; the ones further back are small. Lines that run parallel on the floor converge to a single point in the painting. And yet a straight line in the painting is still a straight line. It never bends.
This is exactly how the perspective transform that carries one plane onto another works. In computer vision, this transform is called a homography. A sheet of paper with scattered coffee grounds is a plane too, and so is a phone's camera sensor. A photo of paper taken with a tilted camera is in the same situation as the floor in The Ideal City. Squares become trapezoids, and particles closer to the camera get photographed larger.
Flip the logic around and the path becomes clear. Once you work out what the transform looks like, its inverse can restore the photo to how it would look from directly overhead. It's the same idea as knowing the tiles' true shape and using that to unflatten the trapezoids in the painting back into squares.
Eight Unknowns, Four Points
A homography is written as a single 3×3 matrix. Multiply this matrix by a point (x, y) on the paper, and you get the point (u, v) in the photo. The matrix has nine numbers, but multiplying the whole matrix by the same constant gives the same result. So one number can be fixed at 1, leaving only eight to determine.
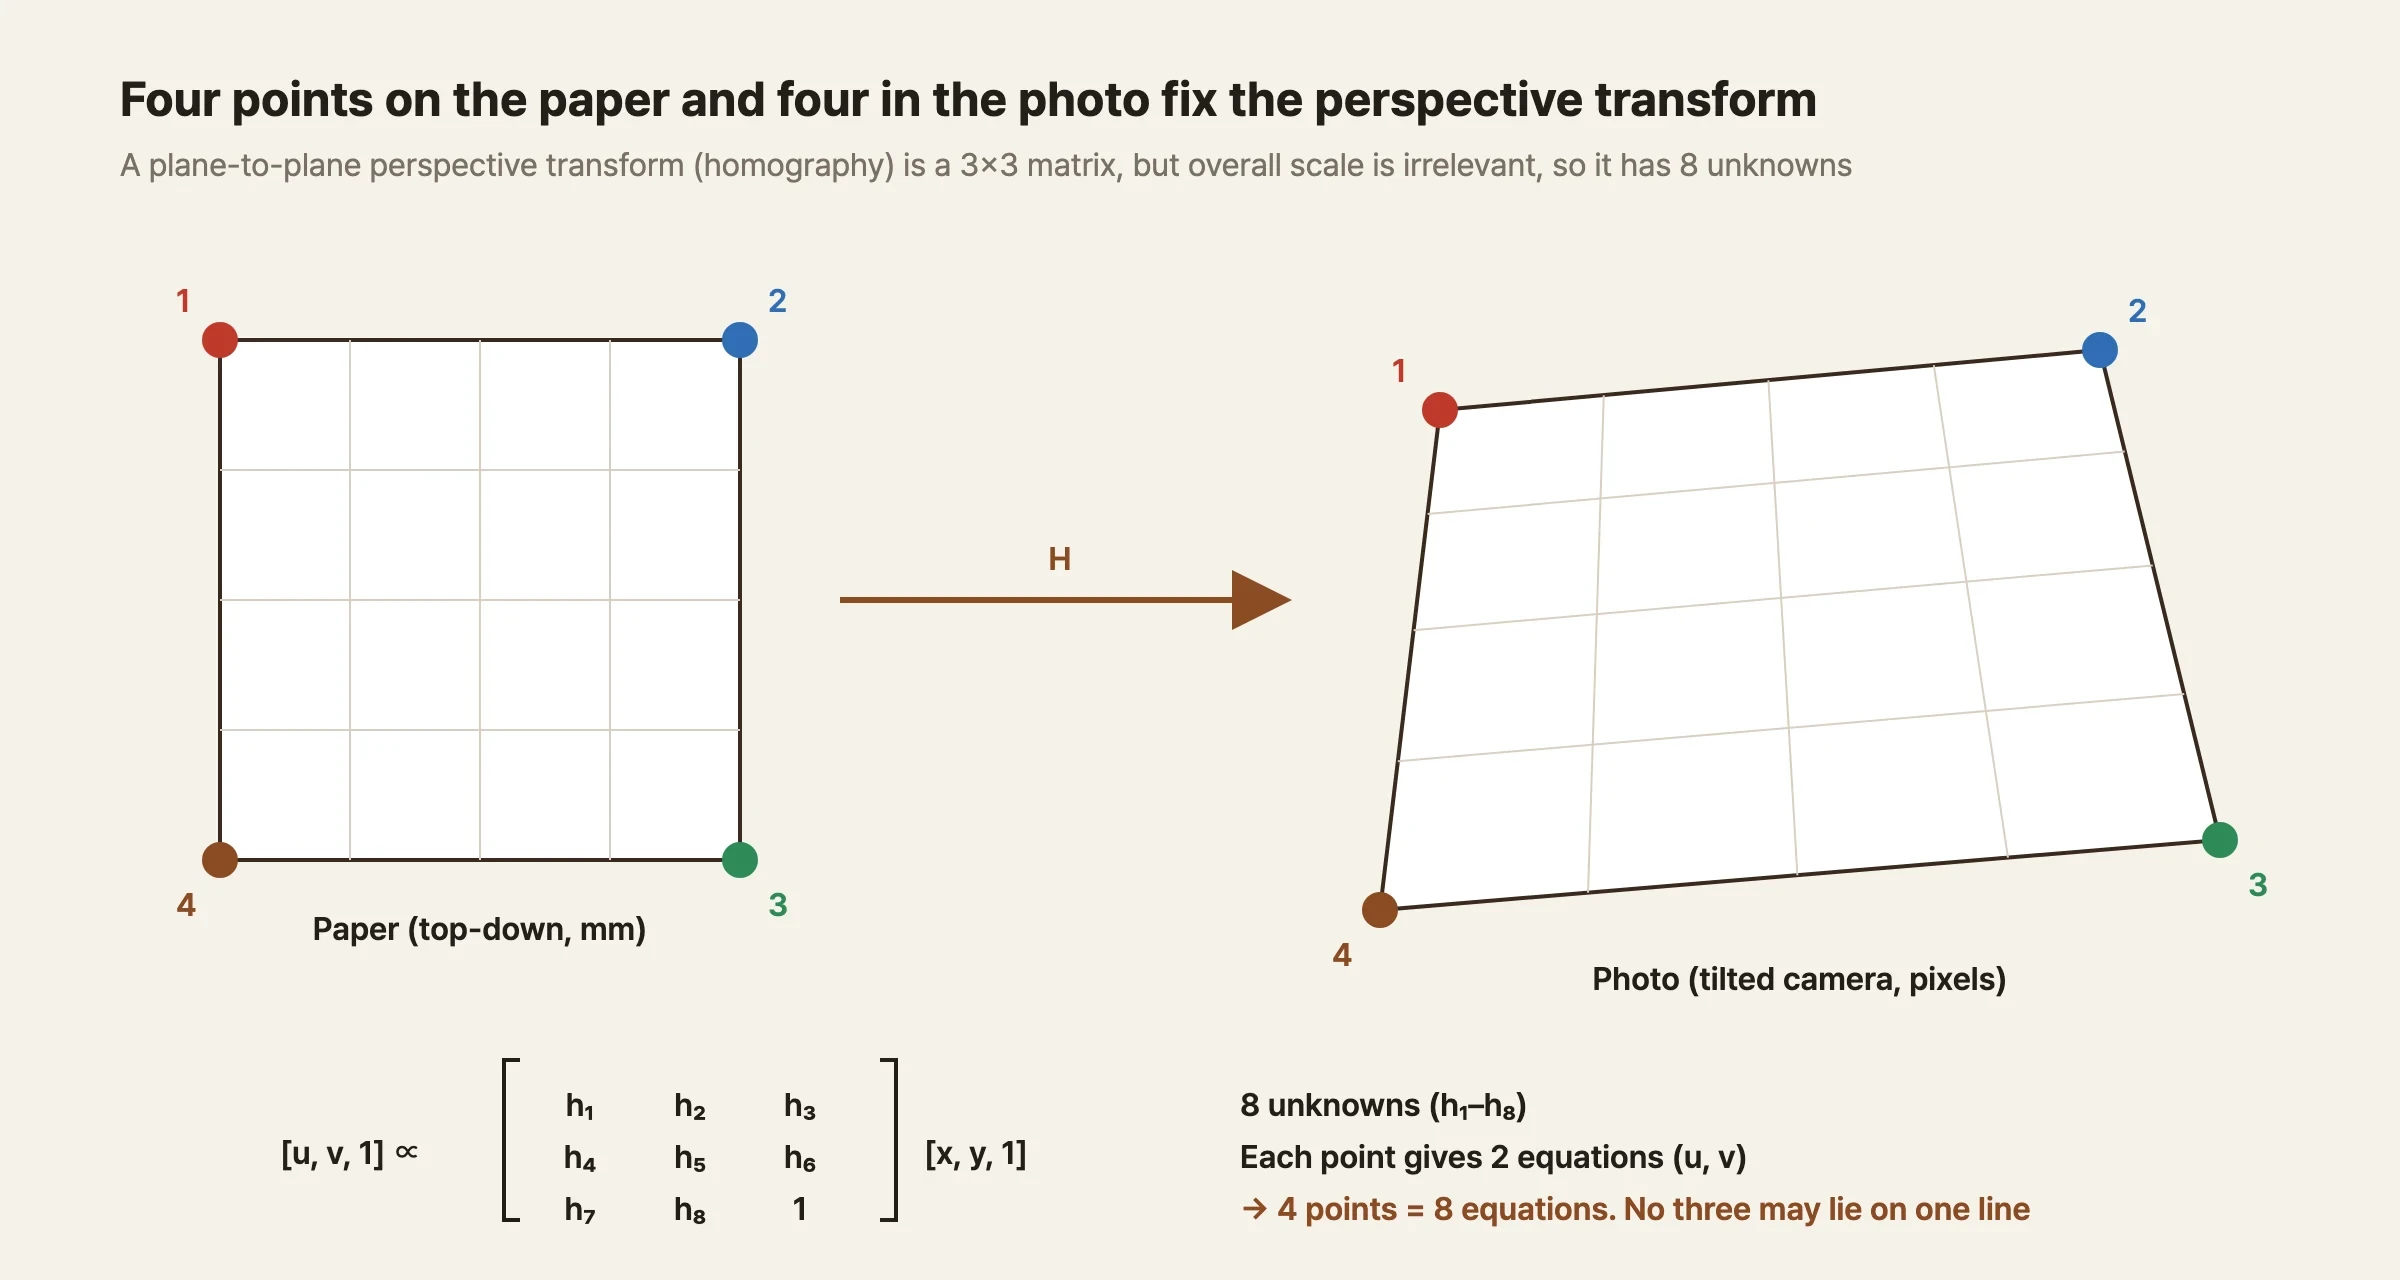
Locating, in the photo, one point whose position on the paper is known gives two equations: one for the photo's horizontal coordinate u, one for the vertical coordinate v. With eight unknowns, four points yield eight equations, which pins down the matrix. This is the basis for Unspecialty's claim that "at least four points are needed." The catch is that no three of the four points can lie on the same line — otherwise the equations overlap and the unknowns can't actually be solved.
A single coin can only tell you one of these eight values. Even if you measure the coin's edge carefully enough to capture the shape of its ellipse, you gain only a few more, and as we saw in the last piece, that information is nearly invisible at small tilt angles.
What if there are more than four points? When there are more equations than unknowns, there's no answer that satisfies every equation exactly. Instead, you pick the answer that minimizes the overall error (least squares). The small measurement errors scattered across each point cancel each other out, and the answer stabilizes. Here, plugging in raw coordinates directly mixes pixel values (in the thousands) with the constant 1 in the same equation, making the calculation unstable — so the standard approach is to first shift the coordinates near the origin and rescale them before solving (Hartley 1997). Functions like OpenCV's findHomography handle this process.
The Pattern That Tells You Where the Point Is
The equations themselves are simple. The hard part is finding the points within the photo. From a single photograph, you have to determine which point on the paper landed on which pixel — without human intervention, and with precision finer than a single pixel. Fiducial markers were built to do exactly this.
Fiducial markers first found their footing in augmented reality. To overlay a virtual object on a camera feed, you need to know at every instant where the camera is and which way it's facing. ARToolKit, released in 1999, used markers consisting of a picture inside a thick black border (Kato & Billinghurst 1999). After that, the approach of filling the inside of the border with black-and-white cells to encode a number spread widely. AprilTag (Olson 2011), widely used in robotics, and ArUco (Garrido-Jurado et al. 2014), used in this piece, are examples of this.
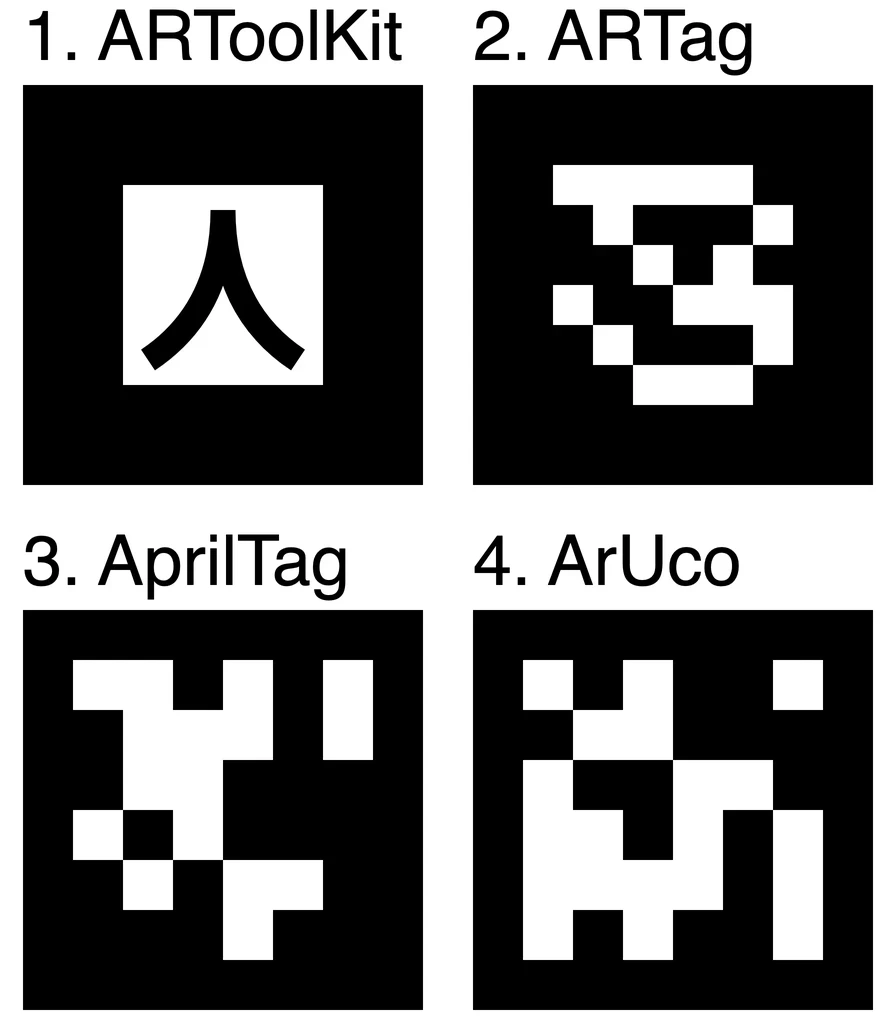
A few fiducial markers used in computer vision. Image: Cmglee / Wikimedia Commons (CC BY-SA 4.0)
A single ArUco marker tells you two things.
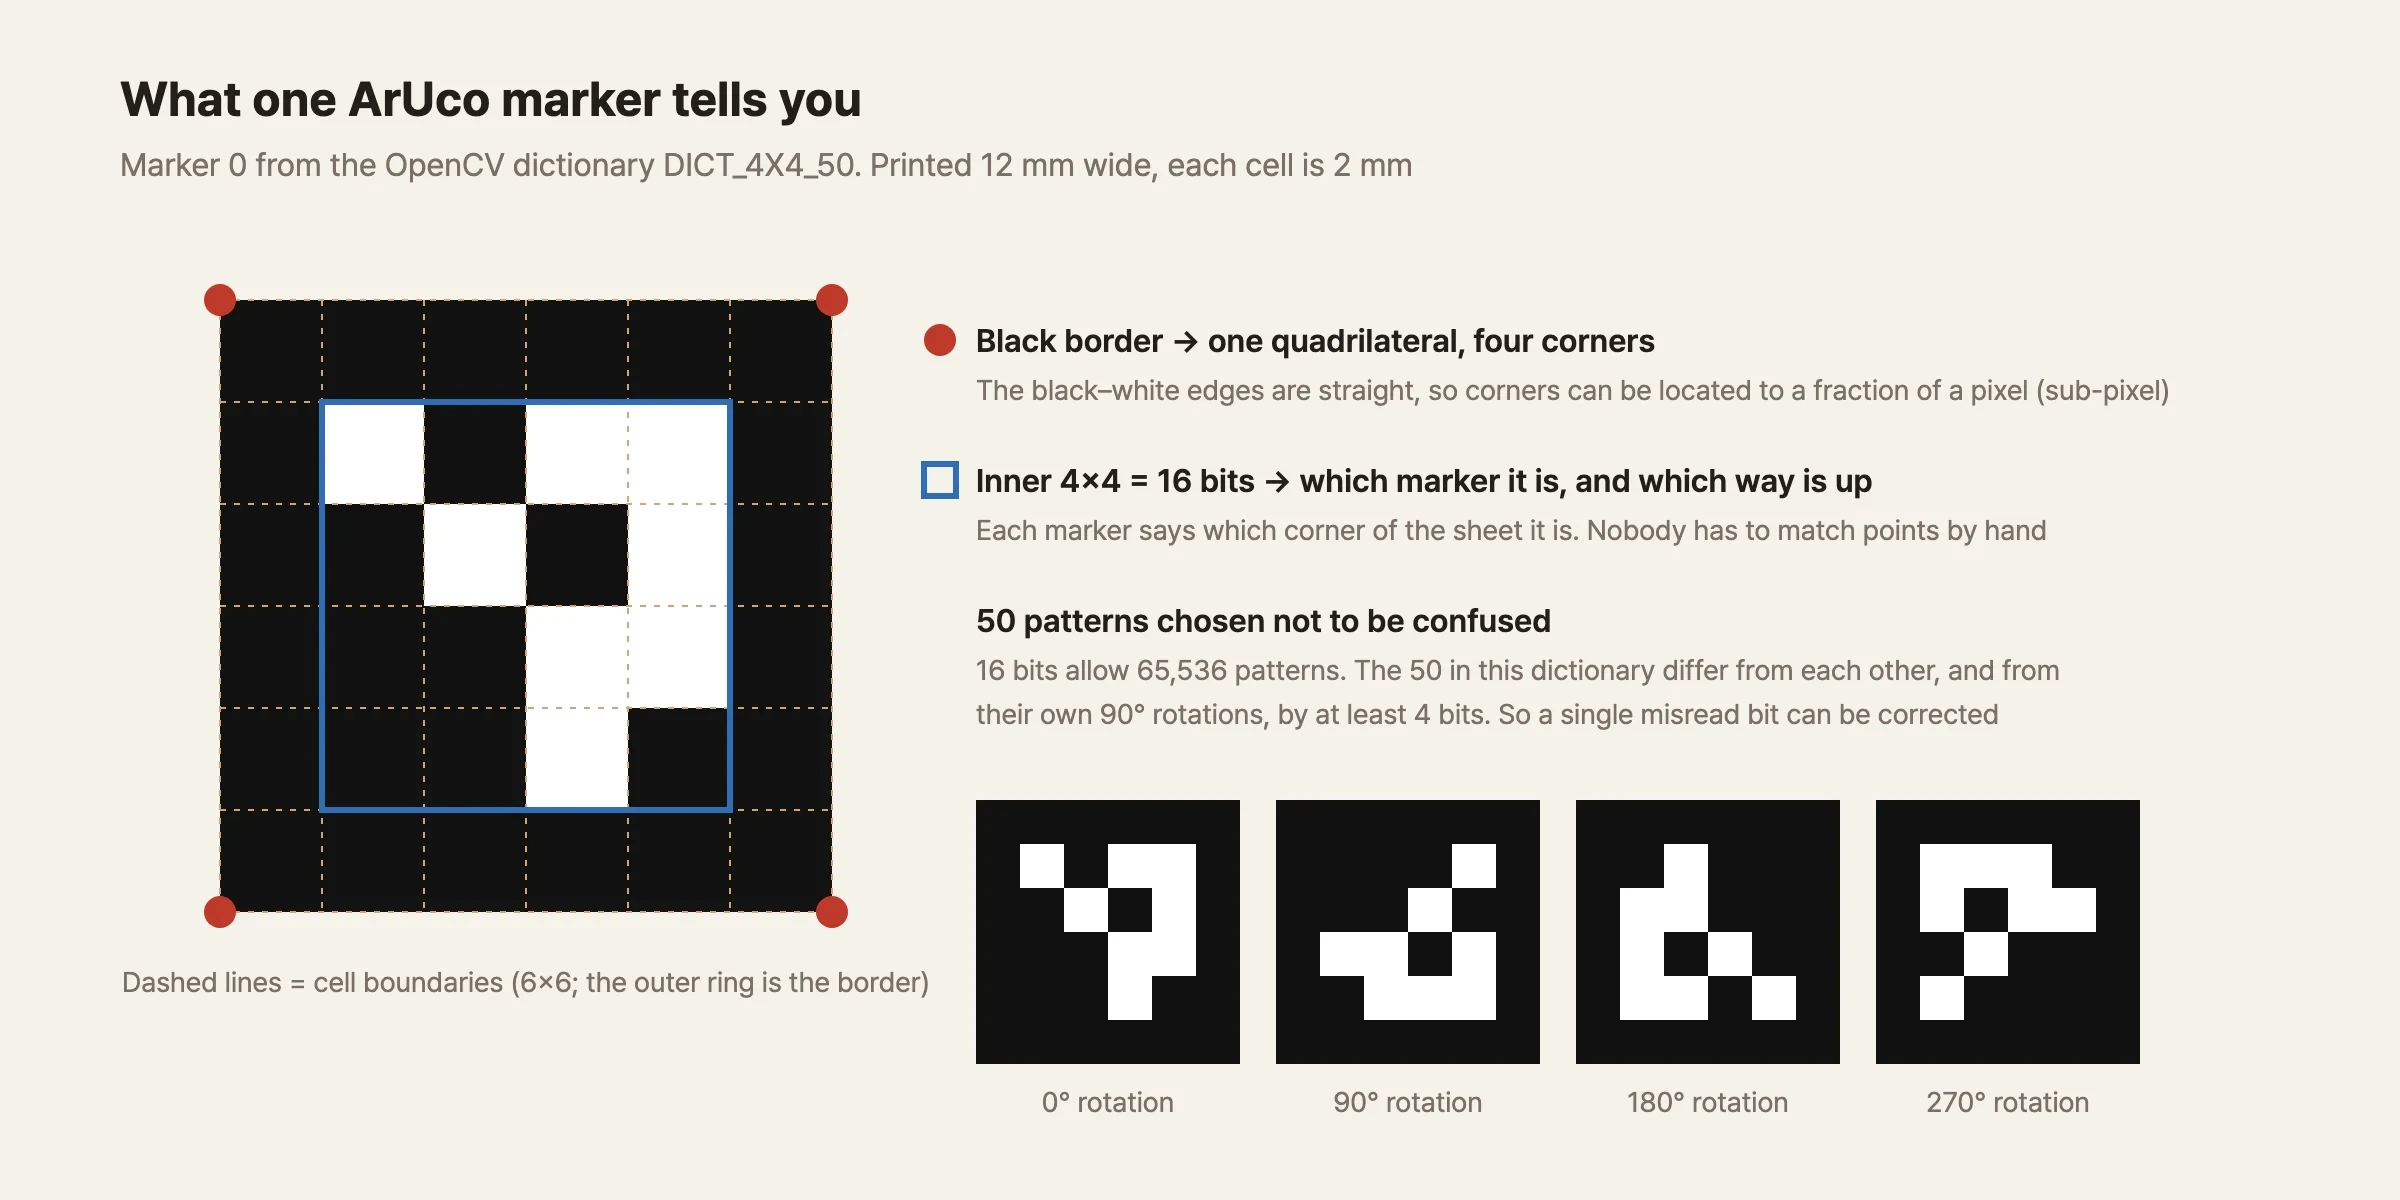
*Marker 0 from OpenCV's DICT_4X4_50 dictionary. The bit distances within the dictionary were counted directly from the dictionary built into OpenCV*
First: the position of the points. A marker's black border forms a sharp square against the white paper. The detection algorithm finds the square's outline in the photo, fits straight lines to its four sides, and takes their intersections as the corners. Because the lines are fit across a boundary spanning tens to hundreds of pixels, the intersection can be located more finely than a single pixel. This is called subpixel precision.
Second: who that point belongs to. The 4×4 cells inside the border encode a 16-bit number. This number tells you which marker it is and which way the marker is rotated. If you place markers with different ID numbers at the four corners of the paper, each square found in the photo is automatically assigned to the correct corner of the paper — no need for a human to match up the points.
16 bits could encode 65,536 different patterns, but the DICT_4X4_50 dictionary contains only 50, because only patterns that won't be confused with one another were selected. Counting them directly, I found that the markers in this dictionary differ from every other marker, and from their own 90°-rotated versions, by at least 4 bits. So even if one cell is misread, it can still be corrected to the nearest marker, and the odds of it being read as the wrong number or upside down are low. The original ArUco paper covers how to generate dictionaries like this at any desired size (Garrido-Jurado et al. 2014).
How Accurately Are the Corners Found?
To know how accurately a marker's corners are found, you need a photo whose true answer is known. Since you can't know the true corner values in a real photograph, I built the photo directly using the pinhole camera model from the last piece. I simulated photographing the marker sheet introduced at the end of this piece with a 4032×3024-pixel phone main camera from 15 cm above, and added a bit of blur (1 pixel) and noise to the photo. Then I used OpenCV's ArUco detector to find the corners and compared them against the true values.
With subpixel refinement turned off, the corner error was 0.7–0.9 pixels RMS. With refinement turned on, it dropped to 0.25 pixels (model estimate). At this distance, one side of a marker (12 mm) spans about 240 pixels in the photo.
If the corners are off by 0.25 pixels, how far off is the measurement? Using the same model, I deliberately injected noise into the corner positions and re-estimated the perspective transform 200 times. At a 5° tilt with a 0.3-pixel corner error, 95% of the 200 trials fell within 0.03% magnification error inside the measurement window — using all 16 points, four corners from each of the four markers. Using only the four outer corners, it was 0.05%. Even when the corner error grew to 2 pixels, it stayed at just 0.17% with 16 points and 0.31% with 4 points.
How far apart the markers are placed also matters. Widening the spacing between marker centers from 72 mm to 144 mm shrank the same-condition error from 0.057% to 0.037%. The more spread out the points are, the more reliably the tilt gets captured.
In other words, once a marker is properly captured, the precision of finding its corners is no longer the bottleneck. Real photos will likely be worse than the synthetic ones due to JPEG compression, phone sharpening, and glare off the paper surface. Still, even if the corner error grows several times over, it doesn't change the conclusion.
Flattening the Photo
Now let's flatten the whole photo. Inside the measurement window of the same synthetic photo, I laid out 96 discs with a precise diameter of 4.000 mm — test particles of known size, standing in for coffee grounds. The camera was tilted 5°, and the sheet was rotated 10°.
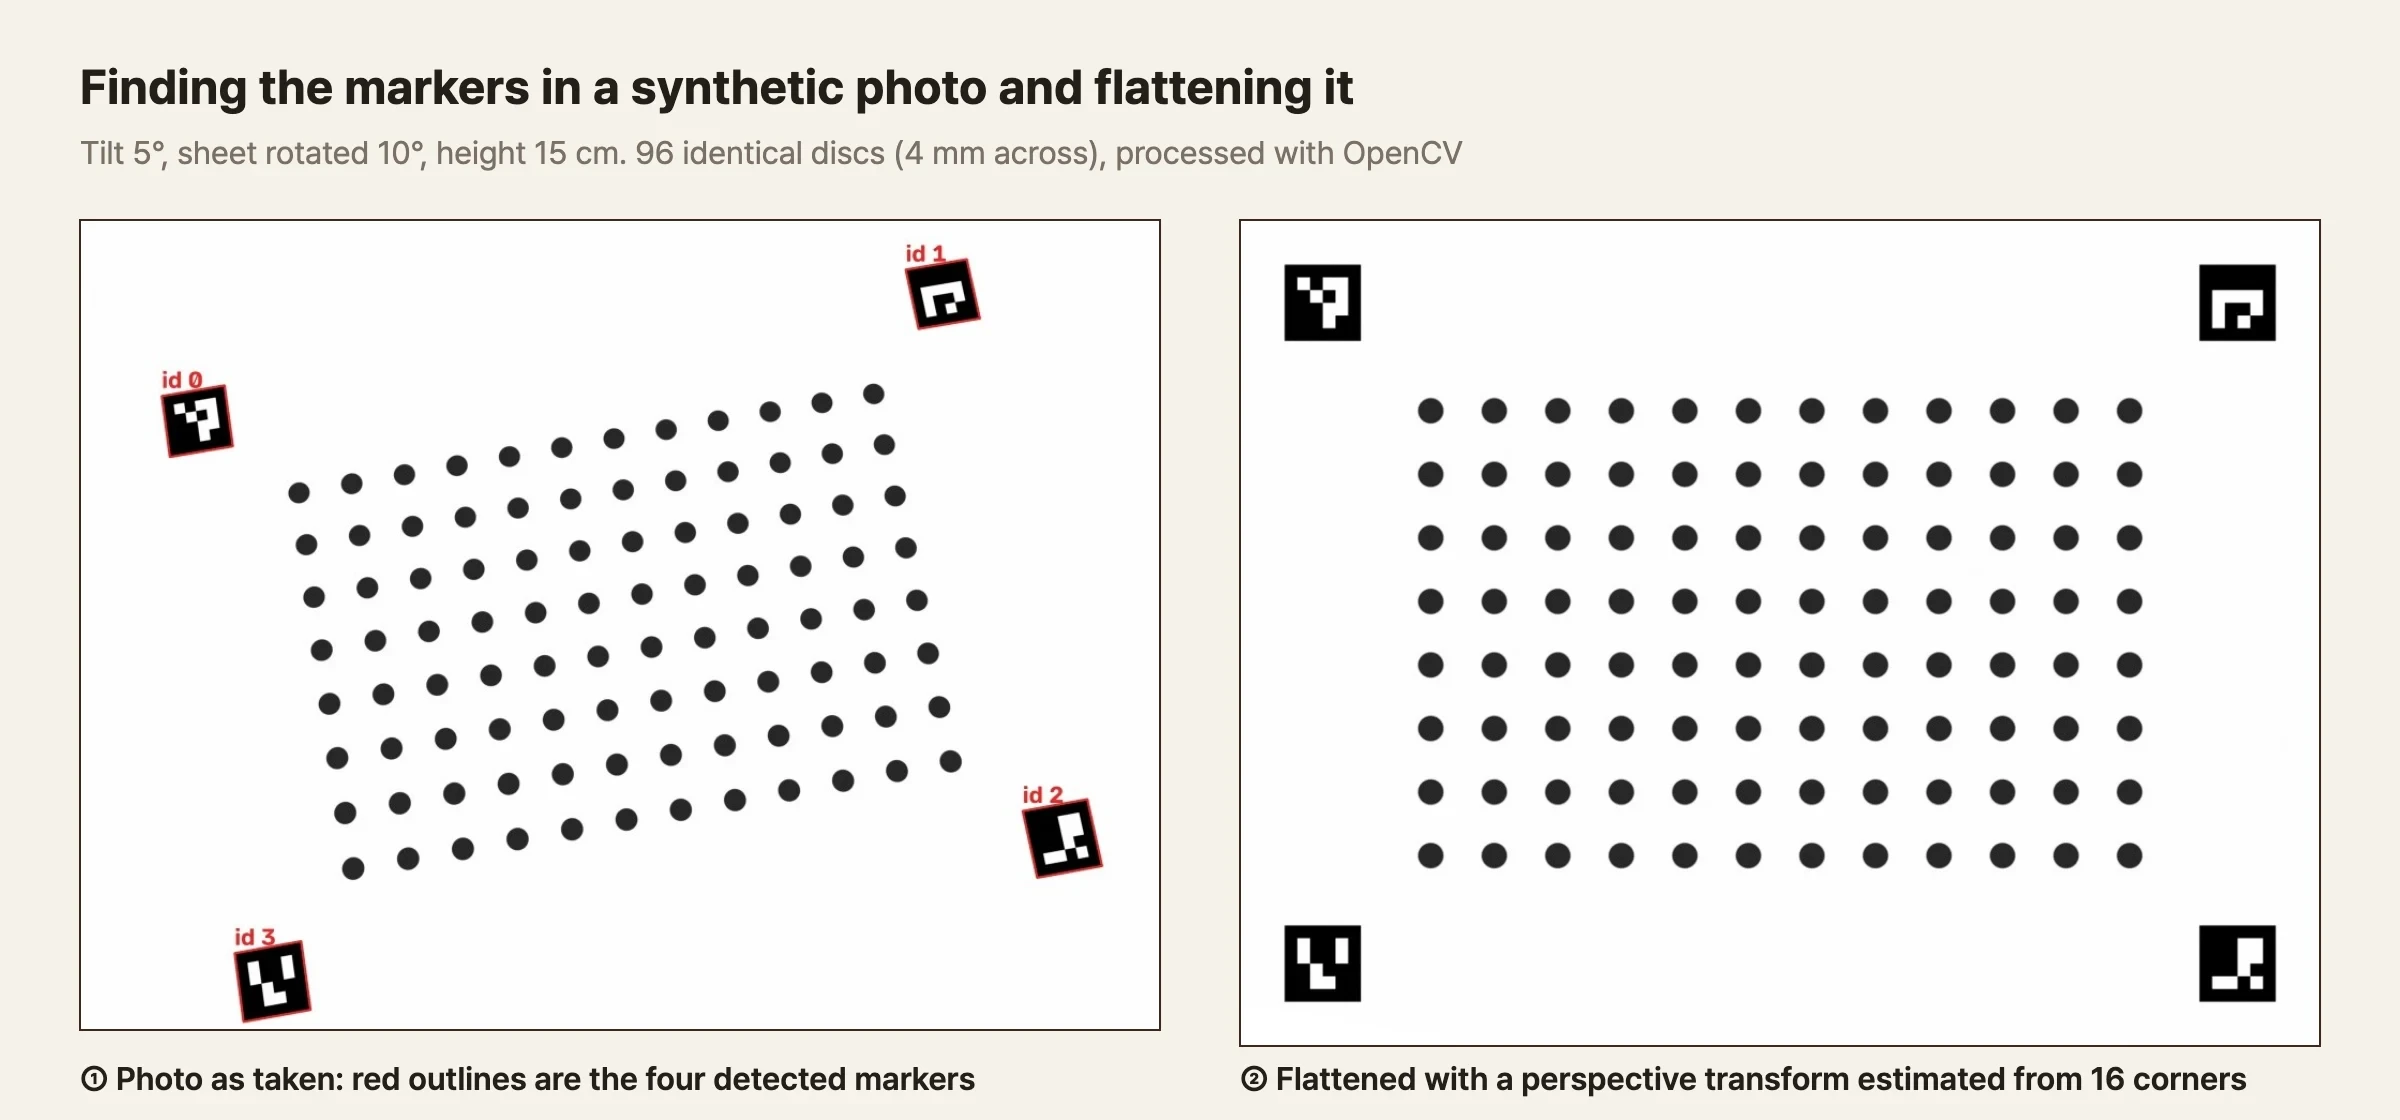
I measured the discs in the left photo using the method from the last piece — applying a single magnification value taken from the center of the photo to every disc. The right photo was measured after flattening it by estimating a perspective transform from the 16 corner points of the four markers.
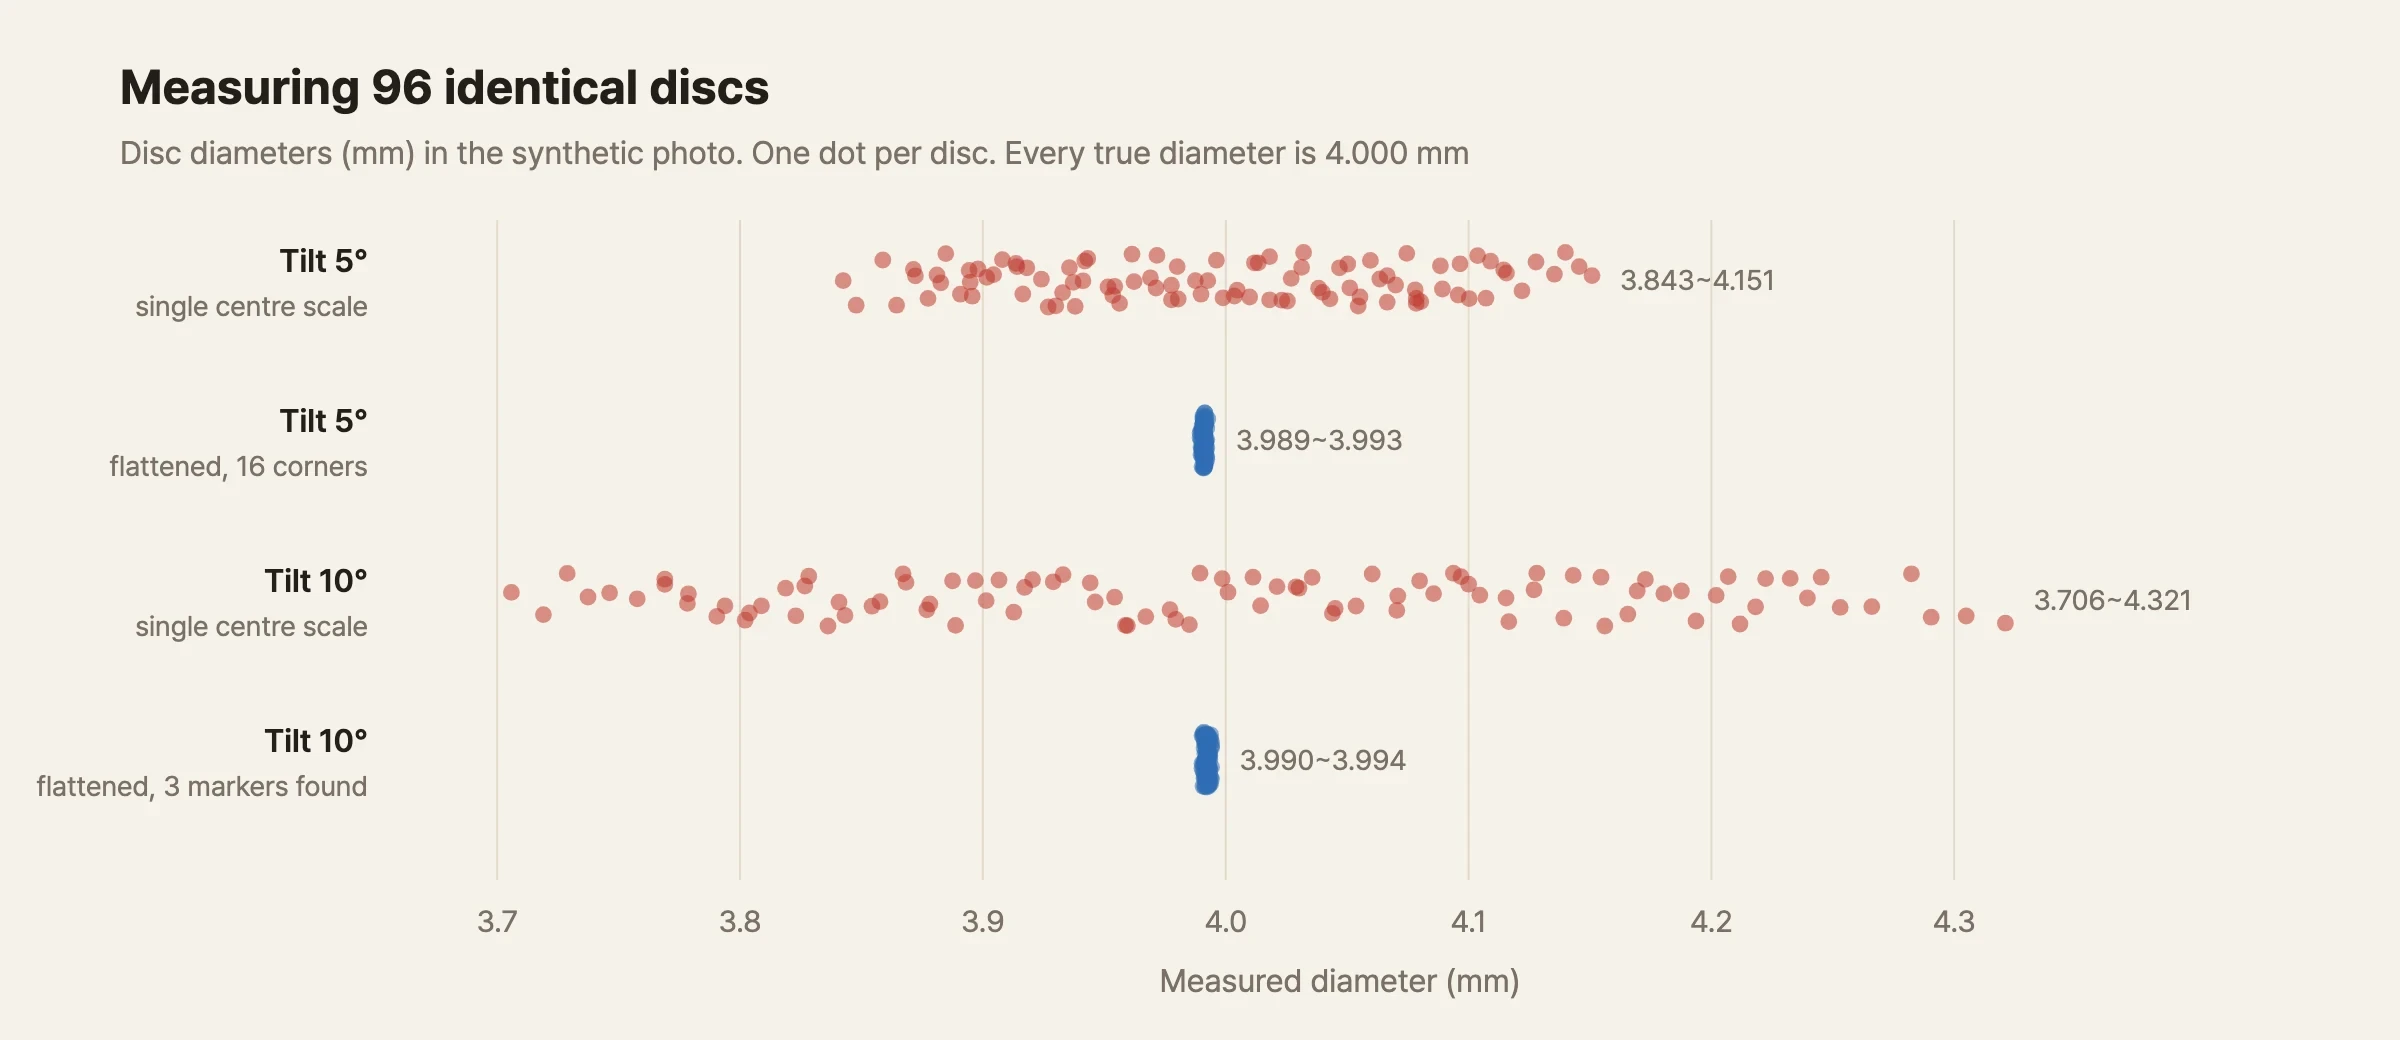
Synthetic photo test. Disc boundaries were found with OpenCV's Otsu threshold. All calculations are my own for this series
At 5° tilt, the disc diameters measured with a single magnification value spread from 3.843 to 4.151 mm — a gap of 7.7 percentage points between the smallest and largest measured disc. After flattening with the markers, the range was 3.989–3.993 mm, a gap of just 0.08 percentage points. At 10°, the difference is even larger: 15.4 percentage points with a single magnification, versus 0.10 percentage points after flattening.
In the 10° photo, the bottom-left marker's corner fell off the bottom edge of the frame and wasn't detected. The remaining three markers yielded 12 corners, which was enough. Since only four corner points are needed, measurement can continue even if one marker gets covered by grounds or falls outside the frame. Four markers, in other words, build in the slack to lose one.
One thing worth noting: the average of the flattened diameters was 3.991 mm, 0.2% smaller than the true value. Since all 96 discs came out equally small, this isn't a magnification problem. It comes from where you draw the line between particle and background at a blurry edge. A perspective transform doesn't fix this.
You can change the conditions yourself in the simulation below. On the left is the photo as captured by the camera, with disc colors showing the error from a single center magnification. On the right is the photo flattened using the marker corners, marked with red crosshairs. Try changing the tilt and corner detection error, and below that, the print scale, lens distortion, and marker lift. Click the image on the right to redraw the detection error.
What a Perspective Transform Can't Fix
Even once tilt error disappears, the measurement isn't finished. Homography is only accurate under the assumption that "flat paper was photographed with a pinhole camera." Error remains wherever this assumption breaks down. Here's each one calculated at a baseline of 15 cm height and 5° tilt (all model estimates).
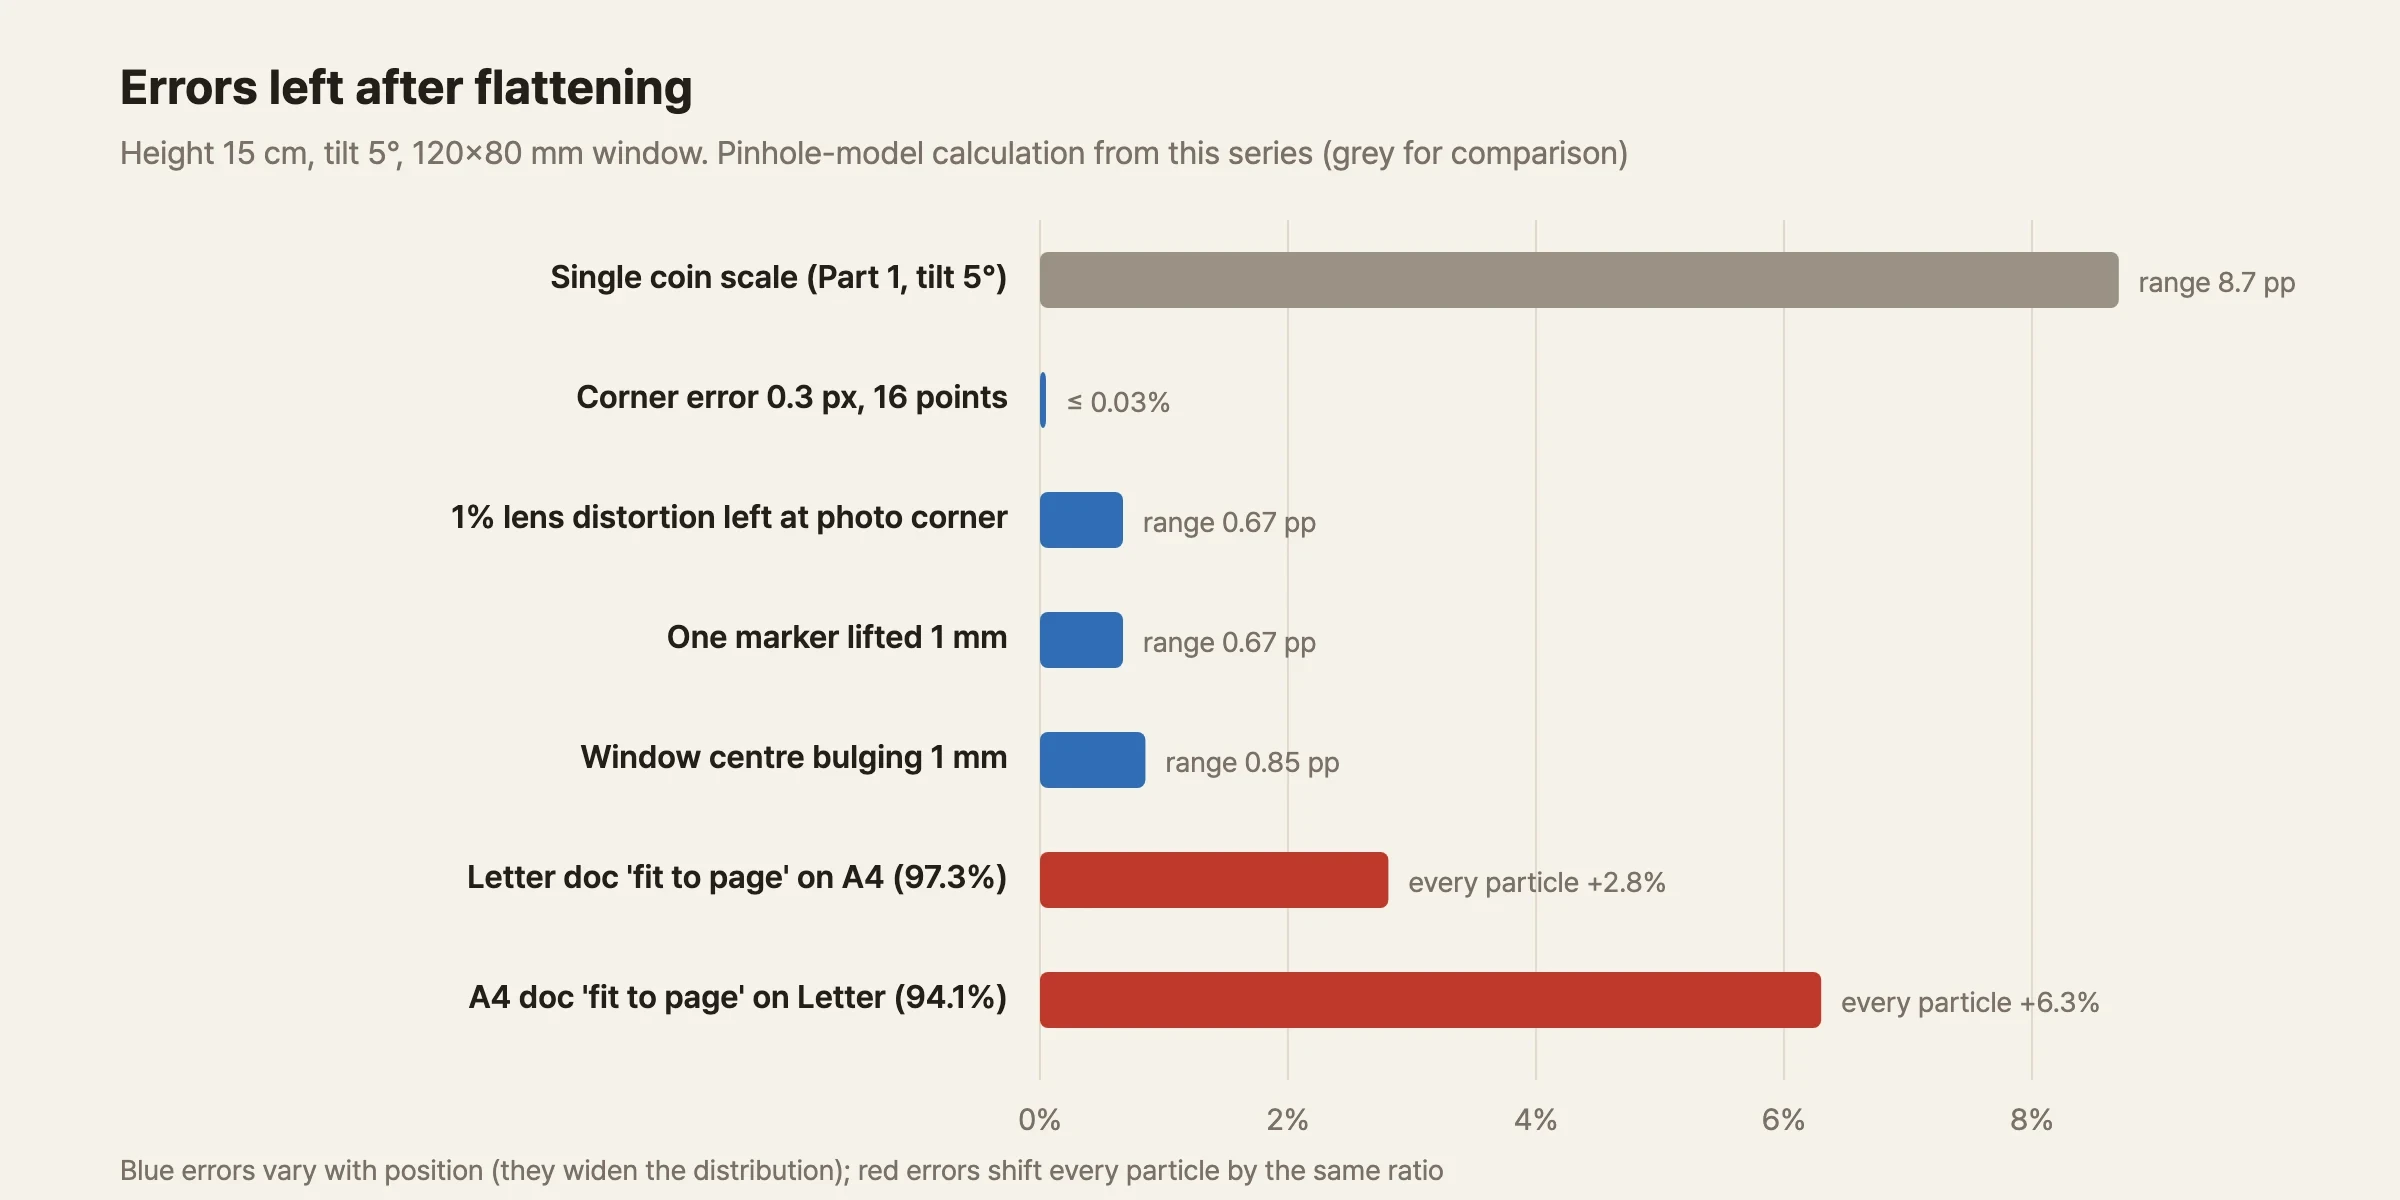
Lens distortion. Homography sends straight lines to straight lines. A lens's radial distortion bends straight lines, so a single planar transform can't erase it. Even after a phone's software correction, if 1% barrel distortion remains at the photo's edges, the error within the flattened measurement window ranges from −0.15% to +0.52% depending on position. Distortion grows faster the further you move from the center of the photo, so raising the camera a bit to fit the sheet smaller within the frame reduces it. Under the same conditions, raising the height to 20 cm shrinks the range from 0.67 to 0.38 percentage points — at the cost of each pixel covering a larger area.
When the paper isn't flat. Homography assumes every point on the paper lies on a single plane. If the paper's edge curls and one marker lifts 1 mm, that marker's corners get photographed as if they were closer to the camera than they actually are. The transform trusts these displaced points as if they were on the plane, twisting the whole measurement window. Calculations show the error ranges from −0.48% to +0.19% depending on position. If the center of the measurement window bulges up 1 mm, particles there get measured up to 0.69% larger. This is the same principle as the coin's thickness in the last piece: it grows by the height difference divided by the camera distance, 1 mm ÷ 150 mm = 0.67%.
Print scale. This is where the largest error comes from. Homography trusts that the markers were printed exactly where they were designed to be on the paper. But if the printer setting "fit to page" is turned on, the printer shrinks the whole thing slightly. For example, if a document made for A4 (210×297 mm) is fit onto US Letter paper (215.9×279.4 mm), the height has to shrink from 297 mm to 279.4 mm, so the whole thing scales down to 94.1%. Conversely, fitting a Letter document onto A4 shrinks it to 97.3%.
Shoot a photo of a sheet shrunk this way, and every particle in the measurement window gets measured 6.3% (or 2.8%) larger. The problem is that the photo alone gives you absolutely no way to know this. A sheet printed at 94.1% is still flat and a proper rectangle. The ratios between markers are unchanged. As far as the perspective transform is concerned, there's nothing wrong — it's just a slightly smaller piece of paper. Unlike tilt, there's no way to notice this from the information in the photo itself. The only way is to bring in an object from outside the photo whose size you already know, and check against it.
It's also possible that the printer stretches or shrinks the horizontal and vertical directions differently, since the mechanism that feeds the paper and the one that moves the ink head are different parts of the machine. This piece didn't confirm how large this difference actually is in practice. That's why the marker sheet below includes separate rulers to check the horizontal and vertical directions.
Marker Sheet v1
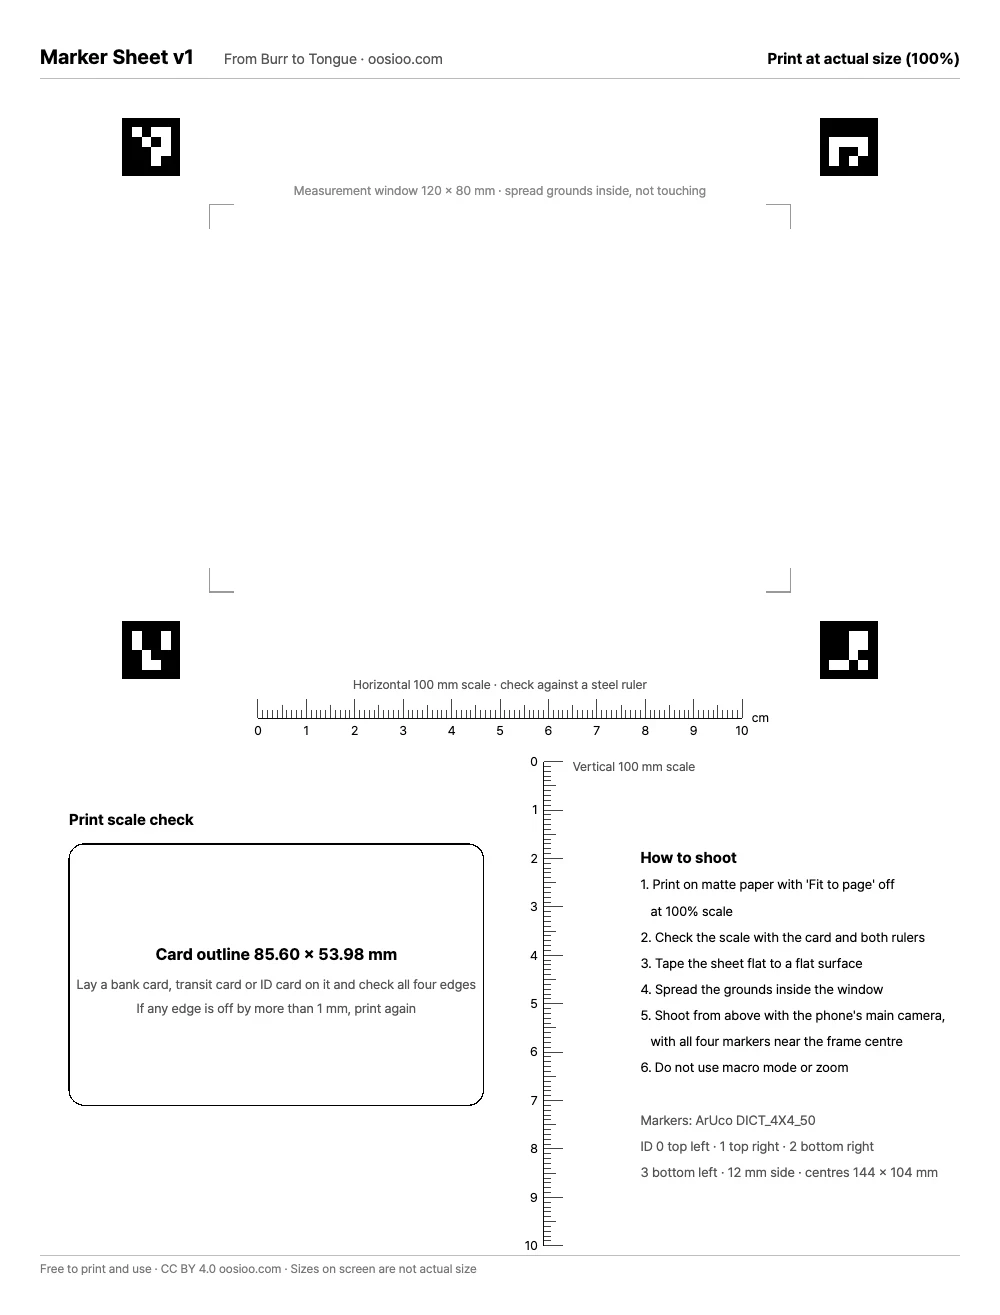
I put together everything worked out above into a single marker sheet. Rather than borrowing the column's 100 mm square layout as-is, I redesigned it based on the calculations above.
Open and print Marker Sheet v1
Here's what the design settles on:
- 12 mm markers, 4×4 dictionary. With a 6×6 grid, each cell is 2 mm. From 15 cm up, each cell is captured at roughly 40 pixels, giving plenty of margin to read. Dictionaries with finer grids (5×5, 6×6) can hold more ID numbers, but at the same print size the cells shrink and become harder to read. This sheet only needs four IDs
- Marker center spacing of 144×104 mm. Phone photos are 4:3, and from 15 cm up they capture roughly 200×150 mm. Spacing the markers out into a rectangle matching the photo's aspect ratio uses the frame to the fullest while still leaving margin outside the markers. The wider the spacing, the smaller the effect of corner error
- 120×80 mm measurement window, 6 mm from the markers. There needs to be white margin around each marker for the border to register clearly. If grounds touch a marker, detection can fail
- Card outline of 85.60×53.98 mm. Credit cards, transit cards, and ID cards all follow the international standard (ISO/IEC 7810 ID-1), so their size is fixed. It's an item nearly every household has, with a precisely known size. Lay the card on the printed sheet's outline and check whether all four sides line up with the edges to immediately verify the print scale. If printed at 94.1%, the card would overhang by 5.1 mm horizontally. A 1 mm mismatch corresponds to 1.2% horizontally and 1.9% vertically
- A 100 mm horizontal ruler and a 100 mm vertical ruler. Checking against a steel ruler gives more precision than the card. Checking the two directions separately accounts for the horizontal/vertical scale difference mentioned above
- Black and white, matte paper. Glossy paper can reflect light and blow out the marker cells to white
The print page was built to print directly from the browser. Saving it as a PDF from Chrome and re-measuring showed the marker center spacing on a single A4 sheet came out to 143.99×104.01 mm, matching the design values. That said, I haven't yet verified this by actually printing it on a real printer and photographing it with a phone. Results may vary by printer, so after printing, I'd strongly recommend checking with a card first.
Summary
- Paper photographed by a tilted camera undergoes a plane-to-plane perspective transform (homography). Since this transform has 8 unknowns, four points of known position are enough to determine it
- ArUco markers give you both the position of each corner and which corner it is. In the synthetic photos, turning on subpixel refinement brought the corner error down to about 0.25 pixels
- Flattening the photo using 16 corner points shrank the disc size range from 7.7 percentage points to 0.08 at 5° tilt, and from 15.4 to 0.10 at 10° tilt. The result held up almost unchanged even with one marker missing
- A perspective transform can't fix lens distortion, paper lift, or print scale. The first two stay under 1%, but "fit to page" printing inflates every particle by 3–6%, and there's no way to notice it from the photo alone
- That's why Marker Sheet v1 includes a card outline and rulers in both directions. After printing, just check with a card first
Switching from a coin to markers changed the nature of the problem. In the last piece, the error depended on how you held the camera. Now, most of what's left depends on the paper — what got printed, and how flatly it was mounted, are what govern the measurement.
References
- Unspecialty (2023). "Developing a Grind-Size Guide." Link — original text verified
- Hartley R, Zisserman A (2004). Multiple View Geometry in Computer Vision, 2nd ed. Cambridge University Press. doi:10.1017/CBO9780511811685 — standard textbook on homography and DLT
- Hartley RI (1997). In defense of the eight-point algorithm. IEEE Transactions on Pattern Analysis and Machine Intelligence 19(6), 580–593. doi:10.1109/34.601246 — coordinate normalization, bibliographic reference verified
- Kato H, Billinghurst M (1999). Marker tracking and HMD calibration for a video-based augmented reality conferencing system. IWAR '99, 85–94. doi:10.1109/IWAR.1999.803809 — ARToolKit, bibliographic reference verified
- Olson E (2011). AprilTag: A robust and flexible visual fiducial system. ICRA 2011, 3400–3407. doi:10.1109/ICRA.2011.5979561 — bibliographic reference verified
- Garrido-Jurado S, Muñoz-Salinas R, Madrid-Cuevas FJ, Marín-Jiménez MJ (2014). Automatic generation and detection of highly reliable fiducial markers under occlusion. Pattern Recognition 47(6), 2280–2292. doi:10.1016/j.patcog.2014.01.005 — original ArUco paper, bibliographic reference verified
- OpenCV. Detection of ArUco Markers. Link — detector and dictionary (DICT_4X4_50). Tests in this piece were done with OpenCV 5.0
- ISO/IEC 7810:2019. Identification cards — Physical characteristics — ID-1 card, 85.60×53.98 mm
- Brown DC (1966). Decentering distortion of lenses. Photogrammetric Engineering 32(3), 444–462 — radial distortion model, bibliographic reference verified
Image Credits
- The Ideal City: Unknown artist (estimated 1480s), Galleria Nazionale delle Marche, Wikimedia Commons, public domain
- Fiducial marker comparison: Cmglee, Wikimedia Commons, CC BY-SA 4.0 (SVG converted to PNG)
- All other figures, synthetic photos, simulations, and marker sheets: created by the author

