Looking Inside the Puck with CT
When CT images a puck, much of the conclusion is decided when each voxel is classified as coffee or space. Mo et al.'s (2023) 16.8 µm images had a single-peaked histogram, so porosity was set to the literature value of 0.17. Scanning a virtual puck of known porosity 0.31 at 16 µm and segmenting with Otsu's method gave 0.49, only 13% of the fines were detected, and the permeability from that image was 66 times the truth. Includes a virtual CT slice tool.
To see where water flows inside an espresso puck, you have to look inside without breaking it. So researchers use X-ray computed tomography, or CT. It works like a hospital CT scan: a small sample is rotated while thousands of X-ray images are taken, and these are rebuilt into a 3D image. Then each point of the image (a voxel) is classified as coffee or empty space. This classification is called segmentation.
It is the same problem as the old computer-vision task of picking out objects in a photo. Reading the coffee CT papers, much of the conclusion is decided at this segmentation step. I built a virtual puck whose true structure I know, "scanned" it and segmented it myself. Scanned at 16 µm voxels, similar to the study described below, a puck with porosity 0.31 read as 0.49, and only 13% of the fines were detected.
Studies that scanned coffee with CT
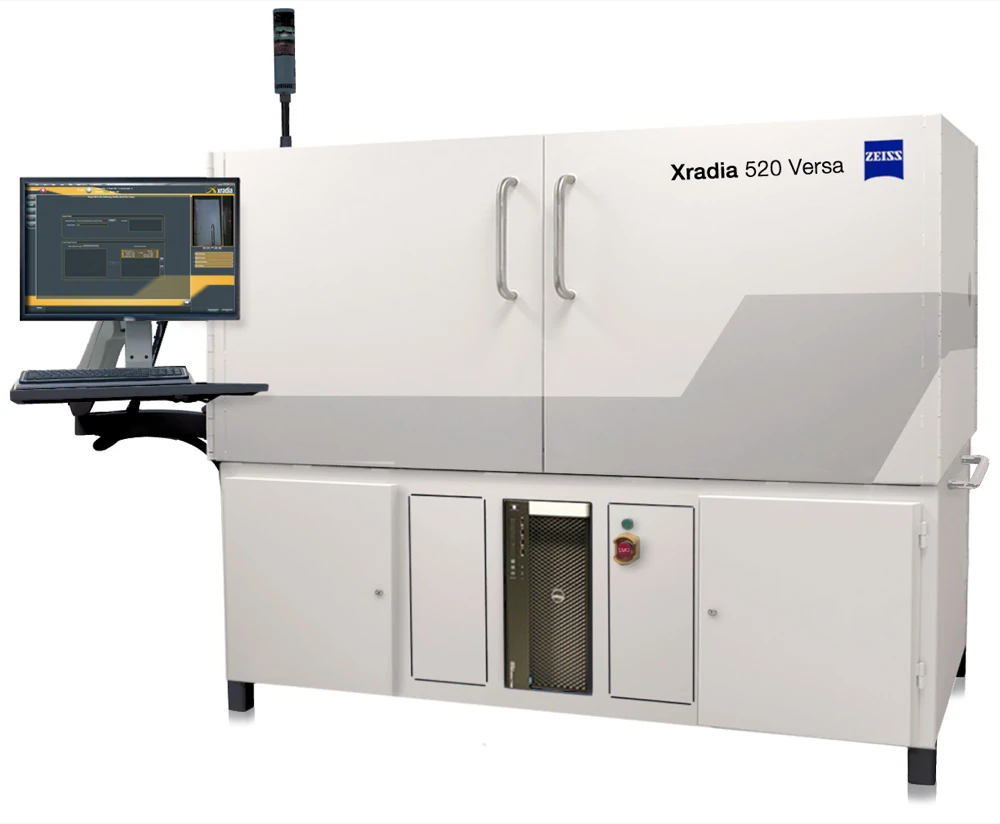
A laboratory X-ray microscope (micro-CT). Mo and colleagues (2023), described below, used this model · Photo: ZEISS Microscopy, Wikimedia Commons, CC BY-SA 2.0
Mo and colleagues (2023) scanned whole illy capsules (6.7 g of coffee) with micro-CT at voxels 16.8 µm on a side. They scanned four grinds, and scanned again right after brewing and three days later. Wadsworth and colleagues (2026) poured grounds untamped into a 5 mm drinking straw and scanned them at 2.7–3.0 µm voxels, across eleven grind settings and two coffees.
The two studies, at different resolutions, give very different numbers. Mo's tamped capsules had a porosity of 0.17, while Wadsworth's untamped grounds had a total porosity of 0.48–0.69. With different degrees of packing, the two cannot be compared directly. But Mo's 0.17 was not a measurement.
A histogram with one peak
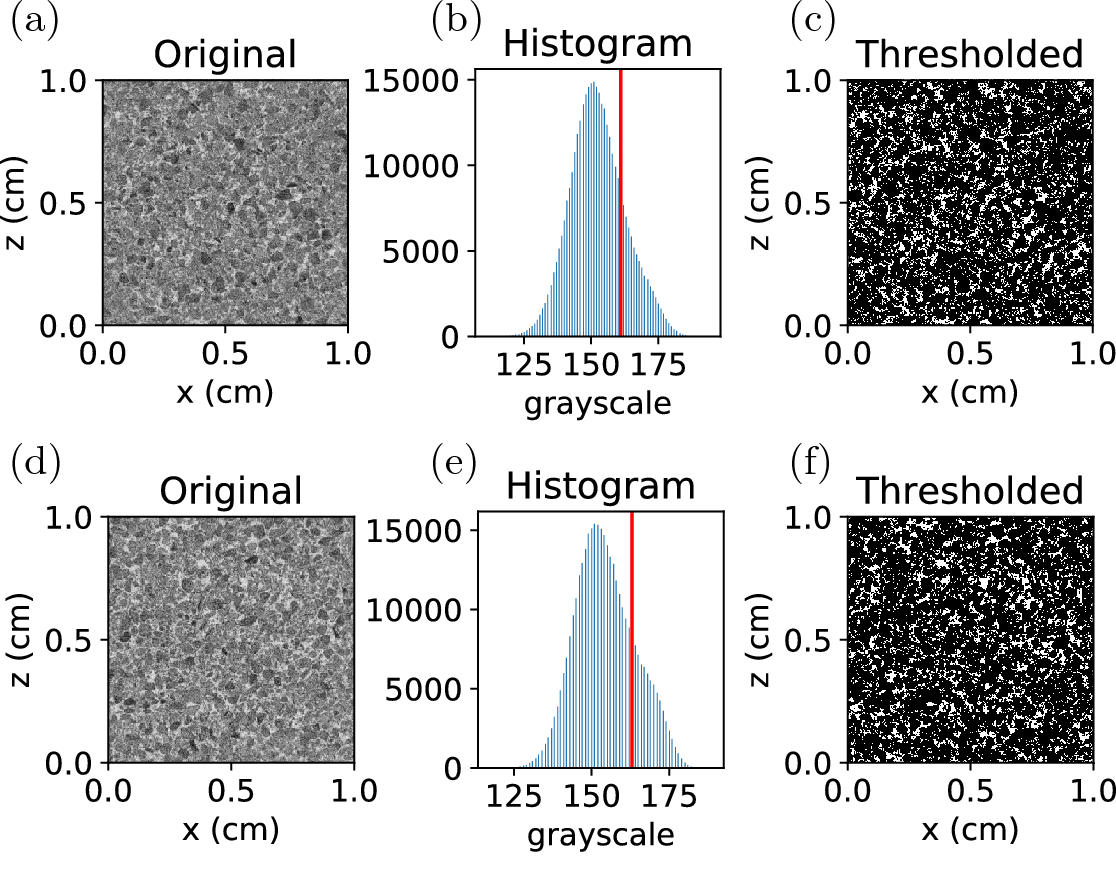
CT slices, brightness histograms with thresholds (red line) and segmented results from Mo and colleagues (2023), for two of their four grinds. Brightness is inverted so that pores appear light · Figure: Mo et al. (2023), Scientific Reports, CC BY 4.0
The brightness of a CT image reflects how strongly each spot absorbs X-rays. Coffee is bright and empty space is dark. If the two separate cleanly, the brightness histogram has two peaks, and you can draw a line in the valley between them. The standard way to find that valley automatically is Otsu's method (1979), which picks the threshold that maximises the variance between the two groups.
Mo's dry capsules did not behave that way. The paper says the histogram was "unimodal and of Gaussian shape", so conventional segmentation techniques fail. They therefore set a single threshold so that the dry puck's porosity matched the literature value of 0.17. They then grouped connected pores: the one large connected cluster was taken as the space between particles and the small isolated ones as closed pores, and porosity was counted in a 1 cm³ cube (600³ voxels). After brewing, wet coffee and empty space separated and the histogram had two peaks, so they drew the line midway between them.
Why only one peak? As Mo and colleagues noted, the resolution is the same size as the smallest fines. Their fines peak, measured by laser diffraction, was at 25–50 µm, or 1.5–3 voxels at 16.8 µm. When fines and the gaps between them share a voxel, that voxel takes an intermediate brightness. This is the partial volume effect. The puck is imaged not as two things, coffee and space, but as every shade of grey in between.
Scanning a puck whose answer is known
To check this, I built a virtual puck. I drew 160,000 spheres from Grind Simulator v1's espresso distribution (flat burr, 250 µm gap) and packed them, with a little overlap allowed, into a cube 2 mm on a side. It was painted on a 4 µm grid and has a porosity of 0.311. Taking this as the truth, I "scanned" it virtually at voxel sizes from 4 to 28 µm: averaging within each voxel (partial volume), blurring slightly and adding noise. Then, as is common in real analyses, I reduced the noise with a median filter and segmented with Otsu's threshold.
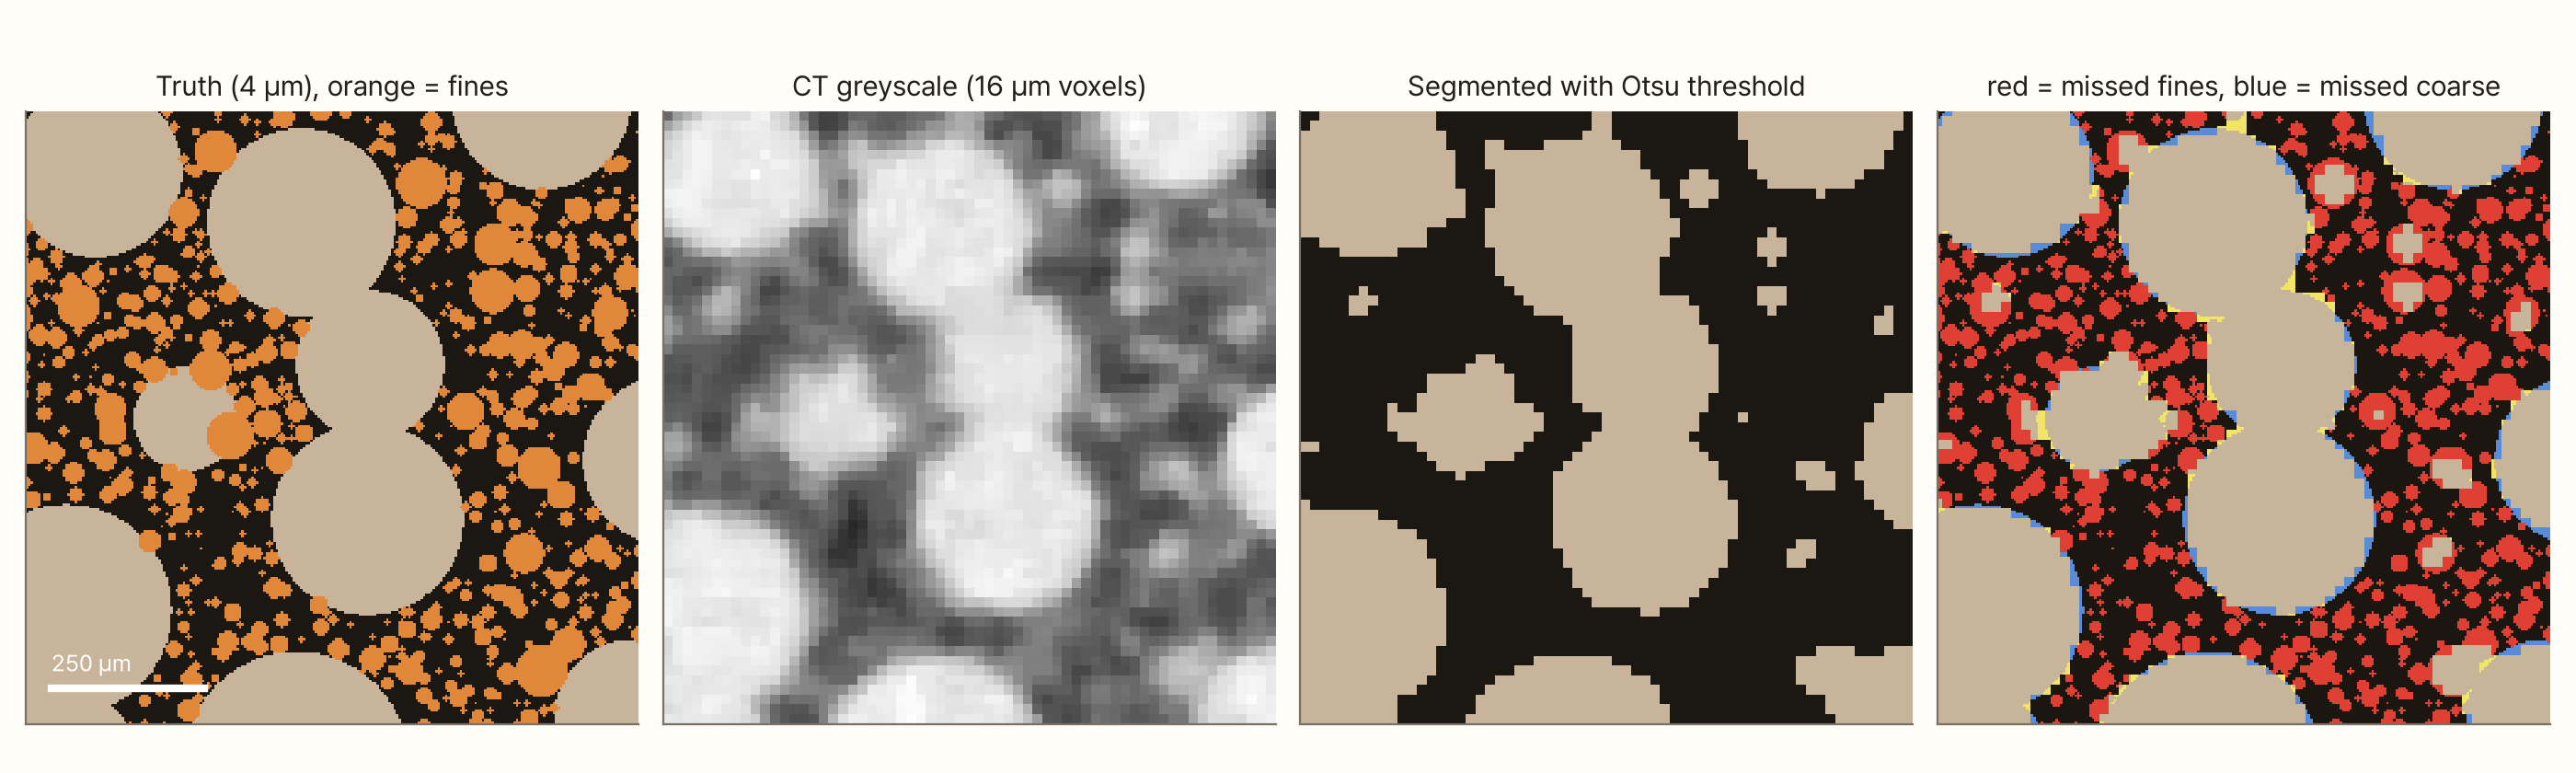
In the 16 µm image the coarse particles are sharp. Where the fines were, there are grey smudges, and thresholding turns most of them into pore space. Missed solid gets counted as space, so the porosity swells.
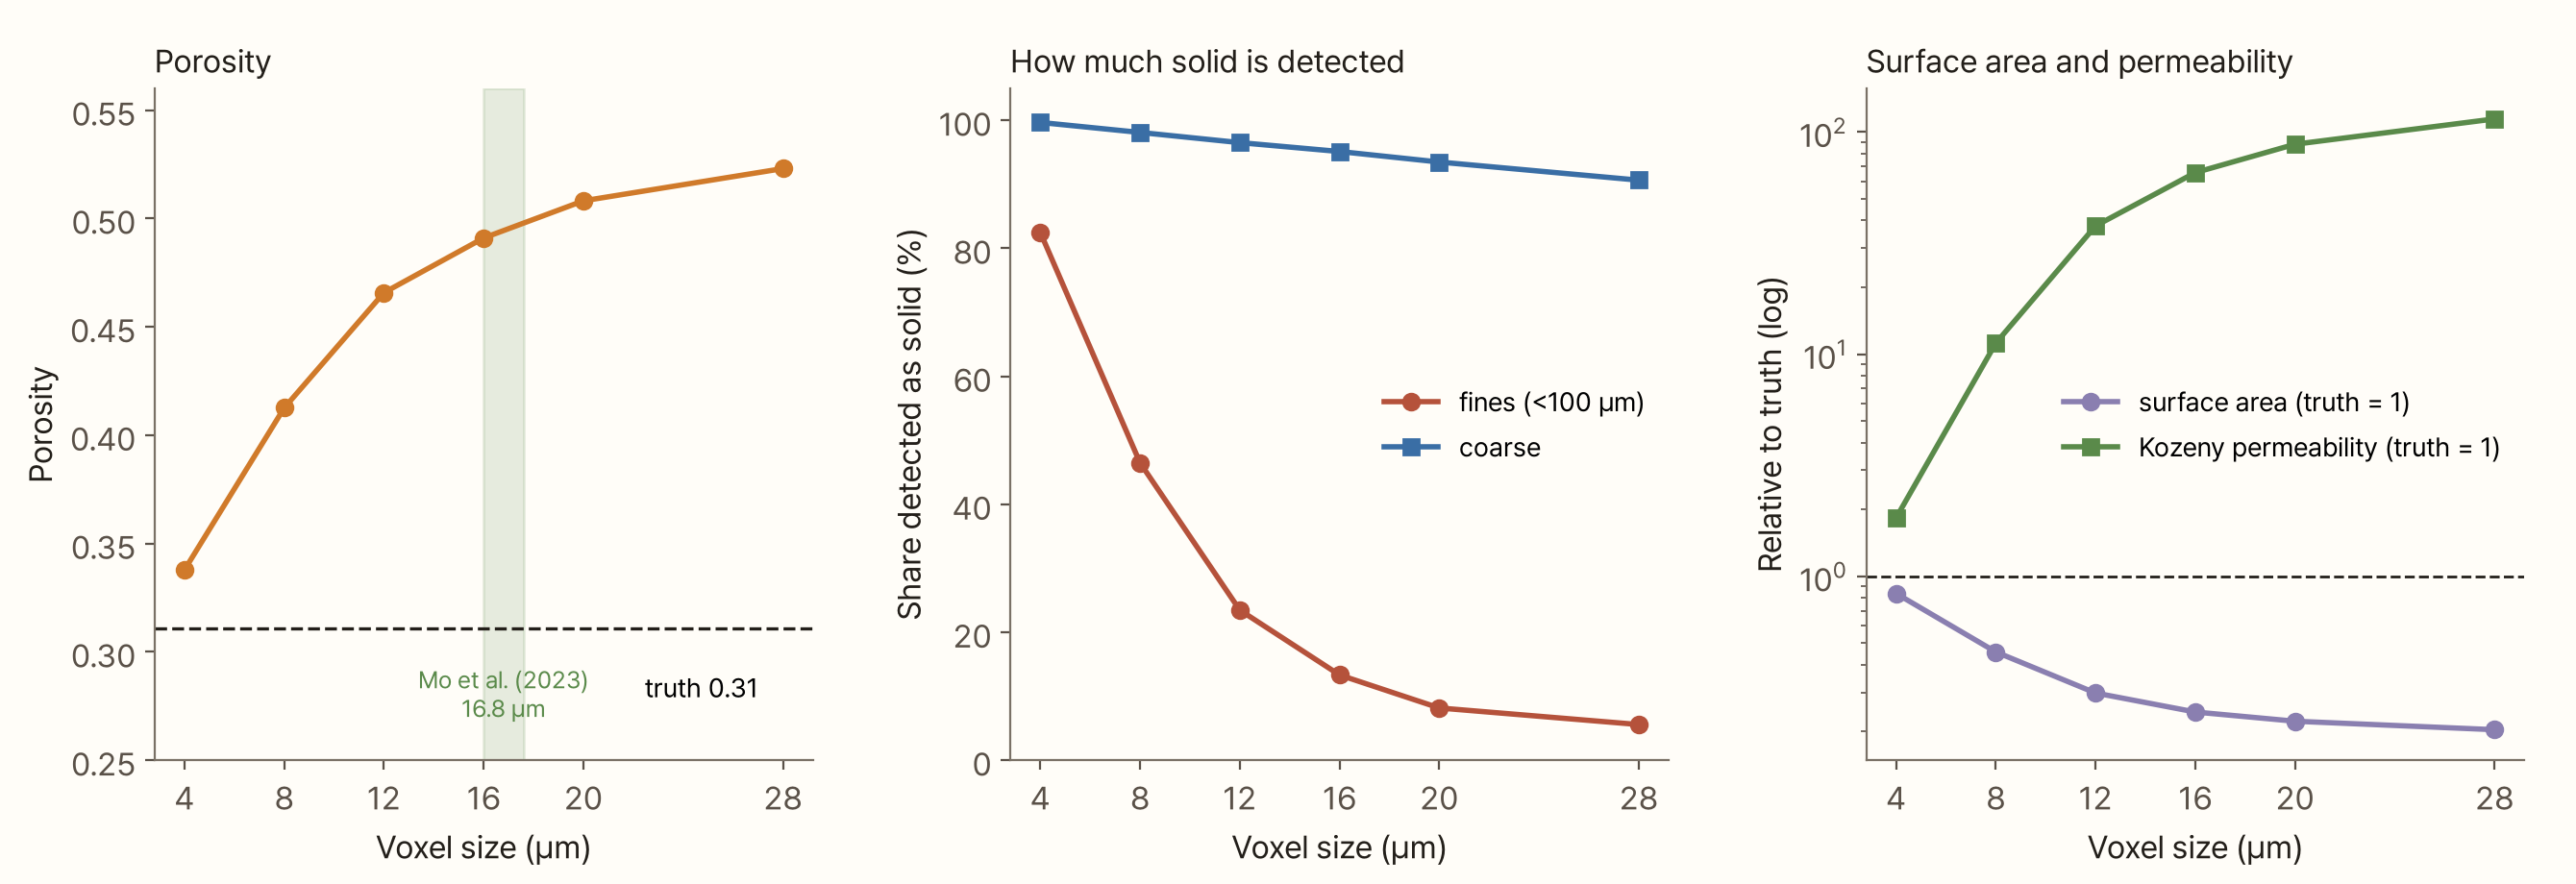
As voxels grow, the fines vanish fast. The share of fines detected as solid was 82% at 4 µm, 46% at 8 µm and 13% at 16 µm. Coarse particles were still 91% detected at 28 µm. Porosity rose from 0.34 to 0.41 to 0.49. Even at 4 µm, the truth's own resolution, it reads 0.34, because blur and noise wipe out a few of the smallest fines.
Calculating water flow from these numbers makes the error bigger. Permeability is sensitive to surface area and to empty space. When fines disappear, surface area drops and empty space grows. The surface area from the 16 µm image was a quarter of the truth, and the Kozeny permeability from its porosity and surface area was 66 times the truth. The same puck becomes one that drains 66 times more easily, just from the voxel size.
Numbers hanging on one threshold
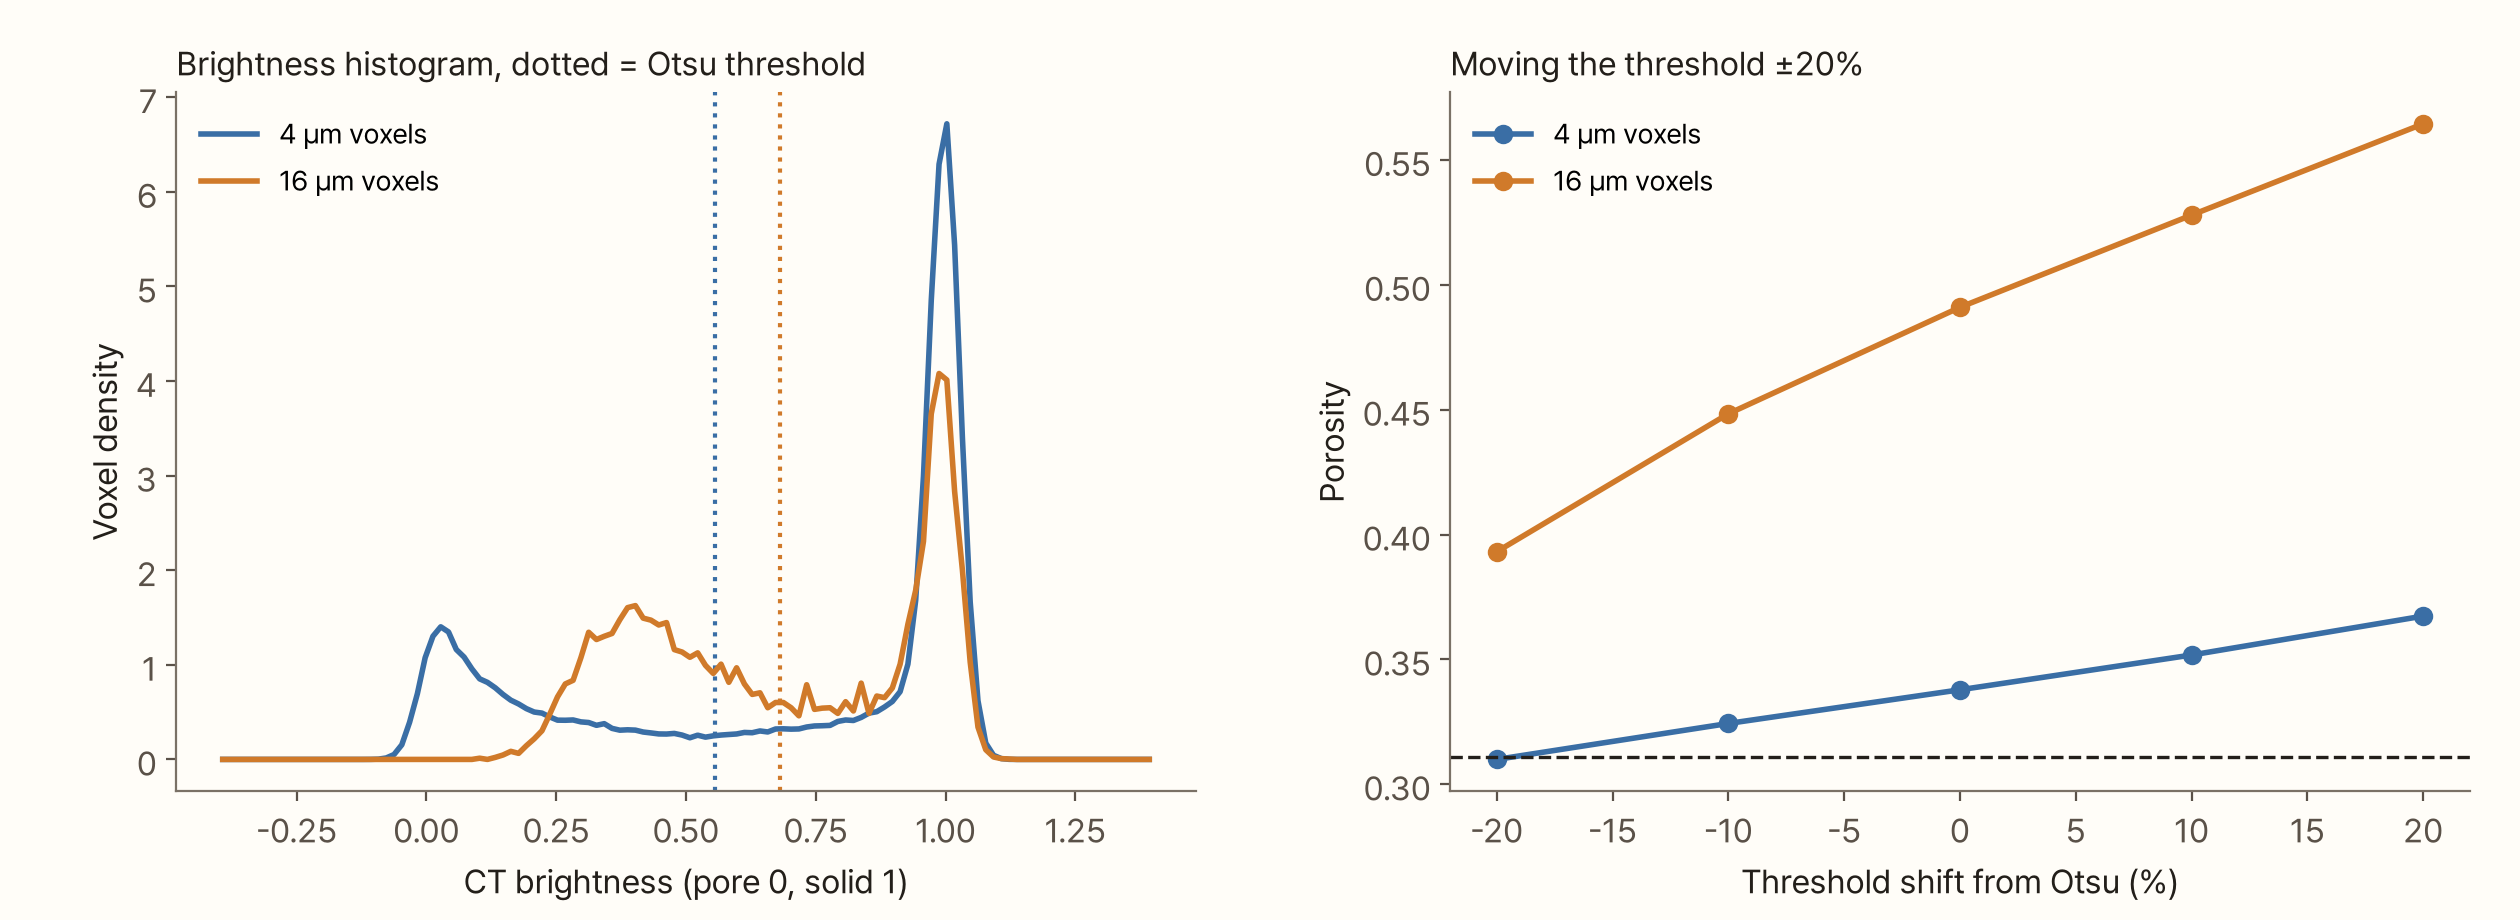
The brightness histogram shows why. At 4 µm there is one peak for pores (0) and one for solid (1). At 16 µm the pore peak turns into a broad hump at 0.3–0.5: pore space mixed with fines. Otsu's method treats this hump as "the pore group" and draws its line above it. So the threshold rises from 0.56 to 0.68, and every voxel mixed with fines becomes pore space.
Setting the threshold by hand moves the numbers even more. In the 16 µm image, moving the threshold ±20% from Otsu's value moves the porosity from 0.39 to 0.56, never reaching the true 0.31. An image at this resolution no longer contains the information needed to recover the answer. That is why Mo's choice to match the threshold to a literature porosity was sensible. But it makes the porosity an input rather than a measurement.
What CT does show
Even if a single porosity is hard to get right, CT shows how porosity varies inside a puck, and that can be seen without knowing the true value.
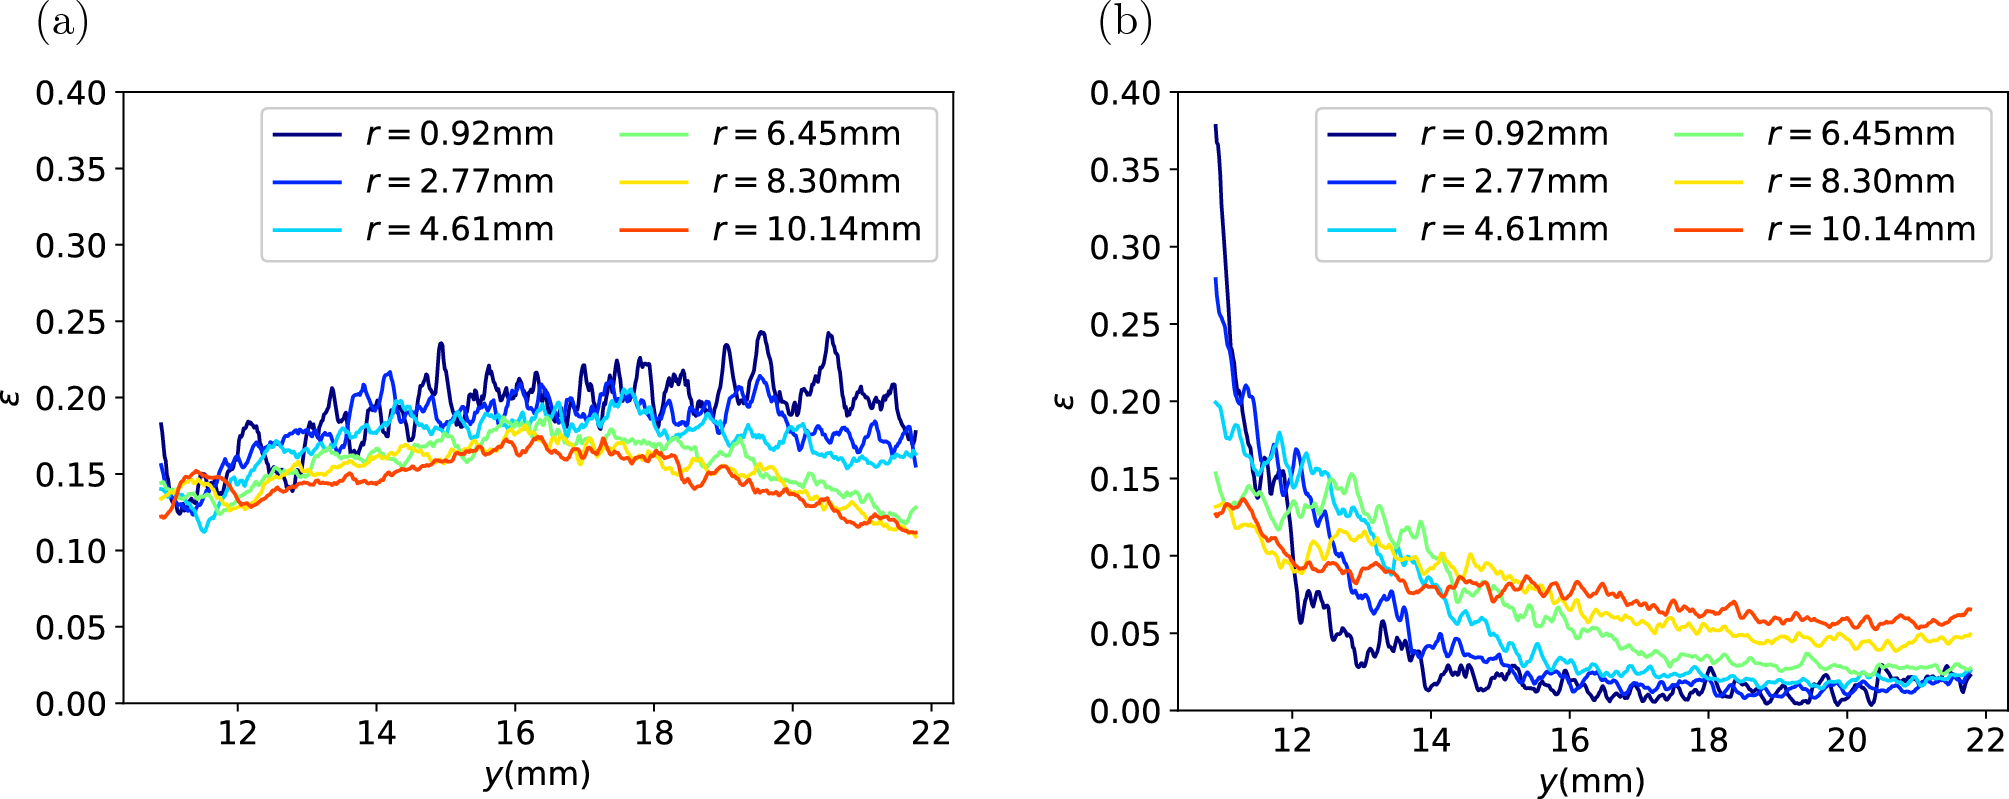
Porosity by height measured by Mo and colleagues (2023). (a) before brewing, (b) right after brewing. Colours are radial positions r · Figure: Mo et al. (2023), Scientific Reports, CC BY 4.0
Mo and colleagues found no trend with height in the capsules before brewing. Right after brewing, the bottom where water leaves had more empty space, and the top where water enters looked almost solid, the opposite of what many would expect. They noted that after brewing CT does not distinguish water from coffee well, so the absolute porosity is underestimated. Still, the difference between top and bottom was clear. Within one image segmented with one threshold, comparisons between numbers are meaningful.
Scan and segment it yourself
The tool below shows one slice of the virtual puck. Change the voxel size, noise and threshold, and it shows the virtual CT image, the segmented result and its errors against the truth. You can compare Otsu's automatic threshold with one you set yourself, and switch the median filter on and off. The table values are counted on this one slice, so they differ a little from the 3D results above.
What this conclusion leaves out
- The virtual puck is made of spheres. Real coffee particles are elongated and angular, and contain many cell-sized holes. If those inner holes were visible too, segmentation would be harder
- The imaging model is simple. It includes only voxel averaging, blur and noise. Ring artefacts, beam hardening and reconstruction methods of real CT are not included, and the blur and noise levels are assumptions
- Only Otsu's method was tested. More elaborate methods such as region growing, watershed or machine-learning segmentation can recover some of the partial volume, but they cannot recover the shape of fines smaller than a voxel
- The virtual puck has more fines than the grind simulator. Leaving out large particles that do not fit in a 2 mm box raised the fines share of the solid to 28% (17.5% in the distribution), which may make the loss of fines look a little larger
- Wadsworth and colleagues (2026) do not describe their segmentation in detail
Summary
- CT images a puck in 3D without breaking it, but much of the conclusion is decided when each voxel is classified as coffee or space
- Mo and colleagues' (2023) images of dry capsules (16.8 µm voxels) had a single-peaked brightness histogram, so the threshold was set to match the literature porosity of 0.17. That porosity is an input, not a measurement
- A virtual puck of known porosity 0.31, scanned at 16 µm and segmented with Otsu's method, read as 0.49. Only 13% of the fines were detected as solid, and the permeability from that image was 66 times the truth
- At that resolution, moving the threshold ±20% (porosity 0.39–0.56) never reaches the true value, because the information about the fines is no longer in the image
- Comparisons within one image are still useful. Mo and colleagues showed that after brewing, porosity near the outlet is higher than near the inlet
References
- Mo C, Johnston R, Navarini L, Liverani F, Ellero M (2023). Exploring the link between coffee matrix microstructure and flow properties using combined X-ray microtomography and smoothed particle hydrodynamics simulations. Scientific Reports 13, 16374. doi:10.1038/s41598-023-42380-y
- Wadsworth FB, Vasseur J, Zhang J, Dobson KJ, Gagné J, Buckland HM, Coumans JP, Heap MJ, Theurel A, Kendrick JE, Lavallée Y, Hendon CH (2026). A model for the permeability of coffee pucks validated using X-ray computed micro-tomography. Royal Society Open Science 13, 252031. doi:10.1098/rsos.252031
- Otsu N (1979). A threshold selection method from gray-level histograms. IEEE Transactions on Systems, Man, and Cybernetics 9(1), 62–66. doi:10.1109/TSMC.1979.4310076 — bibliographic details only
Image credits
- X-ray microscope: ZEISS Microscopy, Wikimedia Commons.jpg), CC BY-SA 2.0
- CT slices and segmentation (top two rows of Figure 5) and porosity by height (Figure 16): Mo et al. (2023), Scientific Reports, CC BY 4.0
- All other charts, the cover and the tool: made by me