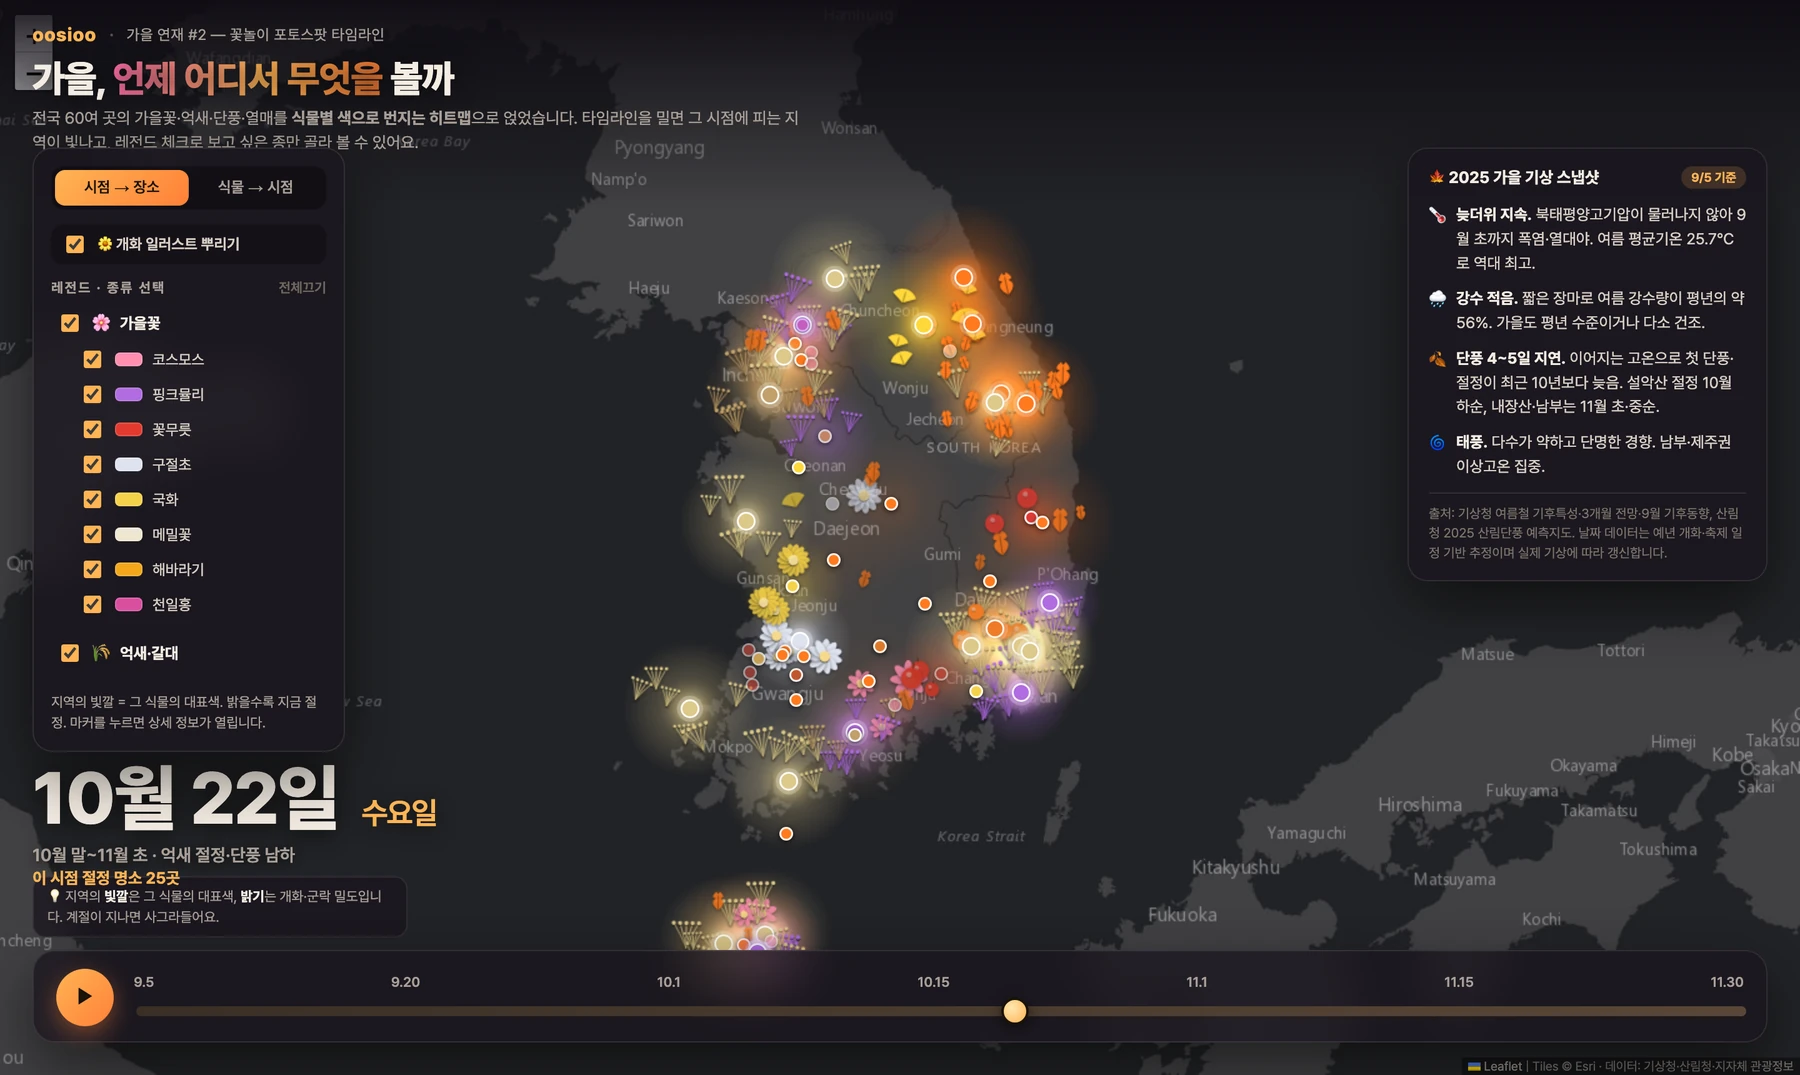
Autumn Flower-Viewing at a Click — 62 Spots Nationwide, Plotted on a Timeline
The fireworks show was pretty worth watching. Figuring I could see it from nearby, I headed to a fairly high spot, and sure enough it was packed with people. Watching the crowd gather made me wonder what else a map could be useful for, and it struck me that once the crisp mornings and evenings of autumn set in, nothing beats going out to see flowers and fall foliage. This time, let's mark the flowers and the foliage.
Keep adding the weather forecast from today, September 5th, onward, and using terrain and map data, web-search your way to spots that are good for observing particular flowers and plants at particular times — then overlay onto the map what can be seen where and when, and, conversely, when and where you'd need to go to see a particular plant.
The request was very simple. Just show me when and where to go to see what. Weather is, after all, closer to a live feed of reality than a prediction, so it seemed enough to just keep referring back to it periodically.
What came out of it
Drag the slider to the right or hit play, and you can see intuitively how things change by period.
| Date | Spots at peak |
|---|---|
| September 5 | 3 spots · Bongpyeong buckwheat, Yeonggwang Bulgapsa red spider lily |
| Early October | Cosmos and pink muhly grass all at once |
| October 22 | 25 spots · the one week when silver grass and foliage overlap |
| Early November | Only southern foliage and late chrysanthemums remain |
Autumn is shorter than you'd think, and it moves fast. There's surprisingly wide variation by region, which makes it hard to judge where to go at a given time — but a map like this makes it easy to pin down exactly when to go see what. I also added things like local festival schedules that you can look up. Of course, Claude Code planned all of this out on its own from start to finish. I was surprised at how closely it matched what I'd had in mind.
How were the 62 spots gathered?
This is the heart of this piece. Last time, with the fireworks festival, the work was calculating satellite elevation data. This time, it was gathering scattered facts together.
I split it into four tracks and had them searched simultaneously.
- 22 autumn flower spots. Cosmos, pink muhly grass, red spider lily, wild chrysanthemum, chrysanthemum, buckwheat, sunflower, globe amaranth
- 14 silver grass and reed spots. Haneul Park, Mindeungsan, Myeongseongsan, Yeongnam Alps, Suncheon Bay
- 22 foliage spots. From Seorak to Naejangsan
- 7 weather-outlook and fruit spots. Cheongdo dried persimmons, Uiryeong kochia, Cheongsong apples
When the four tracks' findings were combined, duplicates showed up. Asan Ginkgo Tree Road, Myeongseongsan, and Sinbulsan each appeared across multiple tracks. After clearing out the duplicates, 62 spots remained.
Coordinates were marked with a confidence level of high, medium, or low, because some spots came up by name only, without a precise location I could pin down. It's better to note that something is unknown than to make it up.
This year's foliage is late
If you write in the peak dates as rough guesses, the map becomes a lie. So I had it find the actual basis, and out came the Korea Forest Service's 2025 forest foliage forecast map.
| Mountain | Peak |
|---|---|
| Seoraksan | October 25 |
| Songnisan | October 27 |
| Naejangsan | November 6 |
| Gayasan | November 11 |
Ginkgo peaks on October 28 on average. And this year it's four to five days later than the past decade's average. The reason lies in summer. According to the Korea Meteorological Administration's records, this past summer's average temperature was 25.7°C, the highest on record, and rainfall was 56 percent of the normal level. When the late-summer heat lingers, foliage gets pushed back. This year really was unusually hot. I seem to recall a forecast saying there wouldn't be any more days above 30°C going forward, yet this week's forecast already has days over 30°C.
How it works
Just dropping pins on a map wasn't enough. Silver grass blankets an entire mountain, and foliage rolls down a whole mountain range. So I drew it as a bleeding glow.
- Each plant is assigned its own actual color, and circles of that color, fading outward, are layered on top of each other
- Where they overlap, the colors add up and brighten. Spots where multiple species converge stand out naturally
- The bleed radius differs by track. Foliage has the widest spread, fruit the narrowest — because that's how they're actually distributed
- Brightness rises and falls over the week before and after the peak date. It doesn't just switch on and off overnight
On top of this I layered small icons: petals, silver grass tassels, maple leaves, ginkgo fans, fruit. They're scattered in proportion to bloom intensity, so the denser clusters mark the peak spots. They can be toggled on and off.
Where it went wrong
One. The base map got covered in a watermark.
When I called the map tiles I always use, the whole screen came back stamped with "API KEY REQUIRED." The provider I'd been using for free had changed its policy. I fixed it by switching to a different provider.
What's funny is that I hit the same trap when building the fireworks-festival map the first time around. Back then I switched to one provider, and this time I switched to yet another. A service you've been using for free quietly turning paid happens more often than you'd think. Licensing issues absolutely have to be factored in.
Two. One line froze the entire screen.
The slider wouldn't move at all. The cause was a single line in the code that draws the timeline.
document.getElementById('months', tl)This function only takes one argument. Passing it two produced a bogus value, and everything downstream ground to a halt. Both the slider and the map updates were blocked by that one line. Deleting the line brought everything else back to life at once. Honestly, this kind of problem almost never happens when you write the code by hand. I'd guess a fair amount of tokens get wasted on things like this.
The structure was such that if one spot quietly died, everything after it simply stopped running. Looking at the screen alone gives you no way to tell where the cause is.
Three. The colors got mixed up with each other.
The policy of using each plant's actual color was good in principle, but once they were all layered together, there turned out to be three shades of pink: cosmos, pink muhly grass, globe amaranth. Three shades of yellow too: chrysanthemum, sunflower, ginkgo. On the map there was no telling which color belonged to which flower.
The fix was shifting pink muhly grass to purple. Pink muhly grass is actually pink, but purple reads more clearly on the map. Sunflower was also separated out from chrysanthemum.
A color that's faithful to reality isn't necessarily a color that reads well.
Four. The legend covered up the date display.
As the number of plant species grew, the list on the left got longer and ended up covering the date display at the bottom of the screen. I gave the list a maximum height and made it scroll when it overflows.
Why does one line get this done?
Last time I named three reasons: public data already exists in full, the barrier of format has gotten low, and it checks itself.
This time has a slightly different texture. What this one needed was research.
Four tracks searched at once. A task that a person would have to do one step at a time got split into four and run all together. While hunting for autumn flowers, it was also hunting for foliage and silver grass at the same time.
Ask for a basis, and a basis gets brought back. Say "write down the peak dates" and you get guesses; say "cite your basis" and the Korea Forest Service's forecast map shows up. That difference is what determines the map's value. A date written down as a guess is worth nothing.
It can be made to say "I don't know" for what it doesn't know. Splitting coordinate confidence into high/medium/low is exactly that. If all 62 spots had been marked as if certain, it would have looked more polished but would have been a map you couldn't trust.
If you want to try this yourself
Ask "when" alongside "where." Ask only "where" and you get a map; ask "when and where" and you get a timeline. The second is far more useful.
Ask the reverse direction too. This request included "and conversely, when and where to go to see a particular plant." That one line is what produced the feature for picking a plant and tracing it back. Without asking, it wouldn't have appeared.
Demand a source for numbers. When you get a map with dates written on it, asking "where did this date come from" is what makes the map usable.
What it can't do
The weather information is frozen at September 5. It isn't pulled in real time; the outlook as of that point was written in. It drifts further off as the days pass. A feature for continuously updating it in real time wasn't built here. Of course, even that could easily be set up to keep pulling in updates continuously.
Peak timing is a forecast. The Korea Forest Service's forecast map is a forecast too, and flower festival schedules change at the organizers' discretion. Check the local notices before you go.
Some coordinates aren't precise. For spots marked low confidence, treat it as accurate only down to the village or mountain name.
Whether flowers bloom and fade is decided by that year's weather. This map is a sketch drawn from normal-year averages and this year's outlook — not a promise.
Hope you get to enjoy some fun flower-viewing at a click. That's it for today.