Was the Bus Driver Who Told Us to Close the Windows in Tunnels Right? — Running Tunnel Air Through a Simulator
Tunnels have jet fans hanging from the ceiling and cars rushing through fast, so it seemed like dust would clear out quickly. I tracked down real measurement data and built a simulator that calculates tunnel airflow and dust by varying the number, size, and speed of vehicles along with road-surface dust, to check the old folk wisdom. While I was at it, I also looked into whether AI-built simulators are a threat to simulation software companies.
When I was a kid riding intercity buses, the driver always said something right before a tunnel: "Going into a tunnel now, please close your windows." The reason given was dust. That habit stuck with me, and even now, whenever I see a tunnel, my hand reaches for the window switch.
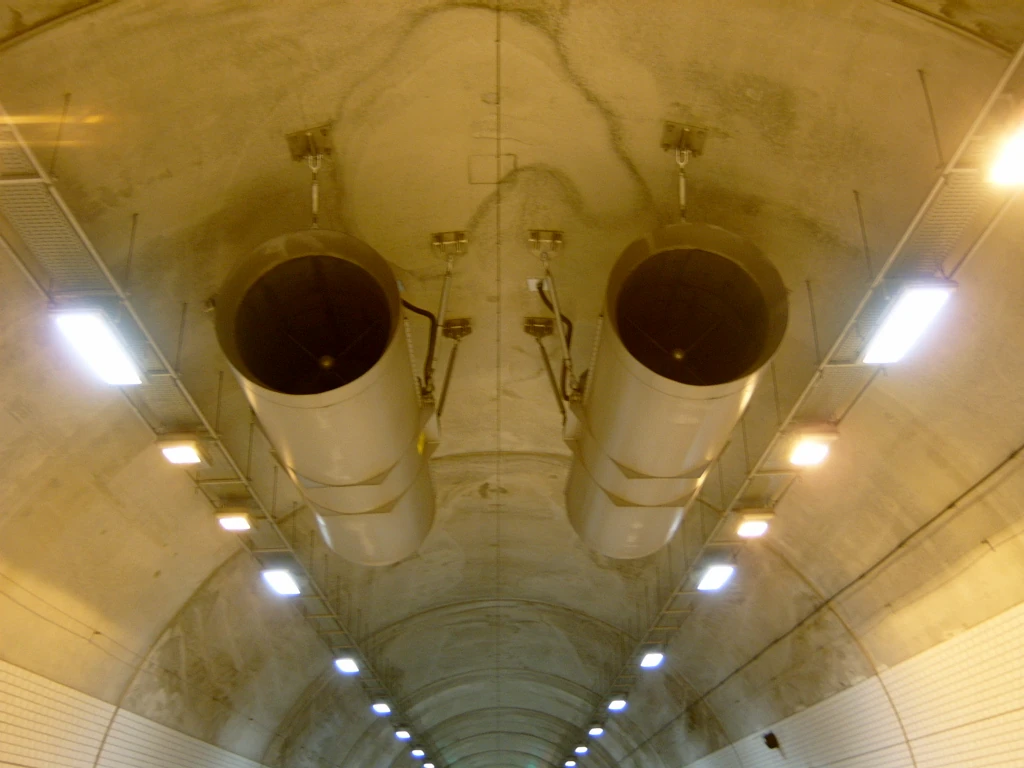
But these days, when you drive into a tunnel, you see large cylinders hanging in a row from the ceiling — jet fans. Cars stream through nonstop at 80 km/h. If the cars push the air and the fans push the air too, wouldn't the dust get swept outside quickly? If so, maybe the advice to close the windows is a holdover from the days of thick black exhaust.
Three things interested me. Is the air inside a tunnel really dirtier than outside? How do airflow and dust change depending on how many cars pass through, how big they are, and how fast they go? And does closing the windows actually mean breathing in less of it?
What I set out to do
There were three things I wanted to do.
- Find real measurement data on dust inside tunnels and ventilation design standards, and check the factual basis of the folk wisdom first.
- Build a simulator that calculates tunnel airflow and dust concentration while varying the number, size, and speed of vehicles, road-surface dust, jet fans, and outside wind. Also calculate how the air inside the bus I'm riding changes depending on the window state.
- These days, building mechanical/dynamics simulators like this with AI and using them for verification has become common. Look into whether this poses a threat to companies that sell simulation software, and how far it's actually being used in practice.
For the research, two AI-spawned subtasks split the work between the tunnel side and the industry side. Meanwhile, the main task was writing the simulator. Research, simulator, figures, and the draft manuscript together took about an hour and a half.
First, the measurements: the air inside tunnels really is dirty
The first half of the folk wisdom was confirmed quickly. The air inside tunnels is dirtier than outside — and by quite a lot.
| Where | What was measured | Result | Source |
|---|---|---|---|
| 3 car tunnels in Seoul | PM10 | Inside 130–254, outside 50–76 µg/m³. 2–5x the nearby monitoring stations | Kim Jeong-hoon et al. (2017) |
| 4 tunnels in the Seoul metro area, morning rush hour | PM10·PM2.5 | PM10 111–268, PM2.5 35–65 µg/m³ | Kim Beom-seok et al. (2015) |
| 9 monitoring points in Seoul (May 2016) | Fine dust | Namsan Tunnel No. 2 at 151 µg/m³, among others — 7 of 9 points rated "Bad" or worse | Seoul Shinmun |
| Taiwan's Xueshan Tunnel (12.9km) | Along its length | Exit concentration about 3x that at the entrance | Ma et al., AAQR |
| Jersey Tunnel, UK | NO₂ | 7x the outdoor measurement point. Authorities recommended "close windows and turn off the blower" (2018) | Jersey Evening Post |
The WHO's daily guideline for PM10 is 45 µg/m³, so the concentration inside Seoul's tunnels runs roughly three to five times that. The same Seoul Shinmun article also noted that there's no legal standard for fine dust inside tunnels.
The turbines on the ceiling barely run
The surprise was the jet fans. When the Korea Institute of Civil Engineering and Building Technology surveyed the ventilation equipment in five tunnels in the Seoul metro area in 2015, the average annual operating rate was under 3%. The highest was 2.24%, and the report noted that "the fans run for less than 10 minutes a day." That means the design has enough margin that there's usually no need to switch them on at all.
Under normal conditions, what pushes air through a tunnel isn't the fans but the cars. As a car drives through, it pushes the air ahead of it like a piston in a syringe — this is called the piston effect. The same report puts the normal tunnel wind speed at 4–6 m/s.
There's another reason the fans rarely run. The standard for tunnel ventilation is the driver's visibility — whether the air is safe to breathe isn't part of the standard at all. The World Road Association (PIARC)'s 2019 standard sets design values of 70 ppm carbon monoxide and a visibility (the degree to which dust blocks light) of 0.005 m⁻¹. Converting that 0.005 visibility figure into fine dust using the same document's conversion formula gives roughly PM2.5 1,000 µg/m³ (my own calculation). The tunnel measurements in the table above fall well short of that line. Another study that measured five domestic tunnels likewise found actual pollution at 2.6% (dust) and 0.8% (carbon monoxide) of the design standard. Since driving isn't impaired, there's no reason for the fans to run. That doesn't mean the air is fine for your health.
So here's what I built: a tunnel air simulator
Below is the simulator I built. The image above shows the tunnel from the side; the redder the color, the more dust relative to outside. The dots are airflow, and the bars are cars. Clicking "Ride the bus through" sends a bus through the tunnel and measures the dust inside it.
The principle is this: treat the air inside the tunnel as a single mass, and balance the forces pushing it against the forces holding it back.
- Pushing forces: When a car moves faster than the air, it pushes the air forward. Buses and trucks push about eight times as hard as passenger cars. I used the vehicle drag areas from the civil engineering institute's report as-is (0.77 m² for small vehicles, 6.42 m² for large ones). I also added the pressure differences created by any jet fans switched on and by outside wind.
- Restraining forces: friction as air scrapes against the tunnel walls, and pressure lost at the entrance and exit.
- Dust: cars emit dust in proportion to the distance they travel. I split this into exhaust, tire/brake wear, and resuspension — dust that had settled on the road getting kicked back up. The emitted dust rides the wind toward the exit, and some of it settles back onto the walls and floor.
- Inside the car: cabin air exchanges with outside air several times an hour. Measurements of passenger cars found recirculation gave 4–9 air changes per hour at 32–105 km/h (Fruin et al. 2011), while outside-air intake or open windows gave roughly ten times that. So I set 70 changes per hour for open windows, 40 for closed windows with outside-air intake, and 6 for recirculation.
The defaults are a 1.5 km, two-lane one-way tunnel with 2,400 vehicles per hour, 10% large vehicles, and outside PM10 of 40 µg/m³.
What running it showed
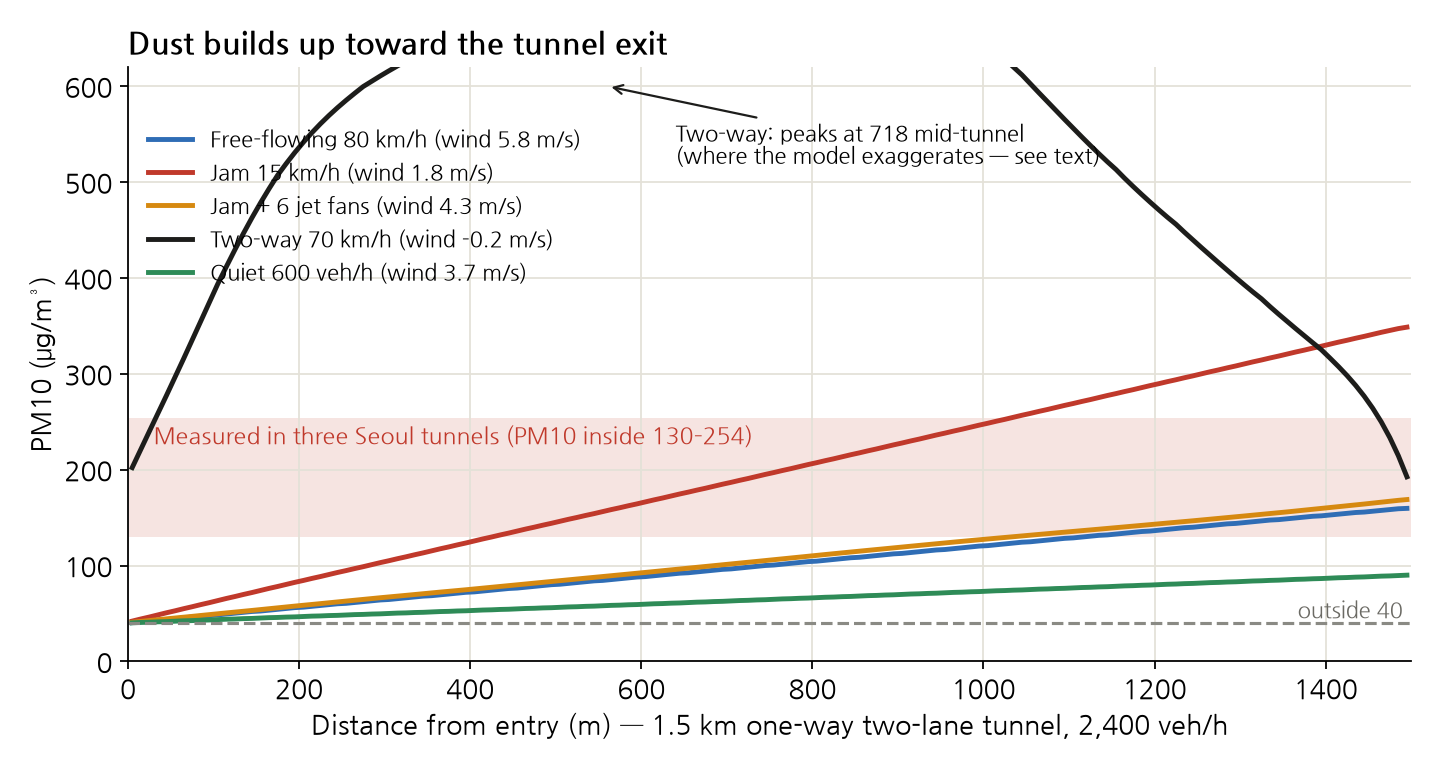
First, dust builds up toward the exit. Since the wind blows in one direction, the clean air entering at the entrance steadily picks up the dust the cars emit and carries it along. Under free-flow conditions the wind speed was 5.8 m/s, and it took a little over 4 minutes for the air in the 1.5 km tunnel to fully turn over once. The tunnel average was 2.5x the outside level, and the exit was 4x — within the range of Seoul's actual measurements.
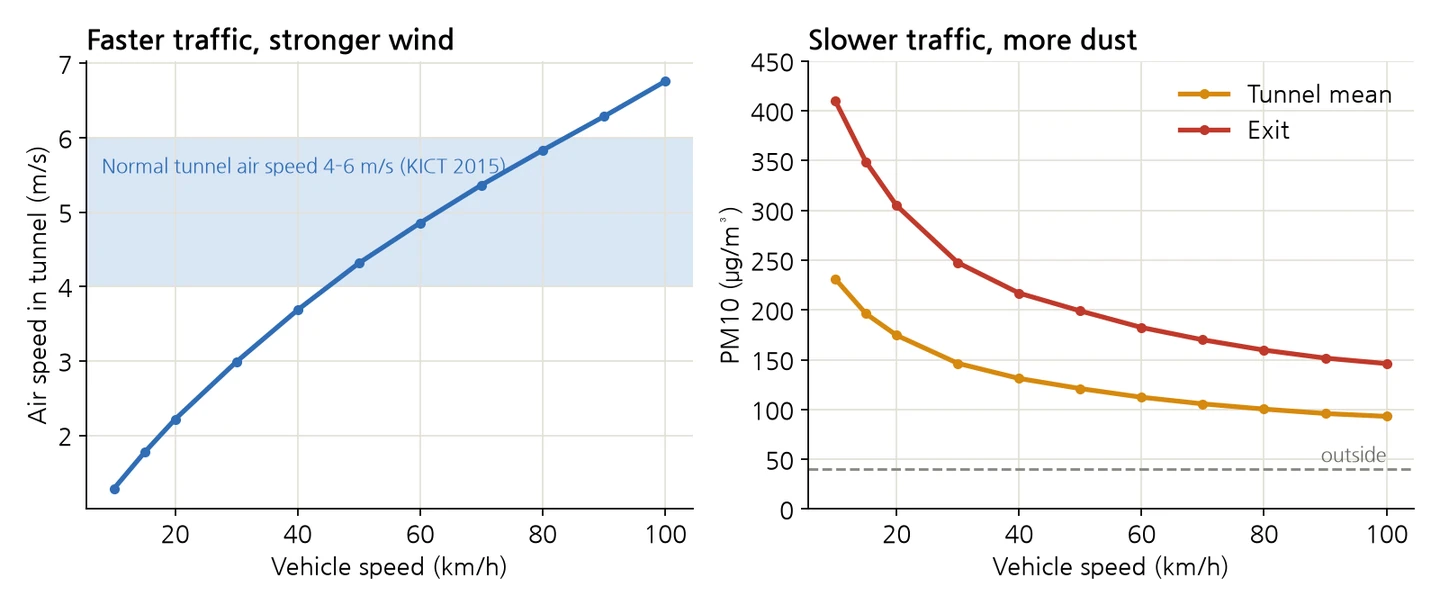
Second, when traffic jams up, the dust gets trapped. When cars crawl at 15 km/h, the piston effect weakens and the wind drops to 1.8 m/s. It takes 14 minutes for the air to turn over once. Meanwhile, the cars pack in tighter, so the dust they emit doesn't decrease. The tunnel average rose to 5x the outside level, and the exit to as much as 9x.
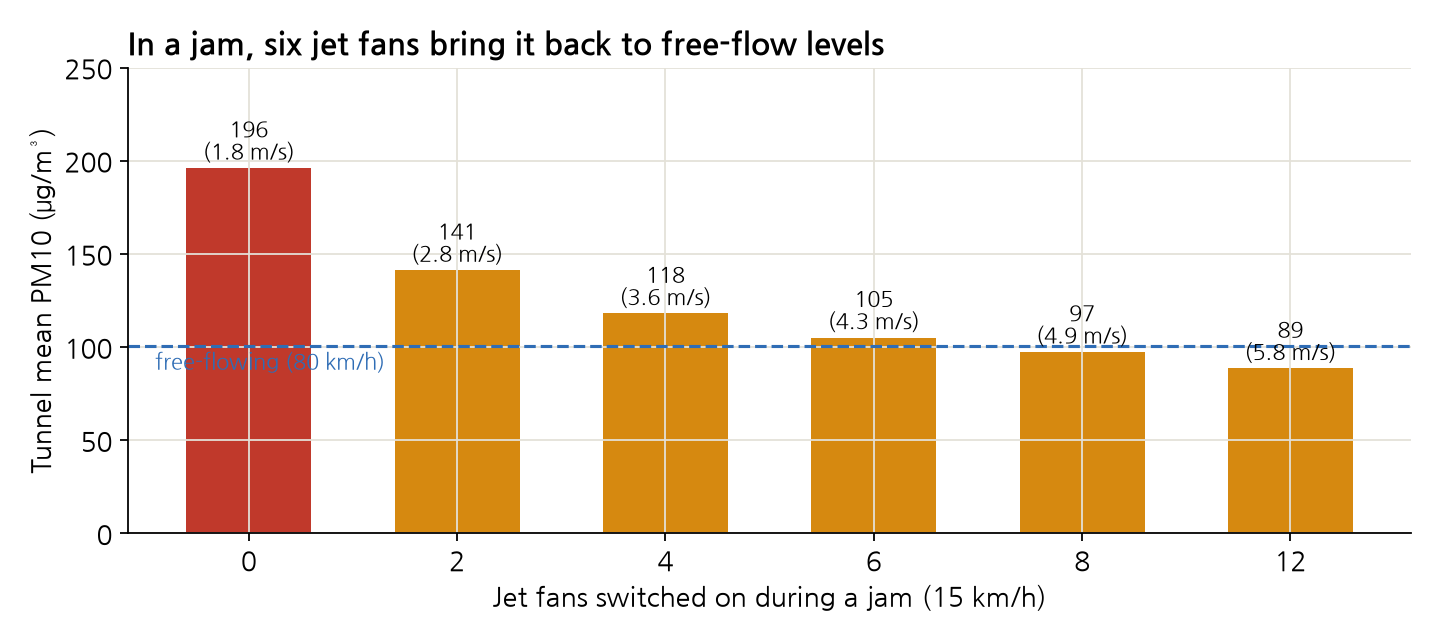
Third, jet fans earn their keep when traffic is jammed. Turning on 6 fans during congestion revived the wind to 4.3 m/s and brought the dust back down to free-flow levels. Under normal conditions the cars do the fans' job, so it makes sense for the fans to sit idle. The problem is when the cars stop. Real tunnels only switch the fans on once a sensor reading crosses a threshold, and since that threshold is visibility, the air may already be fairly murky to breathe by the time it triggers.
Fourth, buses and trucks generate both stronger wind and more dust. Raising the share of large vehicles from 10% to 40% strengthened the wind from 5.8 to 7.7 m/s, but the tunnel average dust also rose from 100 to 132 µg/m³. The dust large vehicles emit outweighs the wind they generate. Road-surface dust has a more direct effect: tripling the floor dust pushed the average from 100 to 171.
Fifth, two-way tunnels are the worst. Oncoming cars cancel out each other's piston wind, driving it to nearly zero, leaving the dust with no way to clear. Seoul's own design standard also notes that in two-way tunnels, when wind speed approaches zero, "concentration rises sharply." That said, this simulator exaggerates the two-way case — the reason is explained below in "Where it went wrong."
Does closing the window mean breathing in less?
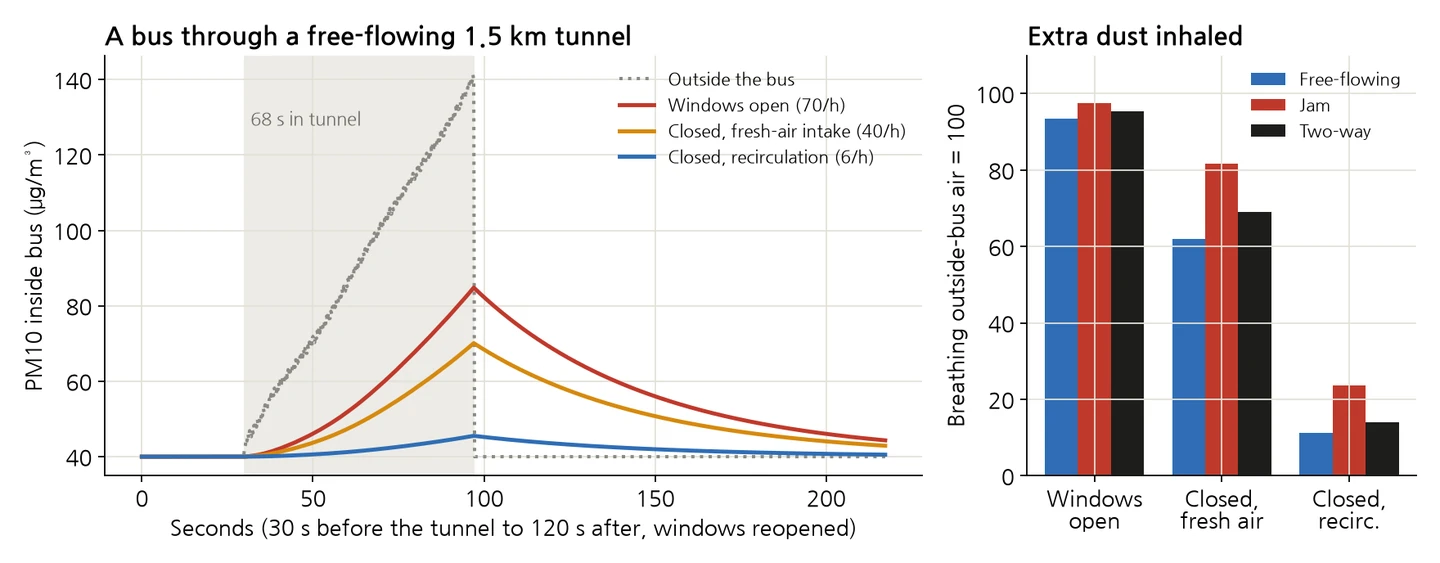
I sent a bus through and tracked the cabin air from 30 seconds before the tunnel to 2 minutes after exiting, comparing the extra dust inhaled against the case of breathing the outside air directly.
| Situation (time to cross tunnel) | Windows open | Closed, outside-air intake | Closed, recirculation |
|---|---|---|---|
| Free-flow, 80 km/h (68 sec) | 94 | 62 | 11 |
| Two-way, 70 km/h (77 sec) | 95 | 69 | 14 |
| Congested, 15 km/h (6 min) | 98 | 82 | 24 |
Just closing the windows while the blower keeps pulling in outside air cuts the amount by about a third. Switching to recirculation cuts it by nine-tenths. The key isn't closing the windows — it's cutting off the outside-air supply. The more congested the tunnel, the smaller the effect, because the longer you stay inside, the more the cabin air eventually tracks the outside air.
To put that in more tangible terms: crossing a free-flowing 1.5 km tunnel with the windows open is like breathing outside air for an extra 1 minute 20 seconds. If it takes 6 minutes because of congestion, that becomes the equivalent of 26 minutes. If it's a one-off trip, that's not much — but it's a different story if you commute through a congested tunnel every day.
So the folk wisdom was right. The air inside a tunnel is several times dirtier than outside, and closing the windows means breathing in less of it. But the driver's advice needs one more line added: "Close your windows, and switch the blower to recirculation."
Where it went wrong
- The initial emission figures didn't reproduce Seoul's measurements. Using only exhaust and tire/brake wear values taken from overseas tunnel measurements, the tunnel average came out to just 1.6x the outside level — but Seoul's actual measurements show 2–5x. After seeing a UK study of the Hatfield Tunnel reporting that over a quarter of PM10 emissions come from resuspended road dust, I added a separate resuspension term. Only then did the figures come out to 2.5x average and 4x at the exit. Since these values were tuned to match the measurements, getting the right number isn't proof the model itself is correct — which is why I kept the road-surface dust slider separate.
- Two-way tunnels are exaggerated. When the wind approaches zero, this model only lets dust escape by diffusion, so the concentration at the tunnel's midpoint spiked past 700 µg/m³. In reality, oncoming cars stir up the air and mix it far better. A one-dimensional model that flattens everything into a single line can't see that turbulence. Also, real two-way tunnels turn on their fans once concentration rises.
- I nearly missed how a closed-window bus traps dust. At first I kept the windows modeled as closed even after exiting the tunnel. That makes the trapped dust clear slowly, which understates the benefit of recirculation (21 instead of 11 under free-flow conditions). In reality, people reopen the windows after leaving the tunnel, so I recalculated with that correction.
- There's no air-exchange rate specific to buses. I couldn't find measured values for buses, so I borrowed the passenger-car figures. Buses may differ because their doors open frequently and their interior is larger. A study that measured buses passing through Hong Kong tunnels found air-conditioned buses had lower carbon monoxide than buses with open windows (2.9 vs. 4.6 ppm), so at least the direction is right.
- The model can't capture cases where the cabin gets worse than the outside air. Another measurement in Hong Kong found that a car with windows closed and the AC drawing outside air was the worst case of all. That's from a single 1998 car with no filter, but it can happen if the car right ahead's exhaust feeds directly into the intake. Since this simulator averages across the cross-section, it doesn't know about the dense pocket of exhaust trailing right behind the car ahead.
- I did check the calculation itself. Adding up dust emitted, dust that exited, and dust that settled should balance against what remains in the tunnel. The error was on the order of one part in a trillion. Under free-flow conditions, the exit concentration also matched a hand calculation of "amount emitted ÷ amount of air passed through" within 5%. The wind speed fell within the measured range (4–6 m/s).
Does an AI-built simulator threaten simulation companies?
The simulator in this article took less than half a day. These days I often have AI write 3D simulations or mechanical/dynamics calculations like this to check my thinking. That got me wondering whether the simulation software sold by companies like Ansys, Siemens, and Dassault is doing fine.
The market isn't small. The engineering simulation (CAE) software market was worth about $11.6 billion as of 2025, according to research firm Cambashi. The landscape has shifted a great deal in the past two years: chip-design company Synopsys bought Ansys in July 2025, Siemens bought Altair for about $10 billion, and Cadence bought Hexagon's design and engineering business (including MSC Nastran) for about €2.7 billion in February 2026.
The numbers show no threat yet. After folding in Ansys, Synopsys's fiscal Q3 2026 revenue grew 42% year over year (press release republished, including the effect of the acquisition), and the company raised its annual outlook. Siemens's Digital Industries Software revenue also grew 15% in the same quarter. I couldn't find any earnings report or analyst note showing simulation revenue declining because of AI.
Stock prices got scared first. On February 3, 2026, the day an AI work-automation tool launched, U.S. software, financial-services, and asset-management stocks lost $285 billion in a single day. On February 11, Dassault Systèmes shares fell 20.8% in one day. The immediate trigger was 1% Q4 revenue growth and an annual outlook that missed expectations, but the coverage pointed to AI fear as the backdrop. In other words, the narrative moved before the earnings did.
The companies themselves have moved to build AI into their own products. In 2024, Ansys released SimAI, which trains on past simulation results to quickly predict outcomes for new designs. In May 2026, Siemens added Simcenter PhysicsAI, building on technology from Altair. COMSOL added a chat interface in version 6.4 that lets users write model code in natural language. Nvidia, together with these companies, put out a real-time digital-twin design proposal. Money is also pouring into startups that replace calculations with neural networks trained on simulation results: London's PhysicsX raised $300 million at a $2.4 billion valuation in June 2026, and Switzerland's Neural Concept raised $100 million in December 2025. PhysicsX's investor list includes Nvidia and Siemens — the incumbents are funding their own competitors.
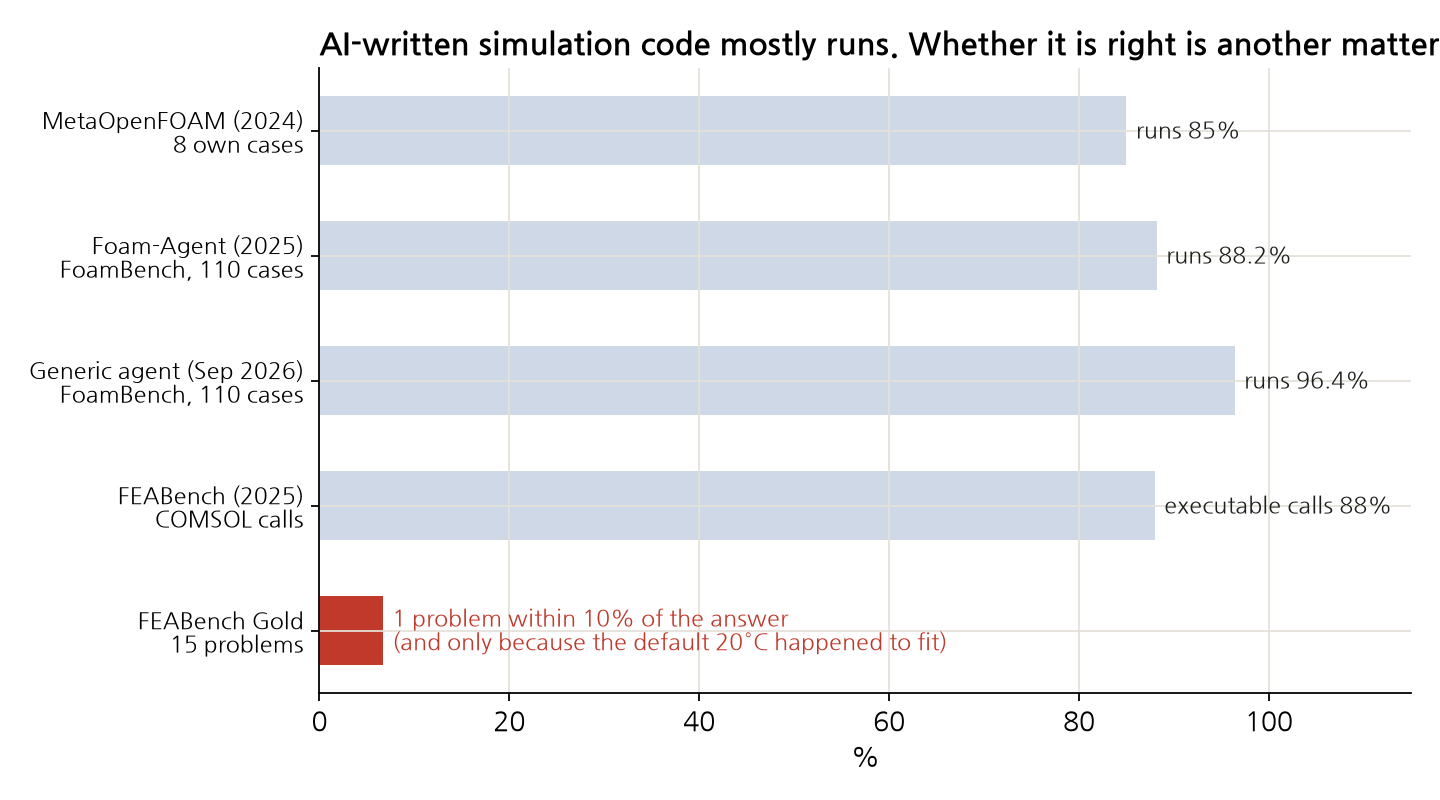
AI-written simulation code mostly runs. Whether it's correct is a different matter. Research on AI agents operating the open-source fluid-dynamics program OpenFOAM raised execution success rates from 85% in 2024 to 88.2% in 2025. In September 2026, a general-purpose coding agent scored 96.4% on the same benchmark — higher than purpose-built multi-agent systems. But Google and Harvard researchers' FEABench tells a different story. When AI was set loose on the commercial simulation program COMSOL, 88% of its commands executed, but out of 15 hard problems, only one landed within 10% of the correct answer. Even that one was only right by accident, because the program's default of 20°C happened to stand in for the correct answer of 18.3°C. In 2026, a paper even appeared titled "The Simulation Runs, But Solves the Wrong Physics". A case was also reported where an error — the inlet velocity entered at four times the correct value — went undetected through thirteen rounds of follow-up requests.
The door to certification remains narrow. The U.S. FDA's November 2023 guidance on the credibility of simulation for medical-device submissions covers only physics-based models, explicitly placing standalone AI/machine-learning models outside its scope. In aircraft certification too, substituting simulation for physical tests is negotiated case by case, and only models validated against flight and ground tests can replace some tests.
In short: wherever a design gets certified and someone is accountable for it, validated solvers and experimental data remain exactly as necessary as before. Where AI is making inroads is the earlier stage — quickly checking "could this work?" The tunnel simulator in this article sits right there. It's good enough to see a trend, but not something you'd bring to a tunnel-ventilation design review. How much of simulation companies' revenue that earlier stage accounts for hasn't shown up in any numbers yet. If anything, since neural networks need a lot of high-fidelity simulation results to train on, AI might end up driving more solver runs, not fewer (this is my own inference). Based on the evidence so far, it's more accurate to say the lower tier of the market is expanding.
Why this came together so easily
Tunnel ventilation is a field with well-established textbook methods. Treating tunnel air as a single mass and balancing forces is the approach used by design standards both in Korea and abroad, and the necessary coefficients (wall friction, vehicle drag area, jet-fan thrust) are laid out in tables in public reports. There are also several domestic measurement papers. With all the ingredients already available, AI only had to assemble them.
But once again, what came together easily was only the simulator's surface. The fact that the initial emission values didn't reproduce the measurements, that two-way tunnels were exaggerated, and that the answer changed depending on whether the windows were reopened after exiting — all of that only became visible once I checked the numbers against actual measurements. As with FEABench above, there's always verification standing between "it runs" and "it's correct."
If you want to try this yourself
- Find the real-world measurements first. You need a measured range in hand before writing the simulator, or there's no way to tell if the results are right. Here, Seoul's 2–5x tunnel ratio and wind speeds of 4–6 m/s served as that yardstick.
- Have it check mass balance. Making it verify that what came in, what went out, and what remains all add up catches almost every major mistake in the code.
- Have it do a hand calculation alongside. Checking whether the simulator's result agrees with a one-line estimate like "exit concentration ≈ amount emitted ÷ amount of air" helps filter out cases where the code runs but solves the wrong physics.
- Ask up front what the model can't see. A one-dimensional model can't see turbulence within a cross-section. You need to know ahead of time which scenarios that limitation distorts (here, the two-way case) before reading the numbers.
What this can't do
- It doesn't look inside the cross-section. Because the model flattens the tunnel into a single line along its length, it has no knowledge of the dense exhaust pocket right behind the car ahead, lane-by-lane differences, or concentration differences between ceiling and floor.
- The numbers for two-way tunnels are heavily exaggerated. Treat only the trend (that it's the worst case) as meaningful, not the actual values.
- The emission values are tuned to match measurements. Per-vehicle-type emissions and road-surface dust were chosen to fall within the range of overseas and Seoul measurements — they are not values from any specific tunnel.
- Bus ventilation borrows passenger-car values. The effects of doors opening and closing, and the vehicle's filter performance, are not included.
- There's no sensor or fan control logic. Real tunnels turn on fans once concentration crosses a threshold, but in this simulator a person turns them on manually with a slider.
That bus driver from my childhood probably didn't know the physics equations, but the conclusion was right. Tunnel air is several times murkier than outside, and it gets murkier still when traffic jams up. Next time you go through a tunnel, close the windows and give the recirculation button a press.
If you enjoyed this, please leave a comment.
Sources
- Featured photo: Misiryeong Tunnel jet fans, Misiryeong, CC BY-SA 4.0 (Wikimedia Commons.jpg))
- Tunnel ventilation coefficients (wall friction, vehicle drag area, normal wind speed, jet-fan operating rate): Korea Institute of Civil Engineering and Building Technology, "A Study on Establishing Cost-Effective Maintenance and Management Guidelines for Road Tunnel Ventilation Systems" (2015)
- Ventilation design values: PIARC, Road Tunnels: Vehicle Emissions and Air Demand for Ventilation (2019), Chapter 4. Two-way traffic wind speed: Seoul Metropolitan Government's revised road tunnel ventilation design standard (2017, Korean Tunnelling and Underground Space Association)
- All figures in the simulator charts were calculated using the simulator in this article (averaged over 3 runs under identical conditions)