oosioo
Read in English

A Single Photo, Turned Into 3D — Faking Instagram's 3D Images with a Depth Map
I took the 3D photo layering I saw on Instagram through my Oculus and faked it on a single flat monitor. An experiment using monocular depth estimation to build a depth map, then shifting pixels with gaze direction to trick the eye into seeing depth — all from one black-and-white street photo, "ILLUSO."
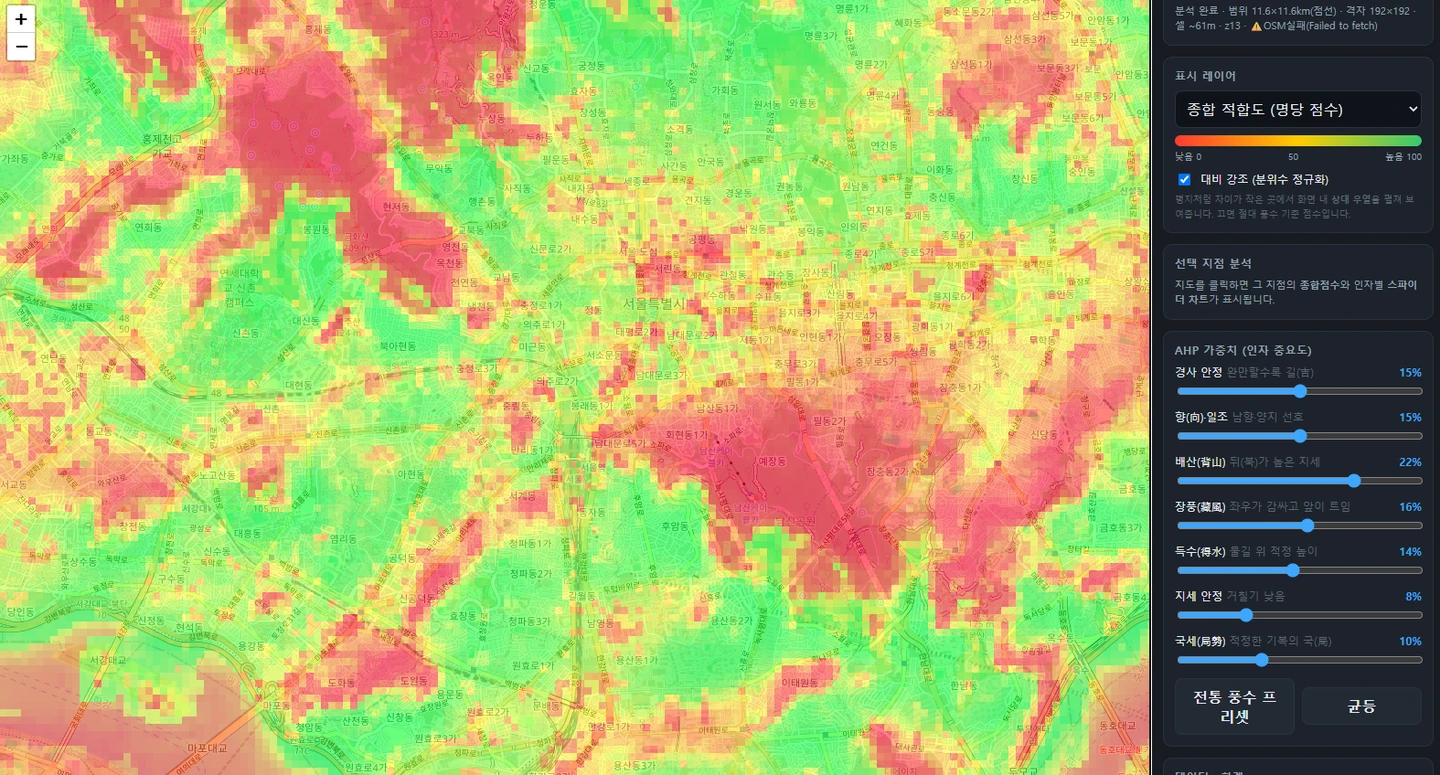
Could AI Hunt Down the Perfect Feng Shui Site? — A Map That Translates Seven Feng Shui Conditions into Terrain Numbers
I asked, in one line, to calculate a good site for building a house from terrain, water, buildings, and sunlight. Out came a map that turns old sayings like "mountain behind, water in front" and "wind-gathering, water-holding" into numbers — slope, orientation, even distance to water. I also dig into the spot where flat land scored the same everywhere, and the same problem I ran into in Part 1 showed up again.
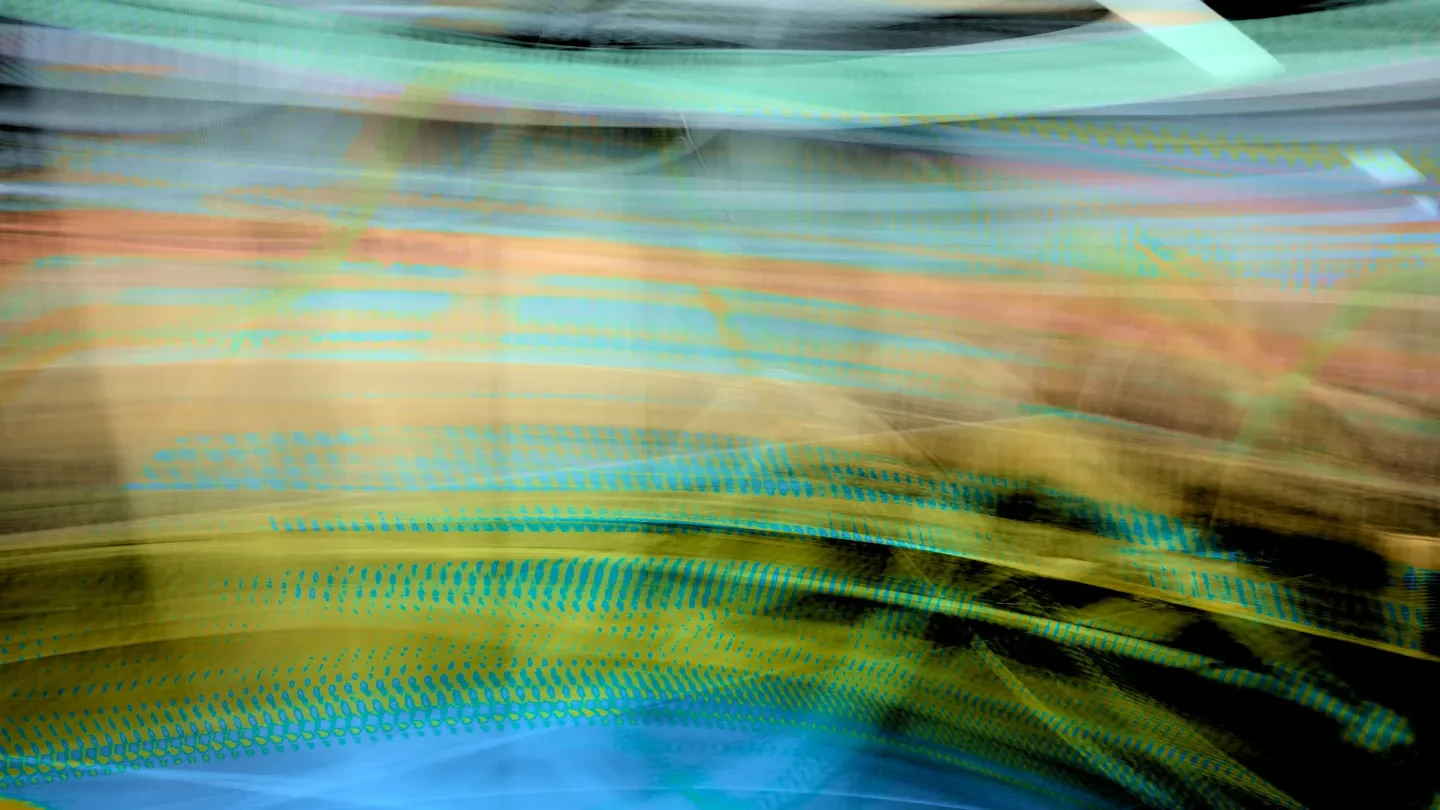
A 10-Second Video Folded Into One Photo — The Math of Stacking 682 Frames
I wanted to turn a 10-second action-cam clip into a single photo. Just adding frames burns them white; averaging them turns everything gray. It took three wrong turns and 26 minutes. This time, unlike the previous installment, I could actually see where I'd gone wrong.

I Erased the Name and Gave It Only Eight Characters — AI Reads the Fortunes of Einstein and Jobs
A long-fixed system like Saju has plenty of material piled up on the web, which makes it good raw material for AI. It really did come together in half a day. But once it was built, the real problem turned out to lie elsewhere — how do you know if it's right? We had it read blind, with the subject's identity hidden, and checked the results against the historical record.
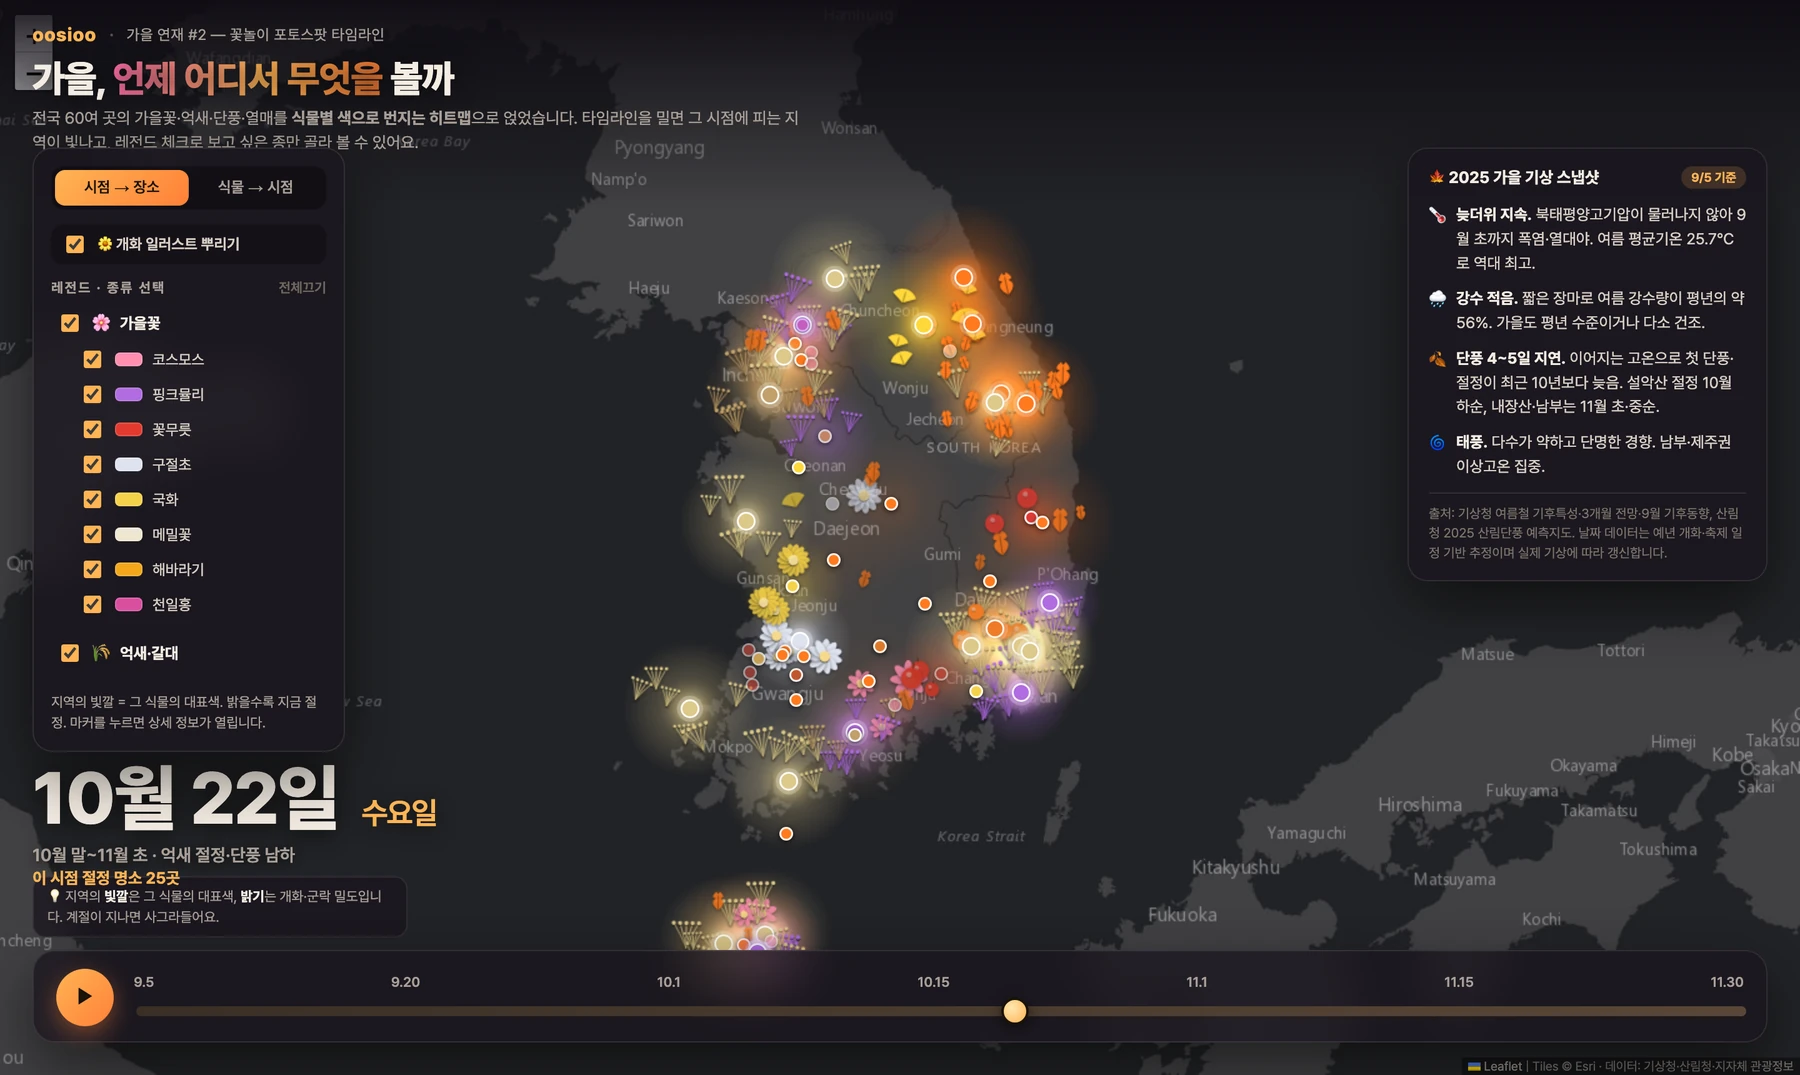
Autumn Flower-Viewing at a Click — 62 Spots Nationwide, Plotted on a Timeline
The question was one line: when and where should you go to see a given flower? Out came a map of 62 spots nationwide, each peak season placed on a timeline. Drag the slider and only the spots in bloom on that date light up.
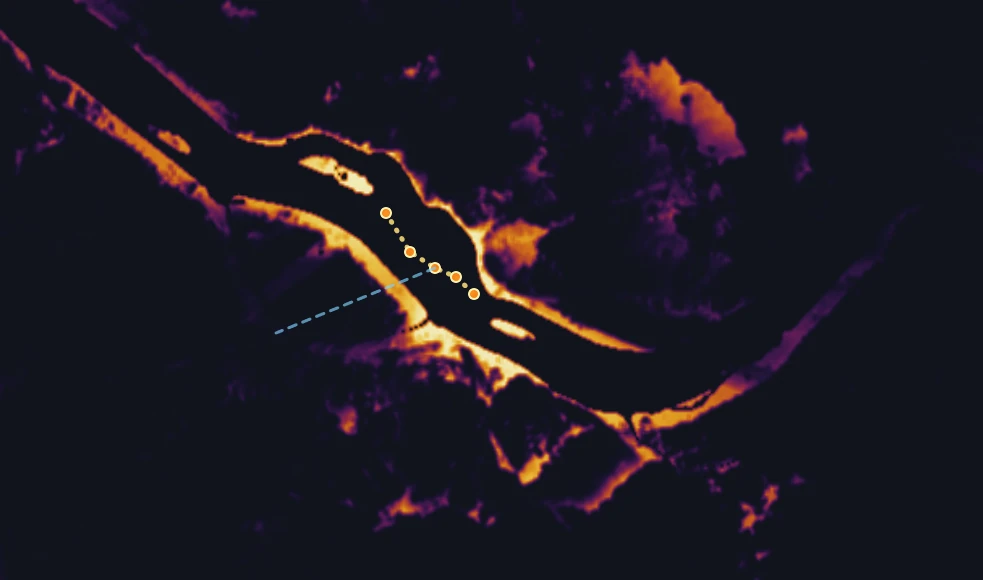
One-Click Firework Festival Best-Viewing-Spot Map — Building a Map That Calculates 990,000 Grid Cells of Seoul from a Single Line of Input
I asked an AI, in a single line, where the best spots to watch the Seoul International Fireworks Festival would be. Forty minutes later, out came a heatmap that judged sightlines across 990,000 grid cells of Seoul using terrain and building height data. Here's a breakdown of what actually ran under the hood, where it went wrong, and why a single line of input was enough.