oosioo
Read in English
A vision engineer measures and simulates coffee, from the moment a bean breaks between the burrs to the moment it reaches the tongue. Read in order →

Looking at a Cup of Coffee as a System
From the moment a bean fractures between the burrs to the moment it touches the tongue, I've mapped the process in eight stages, charting what research has established at each stage and where the gaps remain. The starting point for the series "From Burr to Tongue."
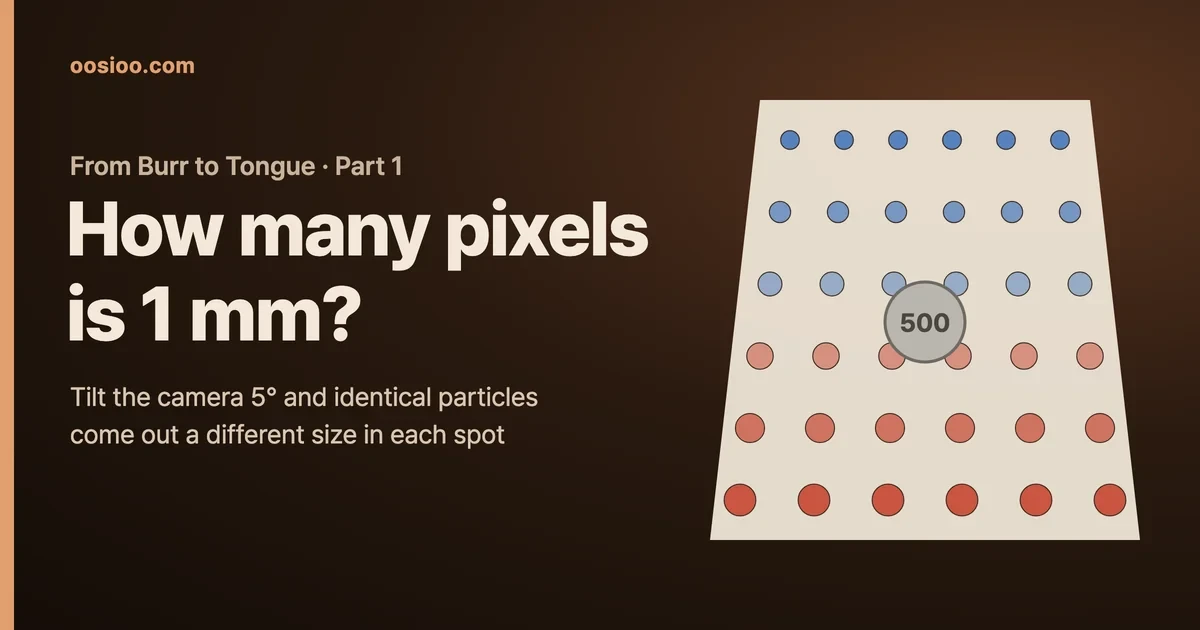
How Many Pixels Is 1 mm in a Photo?
Set the magnification with a single coin, and you're assuming the whole photo shares that same magnification. Tilt the phone 5° and particles of the same size get captured nearly 9 percentage points differently depending on where they sit — yet the coin itself distorts by only 0.4%. A pinhole-camera look at the first step of measuring photos.
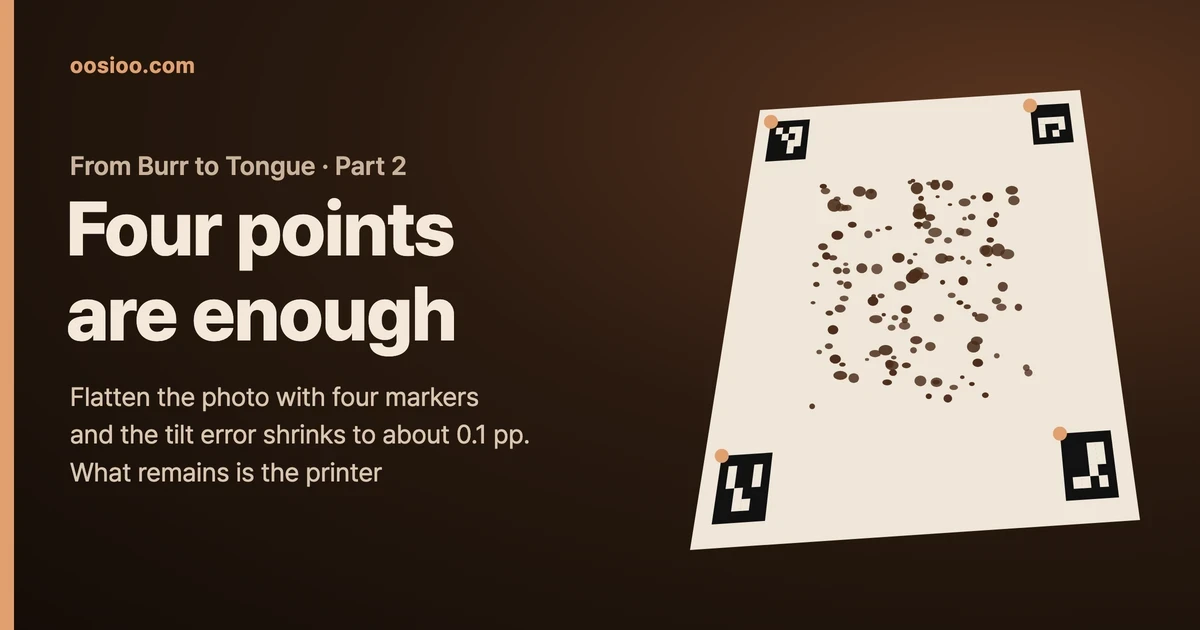
Four Points Are Enough
A single coin can't straighten a tilted photo. Stick four ArUco markers on the paper, and a perspective transform (homography) can flatten the shot — in synthetic-photo tests, the tilt error dropped from 7.7 percentage points to 0.08. But some error still remains, especially a print-scale problem that no photo alone can reveal, and that's what the marker sheet v1 introduced here is designed to catch.
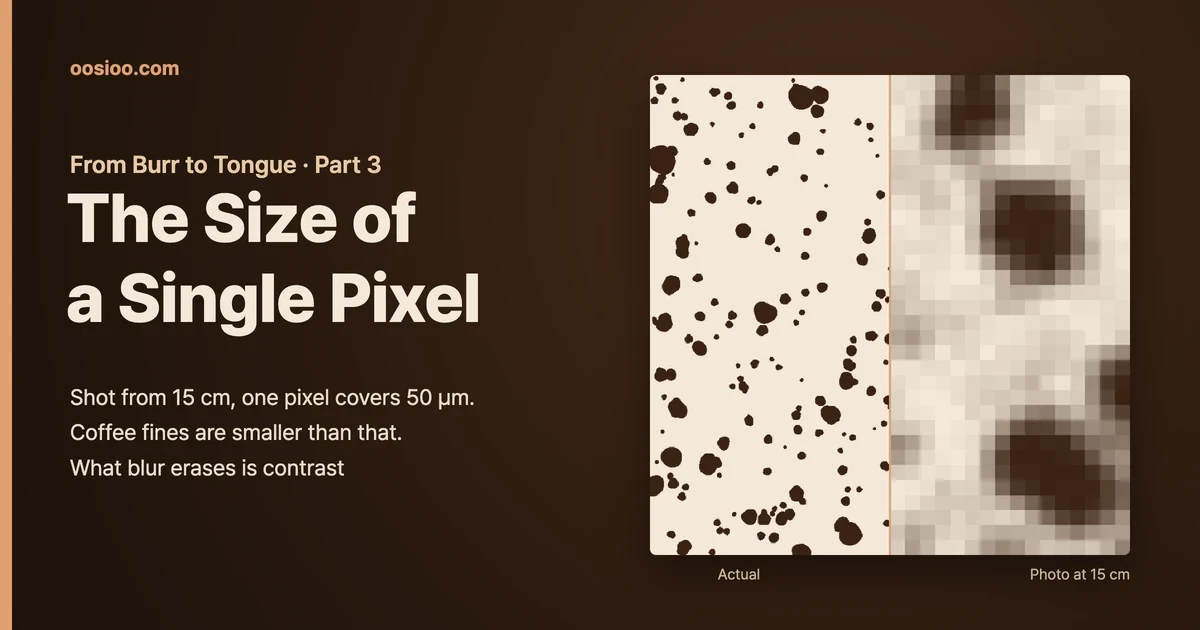
The Size of a Single Pixel
Hold a phone 15 cm above the paper and one pixel covers about 50 µm, while coffee fines peak at 30–40 µm. Following a single particle through lens blur, pixels, noise and a brightness cutoff in synthetic photos shows that, with 0.8 px of blur, particles under about 96 µm vanish entirely and measuring size within ±5% takes a diameter of 8–10 pixels. Photograph a virtual sample that is 20% fines by volume, and the fines shrink to 0.1%.
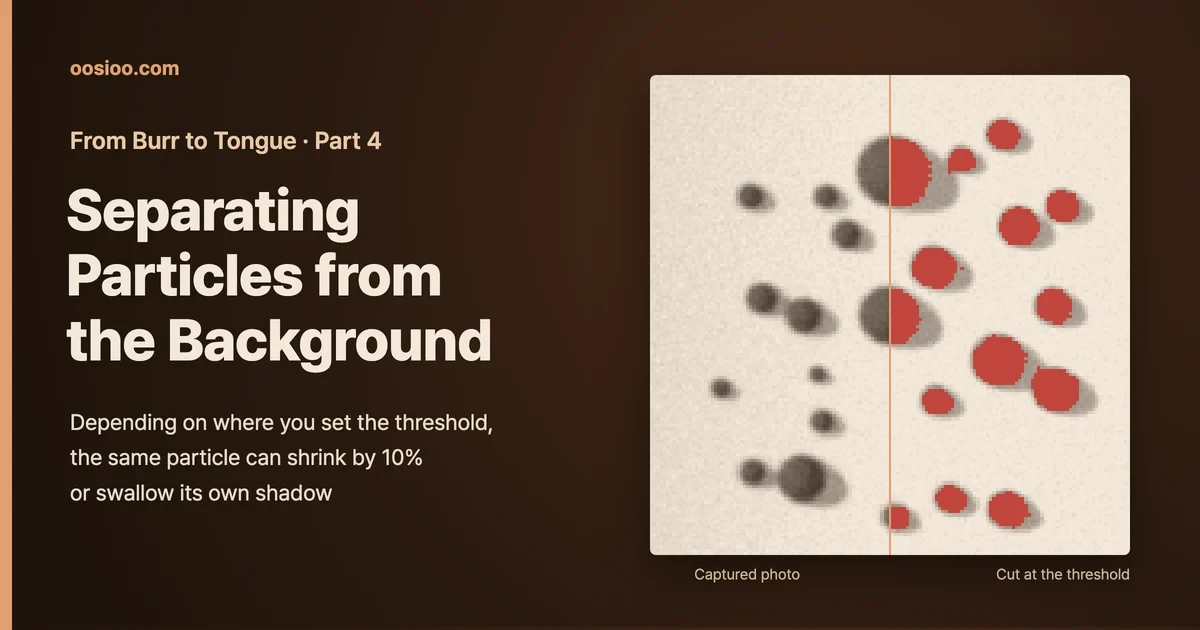
Separating Particles from the Background
To measure particles in a photo of coffee grounds, you first have to decide where the background ends. I calculated how much oblique light’s shadows, the gap between pixel values and amounts of light, and Otsu’s method can sway the threshold, and used one public example photo to check what flattening the background does.
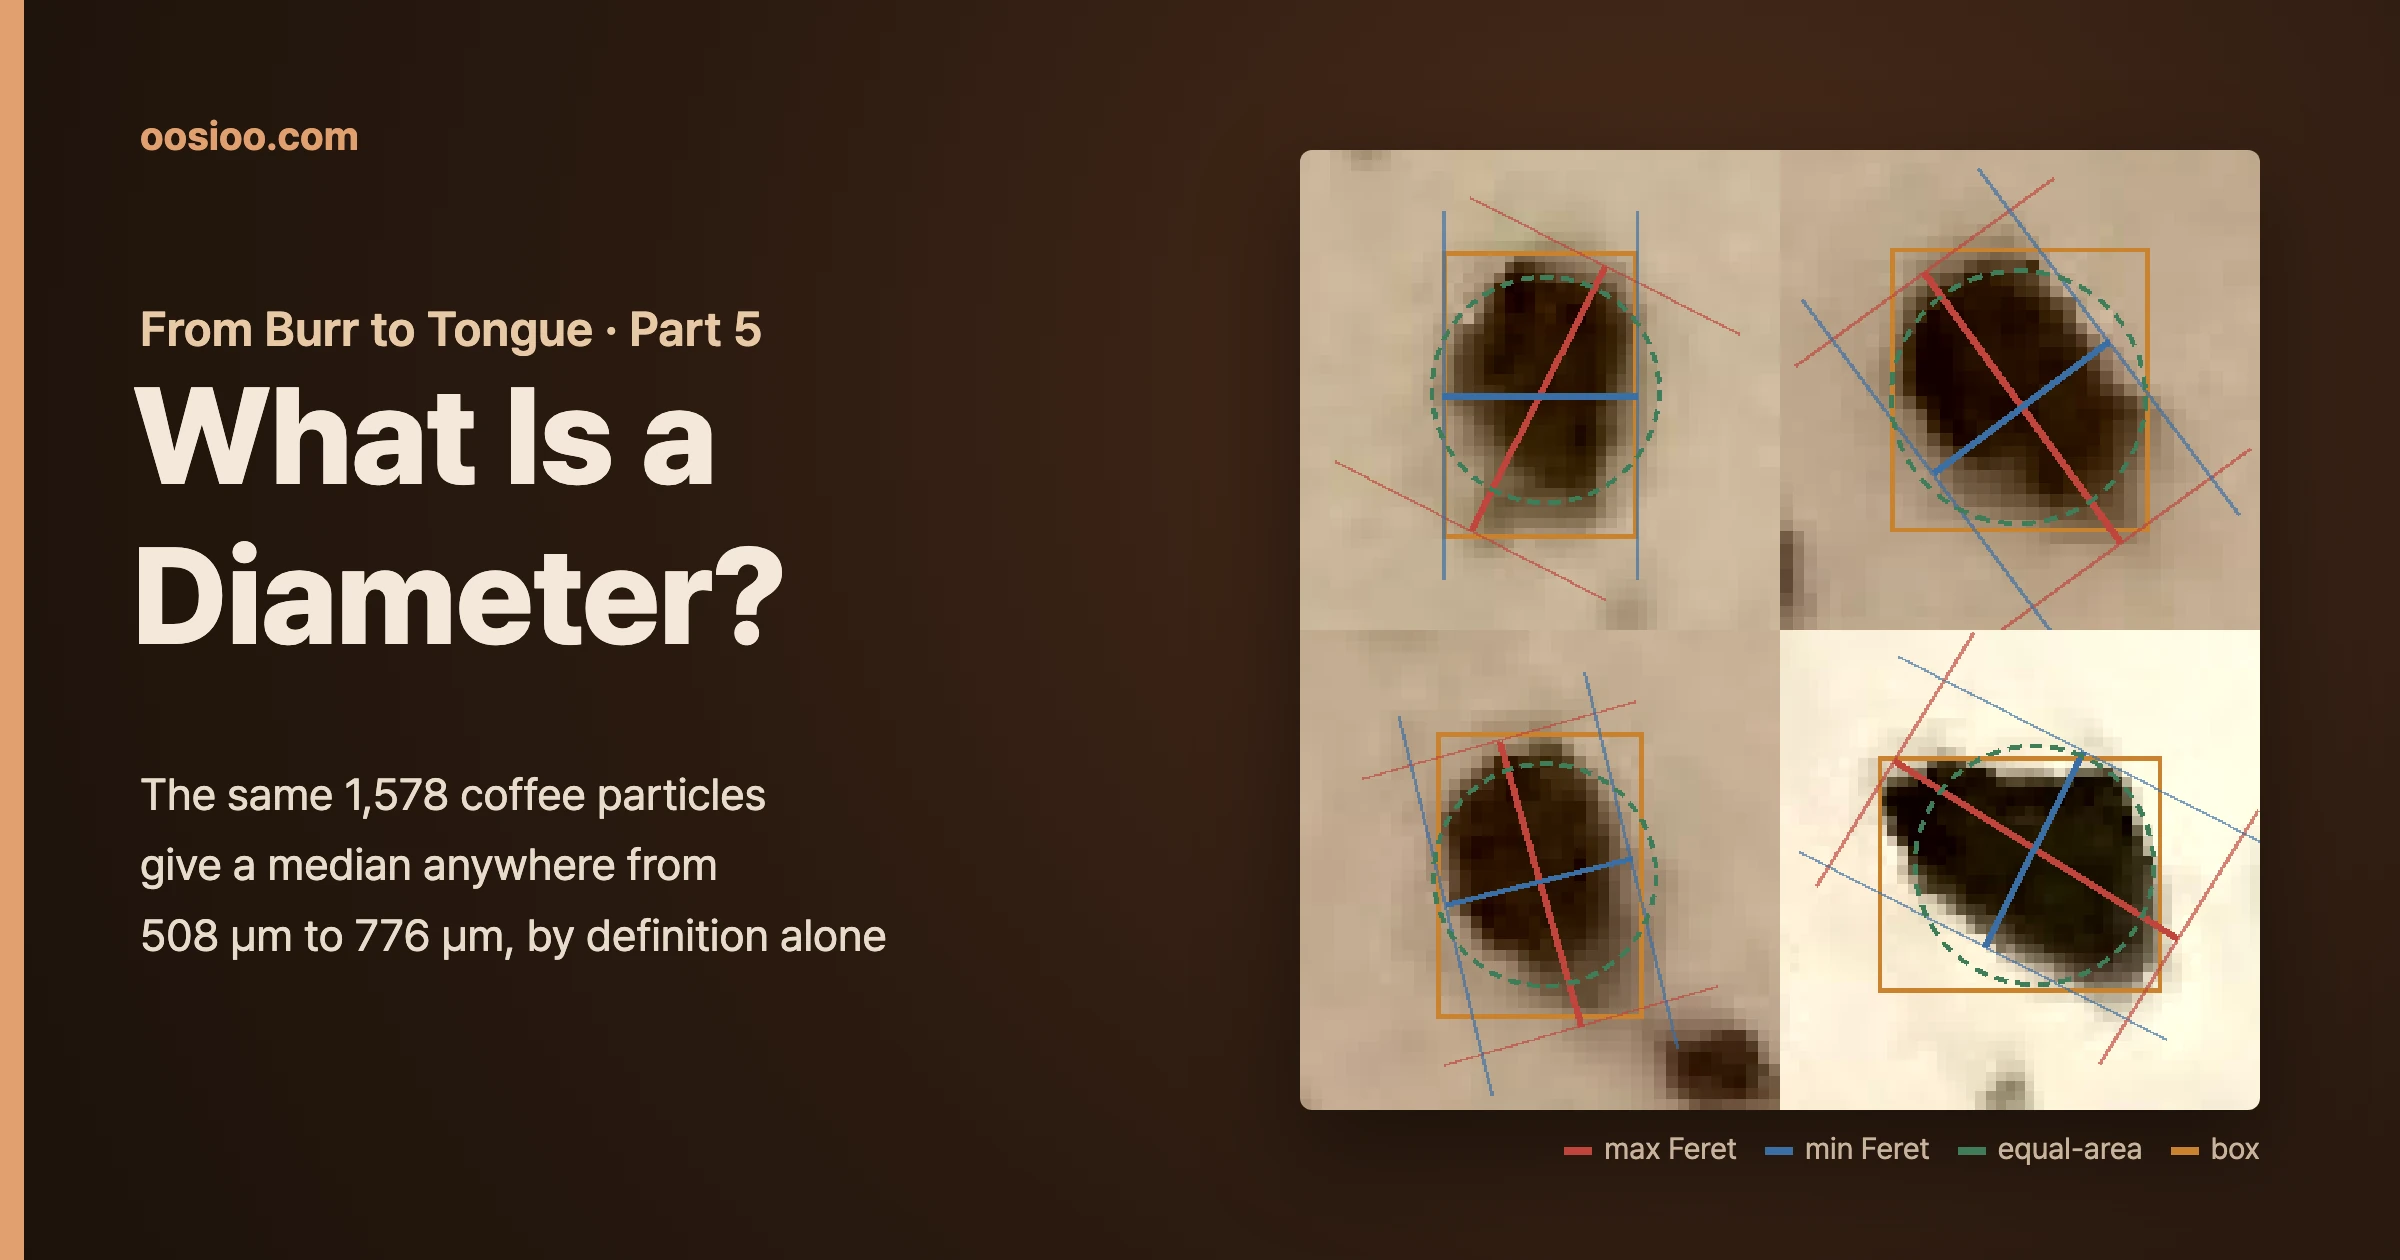
What Is a Diameter?
Once particles have been picked out of a photo, their size has to be written down as a single number. But flat, elongated coffee particles don't have just one diameter. Measuring the same 1,578 real particles from a public example photo under five different definitions, the median ranged from 508 µm to 776 µm. The piece also calculates how the thickness axis — invisible in the photo — changes both the sieve-measured size and the volume.
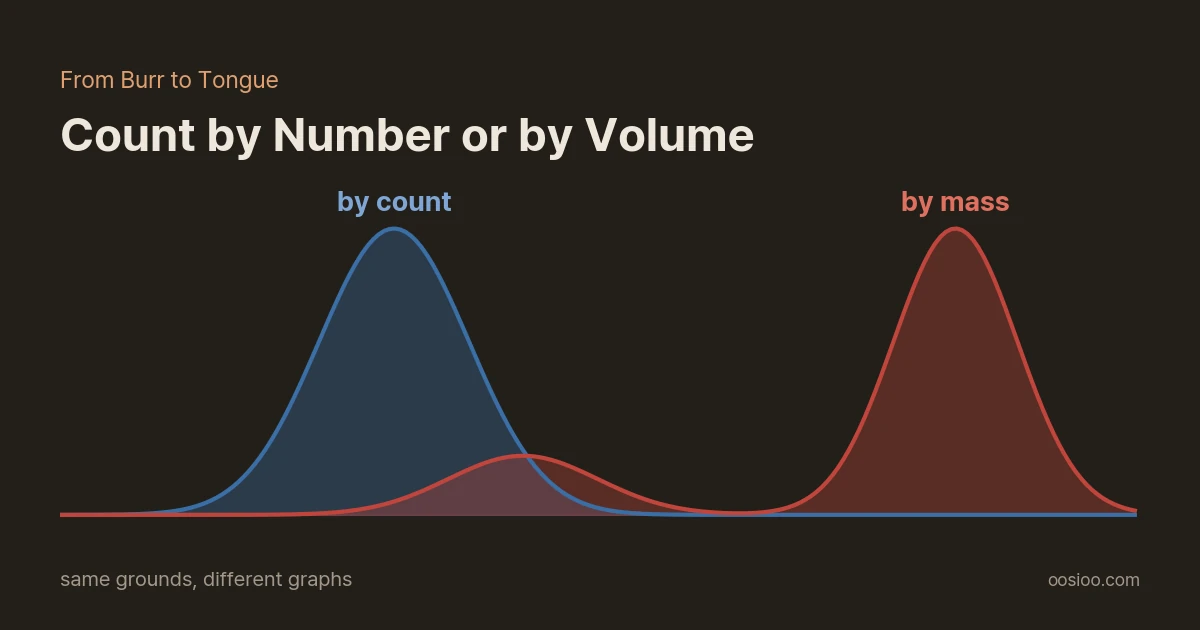
Count by Number or by Volume
What is the vertical axis of a particle-size graph a percentage of? The same ground coffee peaks at 13 µm if you count by particle number, but past 800 µm if you count by weight. Using the actual 1,578 particles from a public example photo and a model that adds back in the fines, I worked out how much the graph changes depending purely on how you count — and why a camera-measured count graph ends up looking more like the camera than the coffee.
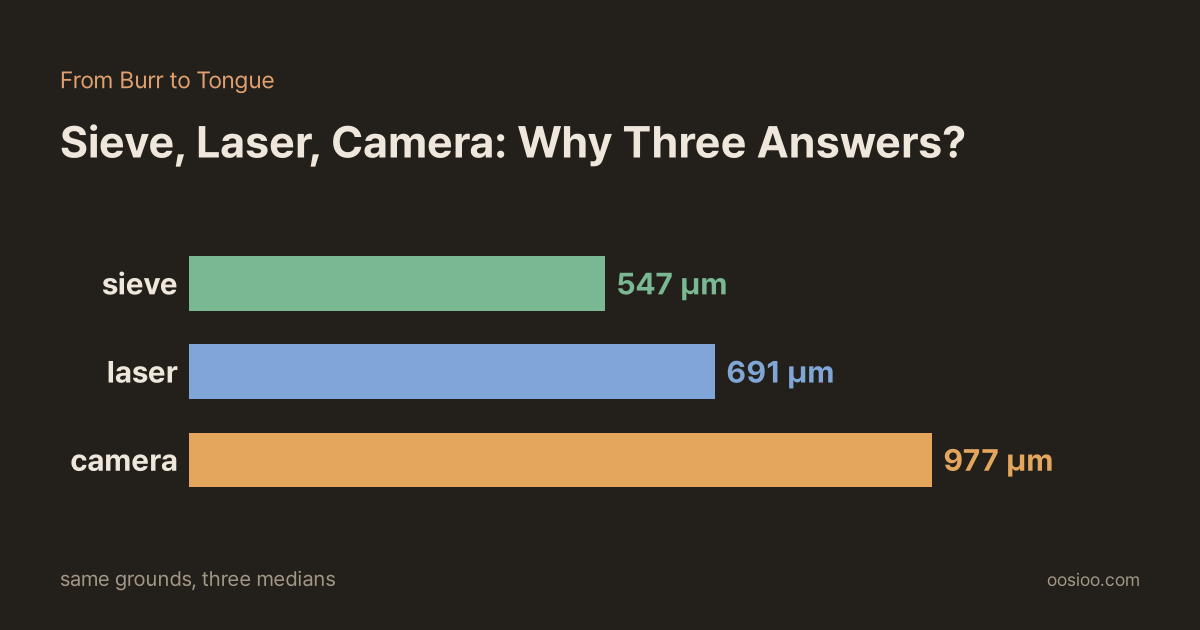
Sieve, Laser, Camera: Why Three Answers?
Measure coffee grounds with a sieve, a laser and a camera and you get three answers. Running virtual grounds with known sizes through all three, answers that agree within 1% for spheres split into 547, 691 and 977 µm for coffee-shaped particles. What laser diffraction really measures, and how far the belief that 'the laser is the right answer' holds.

Fake Coffee with a Known Answer
This series has measured Gagné's example photo many times without ever checking whether the numbers are right. I made fake photos in which every particle's size is known, tuned them to the real photo's blur, uneven lighting, noise and shapes, and graded the series' measuring algorithm. A volume-median error of 6% on smooth fakes became 33% on real-like fakes, and most of it came from touching particles caught as one blob.

Separating Touching Particles
Should touching coffee particles be split or thrown away? Using fake photos with a known answer, I graded discarding, the distance watershed, coffeegrindsize's breakup, Cellpose-SAM and a U-Net trained on fakes. Even discarding exactly the touching blobs threw out 93% of particles over 1.5 mm and shrank the volume median by 15%, and on the real photo the volume median ranged from 710 to 1,057 µm depending on the method.
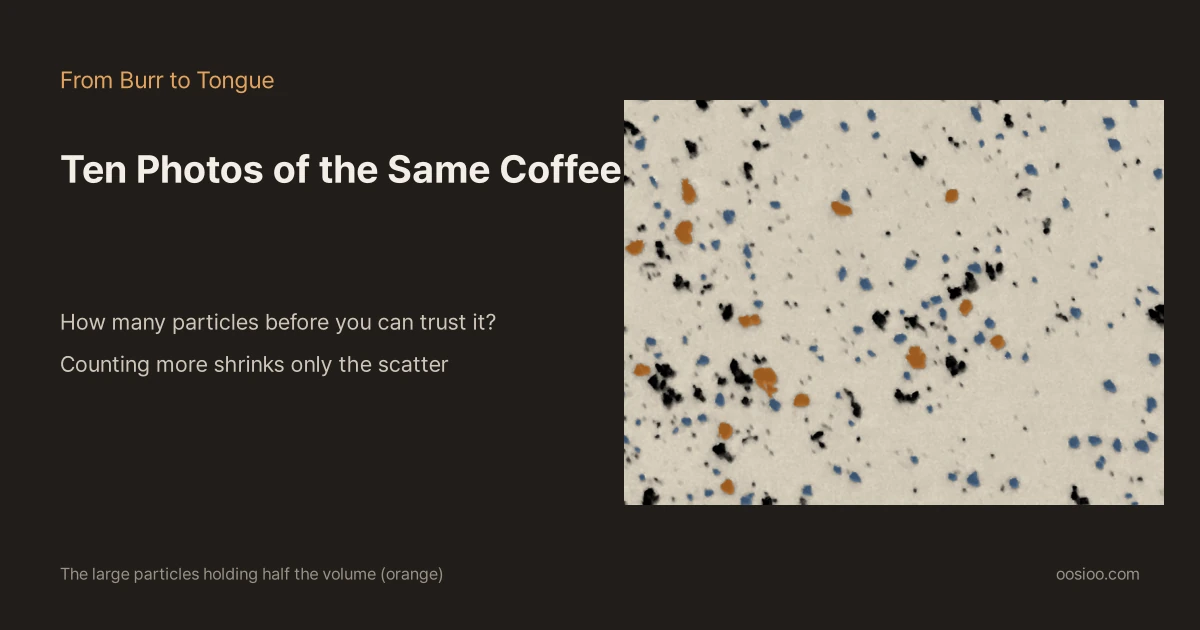
Ten Photos of the Same Coffee
How far can you trust one photo of coffee grounds? Using the bootstrap and a population with a known answer, I measured how many particles you need to count. Reaching ±5% took about 400 particles for the number median, 3,000 to 4,000 for the volume median and over 20,000 for volume D90, and pooling 30 fake photos of the same coffee left the measurement bias (+31%) untouched.
Checking Photos Against Sieves
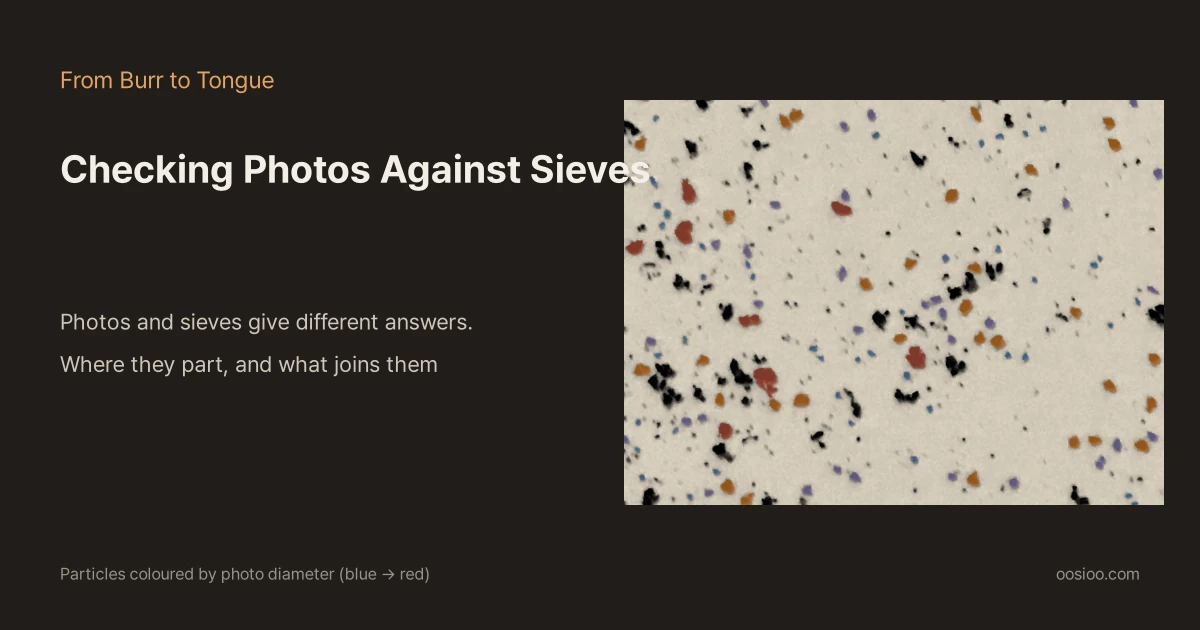
When you calibrate coffee-grounds photos against a sieve such as Kruve, what exactly are you calibrating? I ran round-hole sieves, square-mesh sieves and a photo on the same virtual coffee. The photo D50 came out 27% above the round-hole sieve (11% from the definition of diameter, 14% from unseen fines). A single factor missed by 7–10% when the fines share changed, but adding the weight from one 300 µm sieve to the photo's width matched within 1%.
Does a Different Graph Mean a Different Taste?
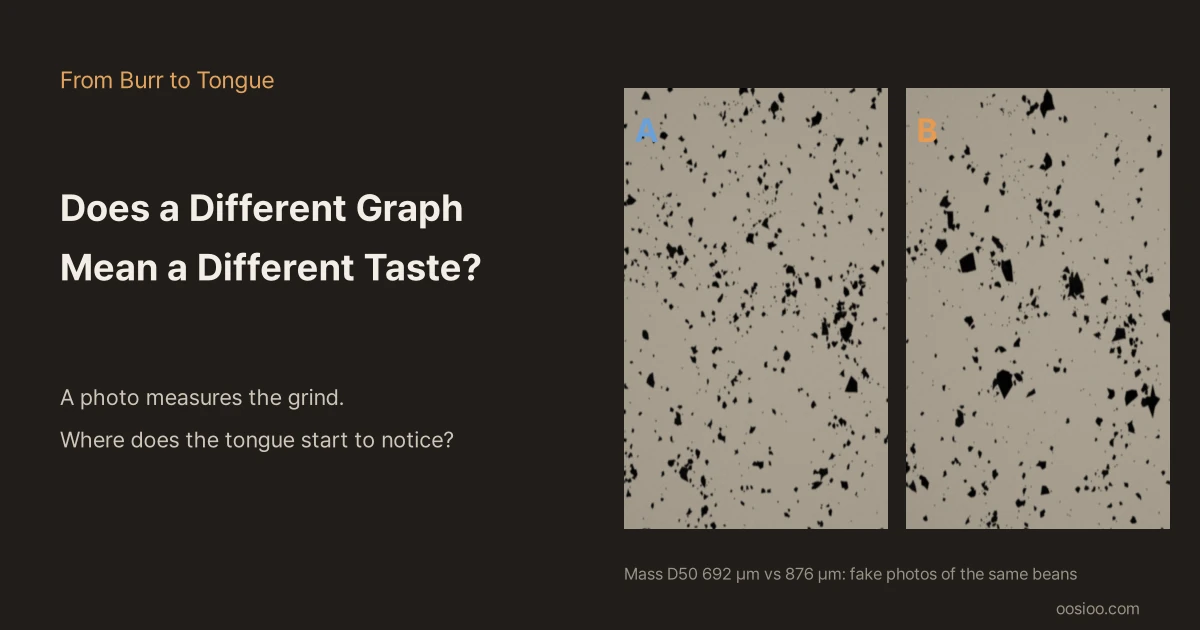
If two photo-measured grind graphs differ, do the cups taste different? In triangle tests people could not tell apart a 25% difference in median particle size (TDS +0.15 pt), and the threshold for drip TDS was estimated at about 0.24 pt. Immersion barely responds to the grind; in drip one taste step takes a D50 change of 50% or so, while a photo resolves 4%. AI eyeballing got the mass D50 within 7–13% but was pulled towards common sizes. Also: the Part 1 grind meter v1.
How Does a Coffee Bean Break?
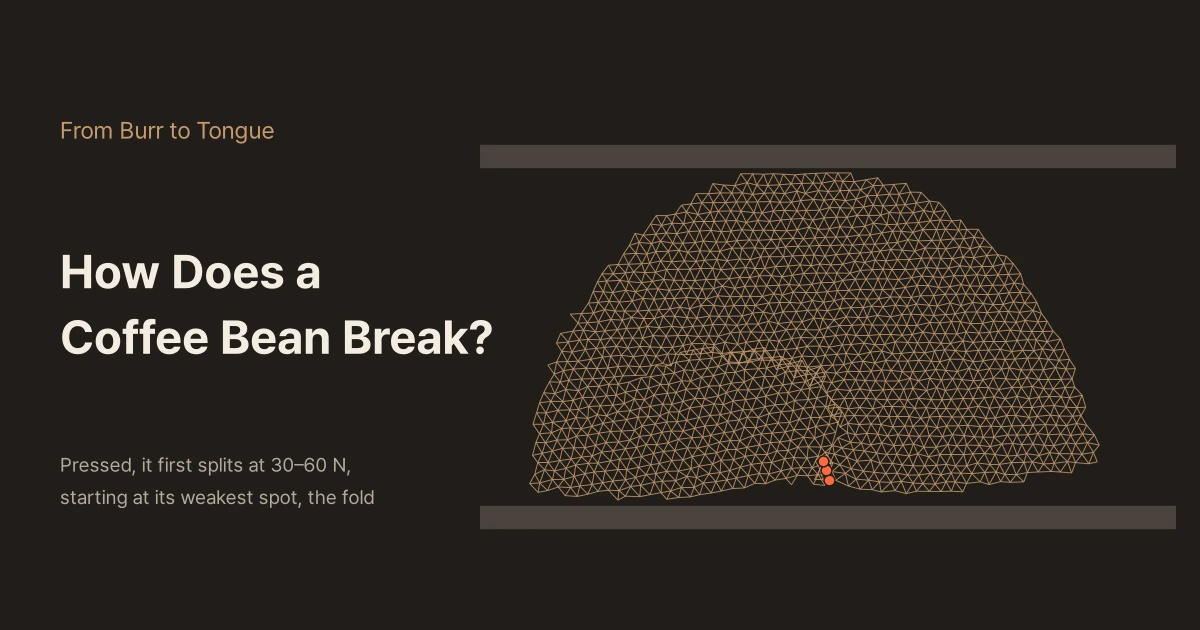
Pressed through its thickness, a coffee bean first splits at 30–60 N after squeezing 6–8% of its thickness, and it breaks in a saw-tooth, piece by piece, not into powder at once. Inside, a roasted bean is a dry foam with a porosity of about 0.5; at 8.8% moisture, the same grinder's main peak moved from 424 µm to 1,949 µm. In a bean-slice model tuned to measurements, most first cracks began at the centre cut. With a simulation you can press yourself, and a look at the weakest-link principle that makes smaller pieces stronger.
Fines Are the Size of a Cell
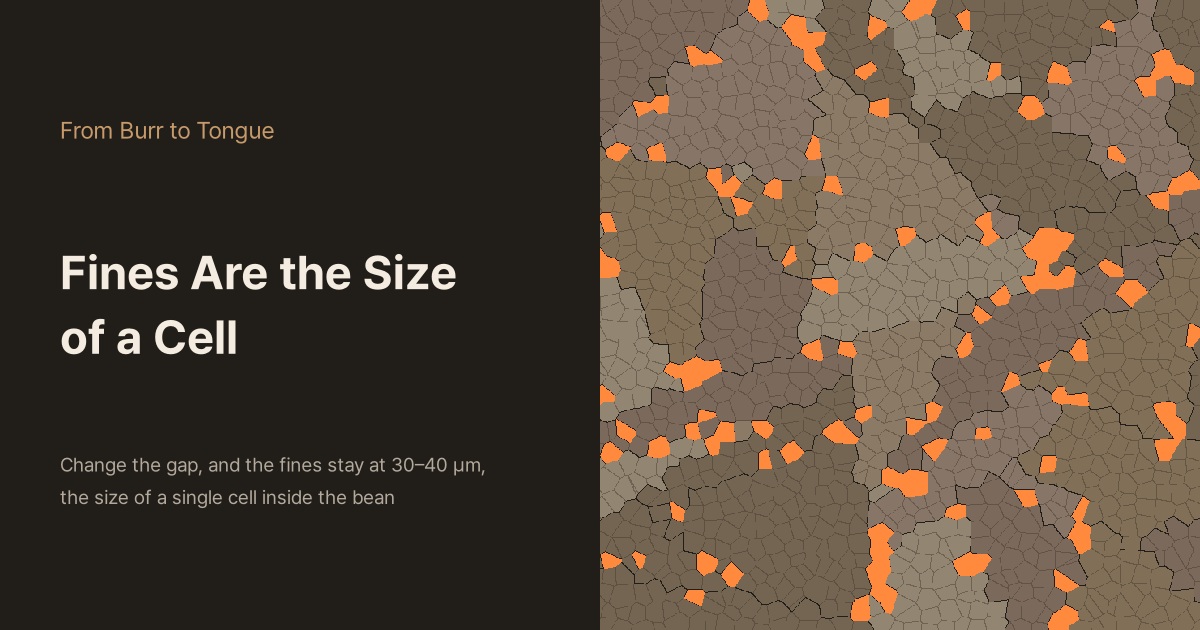
Turn the grinder dial and the large peak of ground coffee follows, but the fines peak near 30–40 µm stays where it is. The cells of a roasted bean are 20–45 µm across, the same size as that peak. In a cell-tissue model that only assumes cells along a crack fall away, the fines peak stayed at the cell size as the gap changed, and vanished when the cells were removed. The amount of fines roughly followed cell size ÷ gap. With a simulation you can grind yourself.
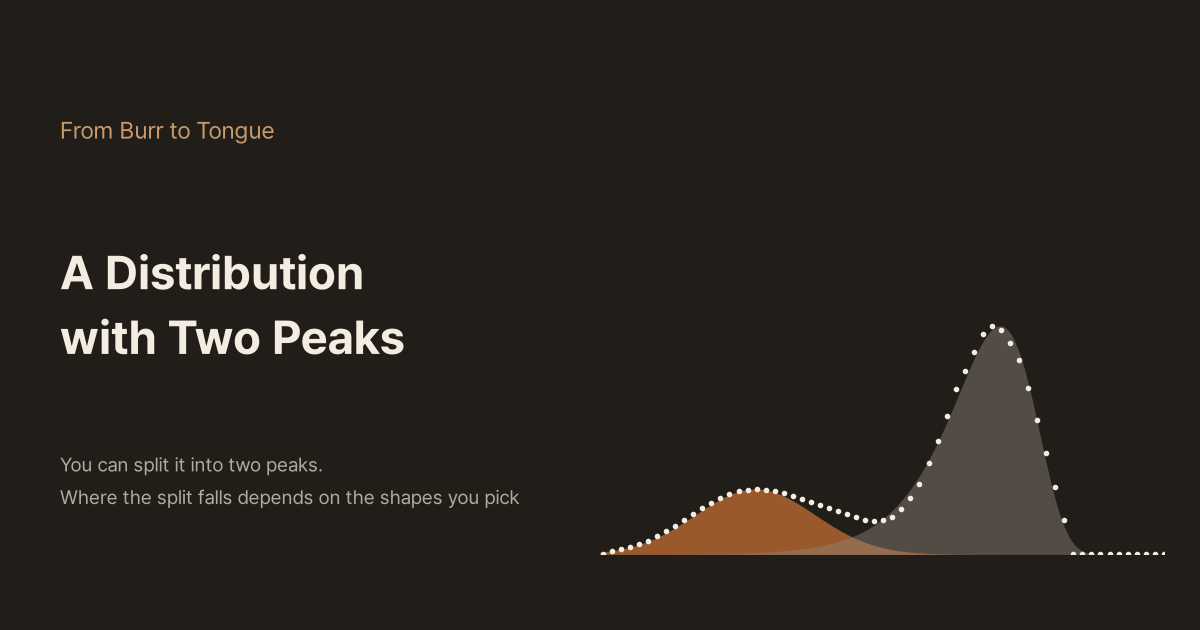
A Distribution with Two Peaks
The volume distribution of ground coffee has two peaks. The classic distributions of comminution theory, Rosin–Rammler and lognormal, have one, so they miss most of the fines, yet on Rosin–Rammler paper they still score R² of 0.93–0.95. Five-number mixture models follow the curve well, but the fines share they report varies by up to a factor of two with the shapes chosen. Using model grounds with true labels and the Part 1 camera data, I check what can be trusted, with a tool to try the fits yourself.
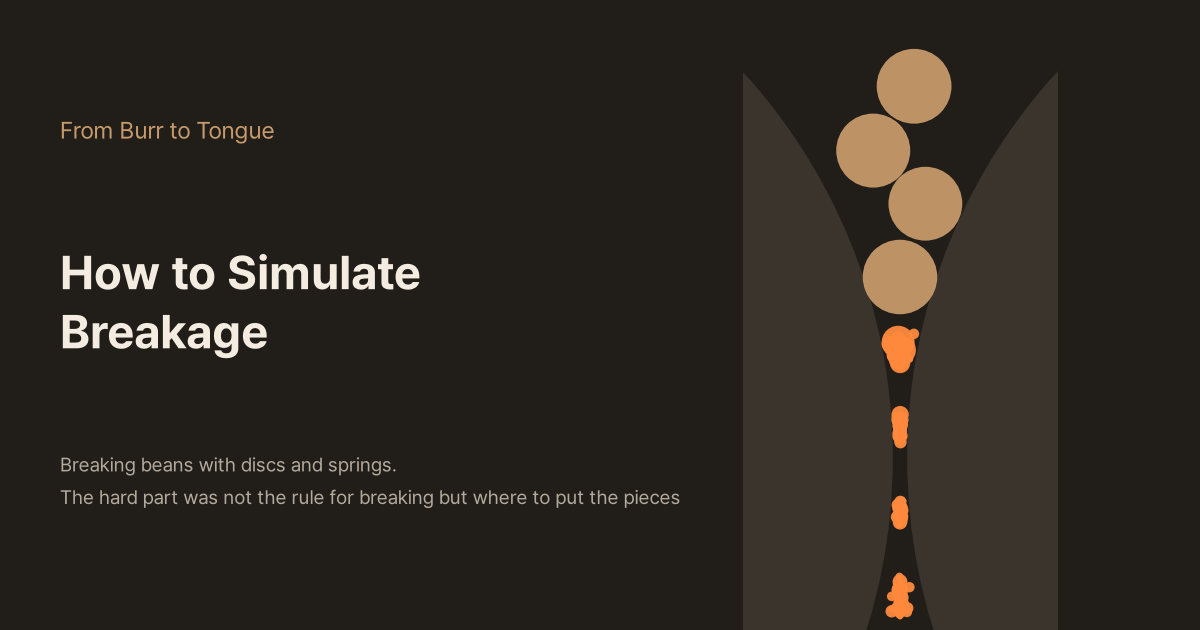
How to Simulate Breakage
The standard way to compute how beans break inside a grinder is the discrete element method (DEM). I built a 2D DEM from discs and springs and broke beans between two rolls. A bonded model shows the shape of the crack but did 4,000 times more work than particle replacement, and with particle replacement, where the fragments are placed changed the share going below 0.4 mm from 33% to 100%. Resolving down to the fines would turn one bean into ten million particles. With a simulation you can run yourself.
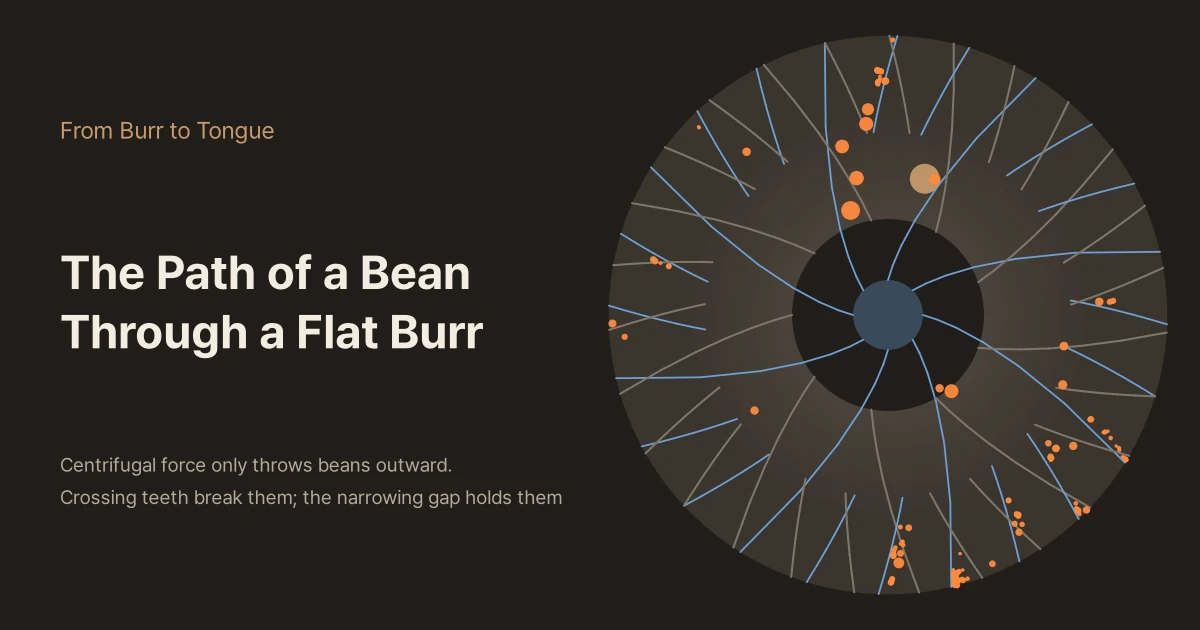
The Path of a Bean Through a Flat Burr
What path does a bean take between two flat burrs, and how long does it stay? With no study that measured the inside of the burrs, I built a virtual 64 mm flat burr in a 2D DEM and ground beans in it. Centrifugal force is a few thousandths of the breaking force, so it only sends beans outward; 82% of breaks piled up between crossing teeth where the gap finishes narrowing. At any speed from 300 to 2,000 rpm, a bean passed through while the burr turned half a revolution, and the gap changed how often beans broke rather than how long they stayed. With a simulation you can run yourself.
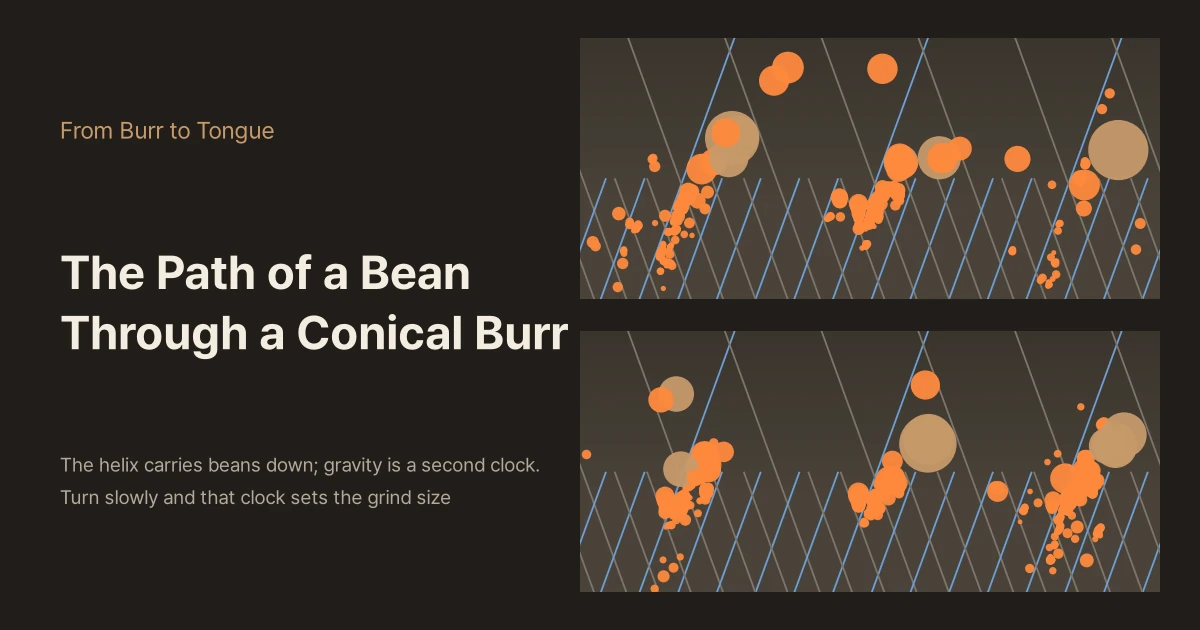
The Path of a Bean Through a Conical Burr
A hand grinder turns a little more than once a second, and electric conical grinders run at only 330–500 rpm. What sends the beans down: gravity or the helix? I built a virtual conical burr in a 2D DEM on the unrolled gap between cone and ring and ground beans in it. With gravity off, pieces passed in 0.7 turns at any speed, just as the screw-conveyor formula says. Gravity is a second, independent clock, so below 200 rpm the grounds came out coarser at the same gap (D50 450 → 820 µm). With a simulation you can run yourself.
Do Conical Burrs Really Make More Fines?
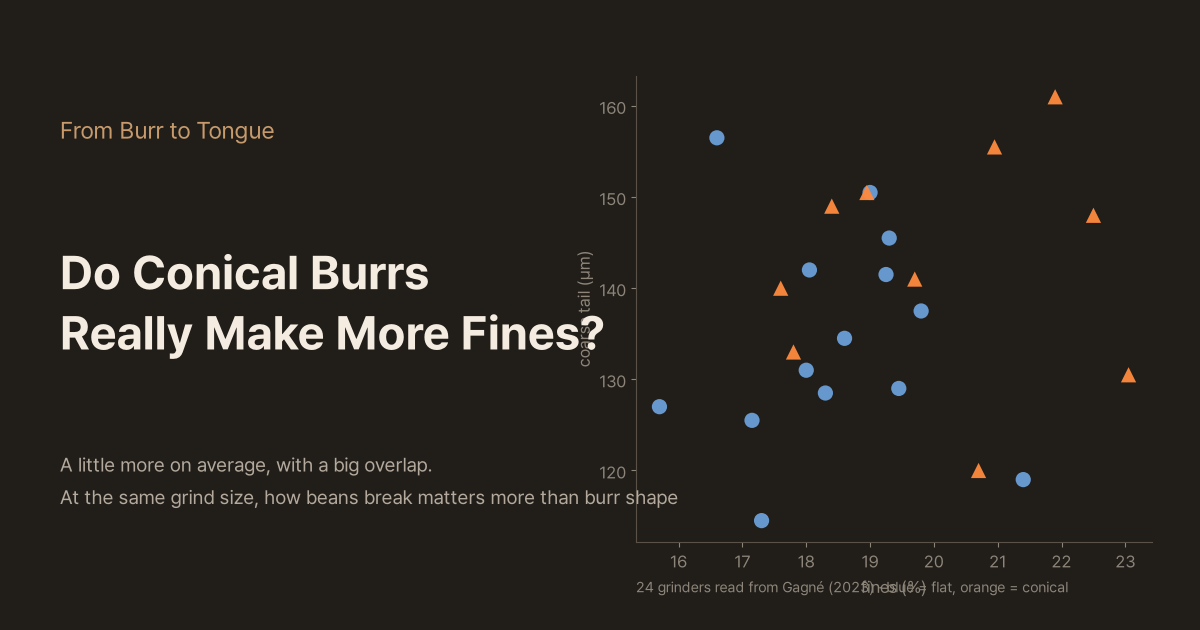
How true is it that conical burrs make more fines and two peaks while flat burrs grind evenly? In data from 24 espresso grinders (Gagné 2023), conicals averaged 1.8 points more fines, but the grinders overlapped heavily and all 24 had two peaks. Matching twelve virtual flat and conical burrs to the same grind size, the difference in fines was only about 0.4 points; the real difference was a long coarse tail in slowly turning conicals. With a tool for comparing them yourself.
Burr Size, Alignment and Seasoning
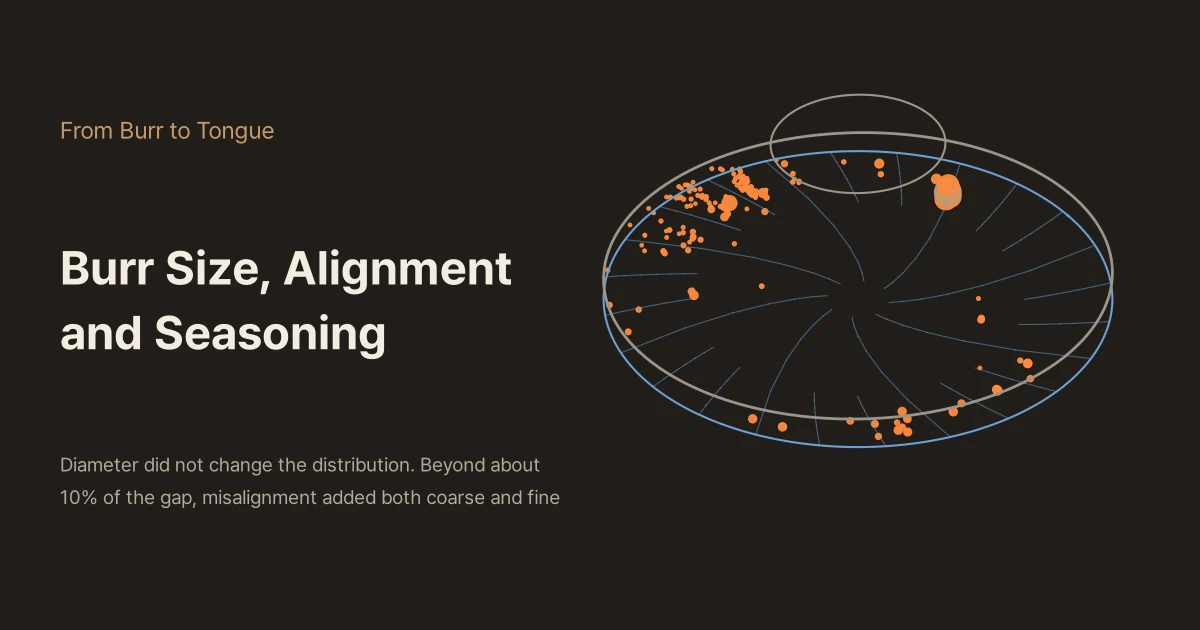
Are bigger burrs better, how much does a slight misalignment matter, and how long should new burrs be broken in? I moved the simulation to 3D to find out. Making the burr 1.5 times wider left the distribution unchanged. Edge errors within 8% of the gap made no difference; beyond 17%, a tilted burr sent coarse pieces out of its wide side and fine ones out of its narrow side, spreading the distribution both ways. The same 30 µm is 12% of an espresso gap. With a 3D replay and a gap map.
The RPM Mystery
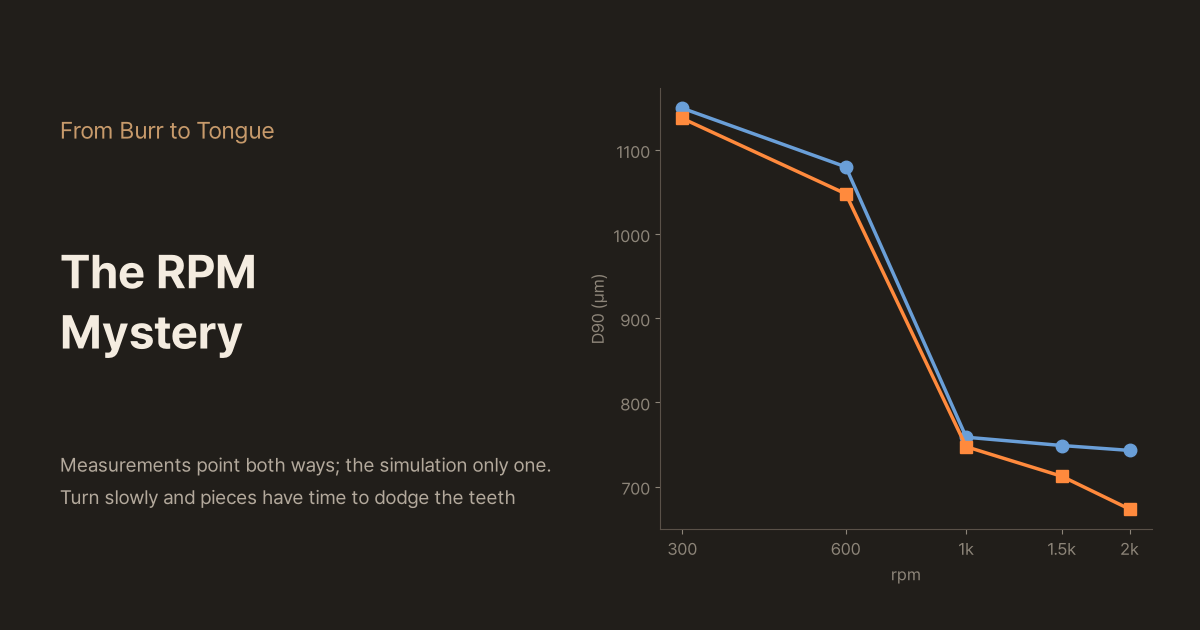
Raise the speed at the same setting: do the grounds get finer or coarser? Measurements and patents split into "faster is finer", "faster is coarser" and "no difference". Changing only the speed of a 3D virtual flat burr, faster always meant finer (D50 697 µm at 300 rpm, 430 µm at 1,000 rpm): at low speed, gap-sized pieces dodged the teeth and slipped out. "Faster is coarser" never appeared in the model; I list candidate reasons. With a comparison tool.
Do Frozen Beans Grind Finer?
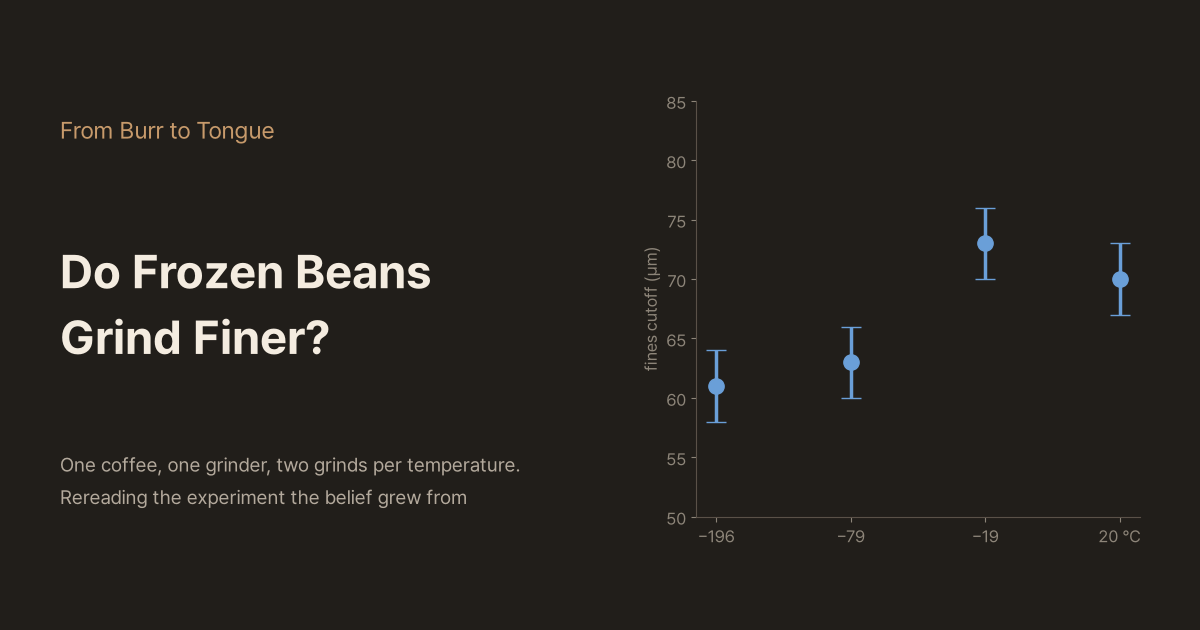
I reread Uman et al. (2016), the starting point of the idea that frozen beans grind finer and more evenly. It used one coffee, one grinder, one day and two grinds per temperature, with no statistical test of the temperature effect; on one metric, freezer beans (−19 °C) came out larger than room-temperature beans. The co-authors included people from the grinder maker, the instrument company and the café. Giving a virtual grinder candidate "cold bean" properties, none produced a finer and narrower distribution at once. With a tool for working out how many grinds you need.
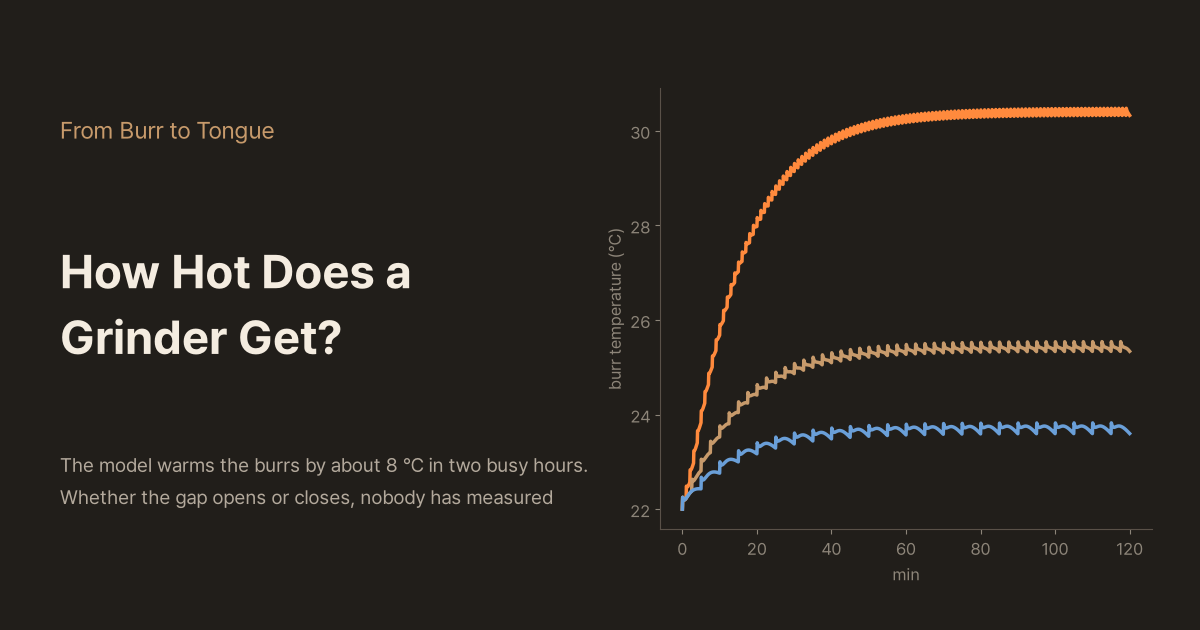
How Hot Does a Grinder Get?
Cafés tighten the grind as the afternoon goes on: is a warm grinder the reason? I found no public record of burr temperature during service, nor of the gap on warm burrs. Fitting a thermal network to the only two measured points (+12 °C in the grounds after ten minutes of continuous grinding), a shot a minute for two hours warmed the burrs by about 8 °C. A 3 µm gap shift changes espresso shot time by a little over 2%, but whether the gap opens or closes depends on the grinder's build. With a heat calculator.